
Priyaanka Arora
May 22, 2025
How Data Powers AI from Training to Real-World Applications
Most conversations about AI and data stop at the training phase. You’ll hear a lot about how large language models are trained on enormous chunks of text, or how vision models ingest image sets at scale.
That’s one part of the picture, but for AI to produce useful outputs in a real-world application, like helping a telecom operator detect fiber installation delays or a bank analyst explore predictive models, another layer of data comes into play.
AI data apps go beyond relying on training datasets. They pull live data from internal systems, connect to third-party APIs, and blend multiple sources into something interactive and usable.
This blog shares what that process looks like with real examples from Plotly customers, so you can move beyond the abstraction of “data for AI” and understand what powers an actual AI data application. This is a view into the data layer that enables applications to take meaningful, real-time actions based on user needs and model predictions.
What kind of data is used by AI?
AI uses two main types of data. First, there’s the larger datasets used during the training phase. Second, there is real-time and context-specific data that powers AI functionality within applications in a sort of live feedback loop.
When people ask what data AI uses, they usually mean the massive datasets that go into model training. These include publicly available datasets, internal company documents, and labeled data collected for supervised tasks. These are essential for getting a base model to perform at a high level.
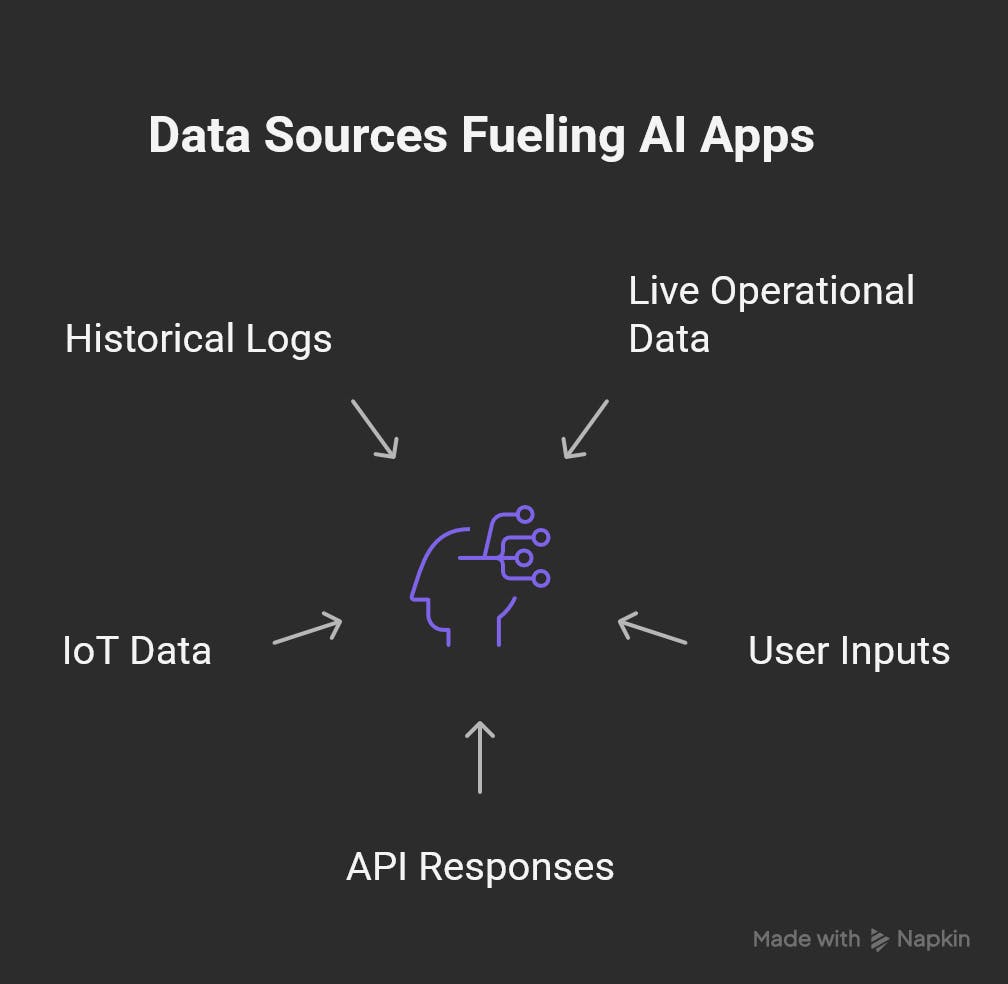
Additionally, AI uses data to operate in real-world environments. That data fuels every interaction a user has with an AI-powered application. It includes:
- Live operational data coming from systems like CRMs, ERPs, and monitoring tools
- User inputs, feedback, and behavioral patterns
- Responses from integrated APIs such as weather feeds, pricing databases, or market data
- Data from IoT devices or hardware sensors
- Historical logs or transactional data used for context and comparison
This kind of data doesn’t exactly shape the model's weights, but it directly shapes what the user sees, experiences, or is able to do within an AI data app.
Types of data AI can parse
Modern AI models can handle a wide range of data types and formats. Each format comes with different parsing needs and implications for how well the model can reason over the information:
- Structured data: clean, relational formats like SQL databases, data warehouses, and spreadsheets
- Unstructured data: documents, images, PDFs, slide decks, emails
- Semi-structured data: JSON, XML, telemetry logs, event payloads
- Raw or noisy data: sensor feeds, scraped web content, freeform text, or handwritten input
Vector embeddings and retrieval augmented generation (RAG) techniques make it possible to extract meaning from messier inputs. This opens up more real-world use cases that were previously inaccessible due to data quality or formatting barriers.
How data flows into an AI-powered data app
Creating an AI-powered data app means connecting systems that were never built to work together. The general flow includes:
- Source systems: where the raw or curated data originates, such as SQL servers, NoSQL databases, IoT sensor feeds, or external APIs
- Pipelines and storage: intermediary services like Redis, Celery, or message queues that help with caching, orchestration, and durability
- Preprocessing and shaping: data is cleaned, reformatted, pivoted, and mapped to match the application’s expected schema
- Model interaction: structured or embedded data is passed to an LLM or other AI model for transformation, interpretation, or response generation
- User interface: front-end interfaces like Dash apps allow users to explore data visually, issue queries, or interact with chatbots that understand context
This isn’t a one-way pipeline. Data flows in both directions, and each user interaction can create new data that feeds back into logs, dashboards, or retraining efforts.
Challenges with generative AI and live data
Generative AI is powerful, but deploying it inside data apps comes with hurdles:
- It struggles with parsing incomplete, contradictory, or noisy data
- Outputs may look convincing but contain factual errors, especially without tight prompt constraints
- Data latency and freshness become more visible when users ask time-sensitive questions
- Cost and performance tradeoffs appear when integrating large models with high query volume
- Compliance and privacy concerns arise if models access sensitive or regulated data
These problems can be managed, but only when the architecture anticipates them. Properly scoping what the model can see, how it queries data, and how responses are validated is critical.
Agentic AI changes the interface, not the pipeline
Agentic AI introduces a model-driven layer that manages subtasks, orchestrates actions, and even re-queries based on results. Instead of a single model giving a single answer, you may have a loop of agents working toward a goal and incorporating external systems.
However, the core data foundation stays the same. Agents still need structured, accessible, and well-defined data sources. Their autonomy only adds value if the data is accurate, clean, and available when they need it. Poor data flow limits what these systems can do, no matter how sophisticated the orchestration logic becomes.
Examples of data use for AI applications from the field
Broadband Insights uses Plotly Dash Enterprise to combine third-party API data, internal PostgreSQL databases, and AI-generated SQL in a multi-page dashboard. Their chatbot supports two core use cases. First, it helps users generate SQL queries using the Ollama LLM. Second, it answers high-level trend questions using OpenAI, helping stakeholders quickly interpret metrics like monthly subscriber growth. The chatbot is aware of schema and table definitions and can interpret queries even if the user includes small typos or vague language. To make this possible, the team shaped their dataframes into formats that mimic long documents so models could more easily extract trends.
CIBC's Quantitative Solutions team deploys custom machine learning models through interactive Dash apps. These apps connect directly to internal data systems and Databricks notebooks, making it easier for users to interpret and act on model insights. This internal deployment model provides fast, secure access to machine learning results within the CIBC intranet.
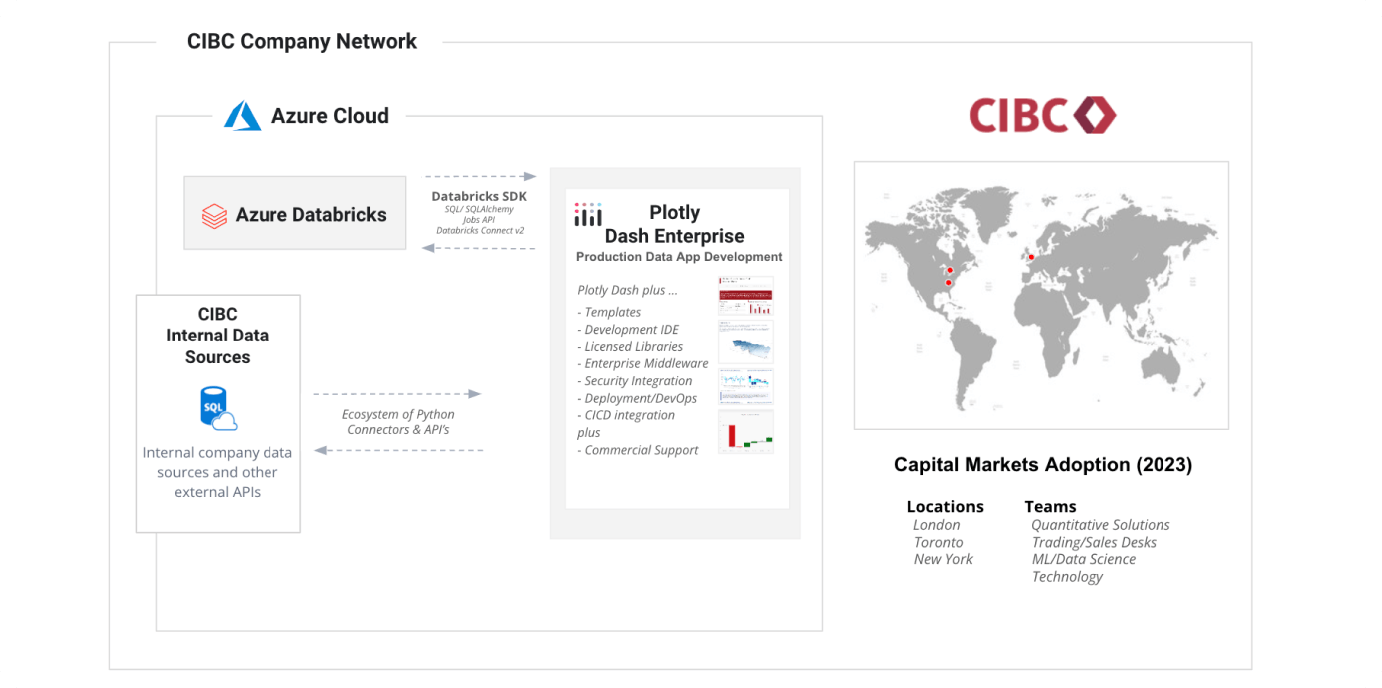
CIBC's data application architecture for ML apps
Martin Engineering developed a predictive maintenance app by aggregating sensor data from industrial equipment. The app shows alerts across multiple sites, helping teams respond to maintenance issues like failing conveyor belt components. The backend stack involves LoRaWAN-connected sensors, AWS IoT services, and multiple databases including Timestream and RDS. The app also includes a mobile interface for logging on-site actions and integrates with Plotly Dash to visualize sensor data over time. This data architecture supports real-time monitoring and strategic planning in one view.

A look at Martin Engineering's on-site sensor information dashboard.
Why Plotly Dash Enterprise is built for AI-powered data apps
Dash Enterprise is built to support AI-native and AI-assisted data applications. It supports any Python data connector, which means teams can pull from PostgreSQL, Snowflake, Databricks, S3, APIs, or even flat files. Built-in authentication and role-based access control ensure secure data usage, especially when exposing model outputs to a wide user base.
With Plotly AI features like the Chatbot Builder, teams can incorporate LLMs in a controlled and user-friendly way. Developers can plug in OpenAI, Azure OpenAI, Ollama, or Anthropic models and bind their outputs to queries, charts, or dashboards. Dash apps give teams a way to operationalize their data and model insights without switching contexts or platforms.
This data layer is what turns AI from potential into production. When the right systems are connected, even complex models become usable, interactive tools.
Check out Dash Enterprise to see how teams are building and deploying real AI data apps.