
Domenic Ravita
June 21, 2024
Playing Plotly Hits from Data+AI Summit 2024
Recently, a few of us escaped the sweltering heat sweeping through North America to spend a cool, refreshing few days in San Francisco at the Data + AI Summit. Having recently joined Plotly to lead Marketing, it was a terrific opportunity to meet customers, partners, and see Plotly in action. I could not be more excited about the company and seeing what you all are building with Plotly technologies, much of which was on display at the event.
This was our 3rd year participating and perhaps the best ever with several customer speaking sessions, after parties, and even a friendly peregrine joined us. Whether you were at Data + AI Summit and struggled to hear it all, or missed it completely, this is your on-the-ground playlist straight from the halls of the Moscone Center.
Reunited (and it feels so good)
Conventions are for reuniting with your community, customers, former co-workers, and making new connections. With over 16,000 people and 143 partners in attendance at this year’s event, there were ample opportunities to do that. Plotly was in full force along with our customers, our community, and partners who exhibited in the showcase or presented on Plotly such as S&P Global, Shell Energy Australia, Bloomberg, NVIDIA, AWS, Lakeside Analytics, and Databricks. Keep reading for more about these talks.
We kicked off the week with a celebration of our customers in an event kickoff reception and dinner at a nearby clubby gastropub. Conversations were lively around what AI means for how we build data applications, create and distribute data products, and just how to navigate the next three days at the event.
Plotly wins Customer Impact Partner of the Year
Meanwhile, across town part of our team was representing Plotly at the Databricks Partner event. Our CEO, Jim McIntosh, co-founder, Chris Parmer, and partner lead, Dave Gibbon, had the distinct pleasure of receiving the Databricks Customer Impact Partner of the Year award. Databricks shared this with the announcement:
“Plotly wins Customer Impact Partner of the Year for achieving significant growth in mutual customers and communicating the value via impactful customer stories. Their innovative integrations with the Databricks Data Intelligence Platform and effective storytelling via case studies showcase their ability to streamline data processes, reduce costs, and accelerate time to value for customers.”
The recognition highlights the joint value of Plotly + Databricks customers like S&P Global, CIBC, Uniper, and others. This award is for our customers. We thank all of you for your amazing work in solving operational challenges through their innovations delivered through data applications in production leveraging Plotly.

Plotly Jim McIntosh (CEO), Chris Parmer (CPO and Co-founder of Dash), and Dave Gibbon (Sr. Director - Strategic Partnerships) accepting the Databricks Customer Impact Partner of the Year award.
Plotly named top data and AI product
The Customer Impact award was one of two major announcements from Databricks on Plotly. The second was in the 2024 State of Data + AI. This is a report backed by data from an annual survey Databricks conducts across their 10,000 customers which includes 60% of the Fortune 500 and focuses on trends in machine learning, the adoption of GenAI, business intelligence, data governance, data integration, and use cases. It also covers the most widely-adopted technologies used with Databricks in joint projects and solutions. Data was collected from February 2023 to March 2024 in this year’s survey and there were several interesting findings.
Among the top 10 most widely-adopted technologies this year, 9 out of 10 were open source technologies. Taking the #1 spot by a large distance was Plotly Dash. Other popular technologies in the top 10 included familiar names such as Hugging Face, dbt, and LangChain. For long-time users of Plotly Dash, it’s no surprise that it is popular among Databricks customers. Both Plotly and Databricks provide Python-oriented technologies aimed at enabling data teams, data scientists, computational scientists, and domain experts to better serve their organizations.
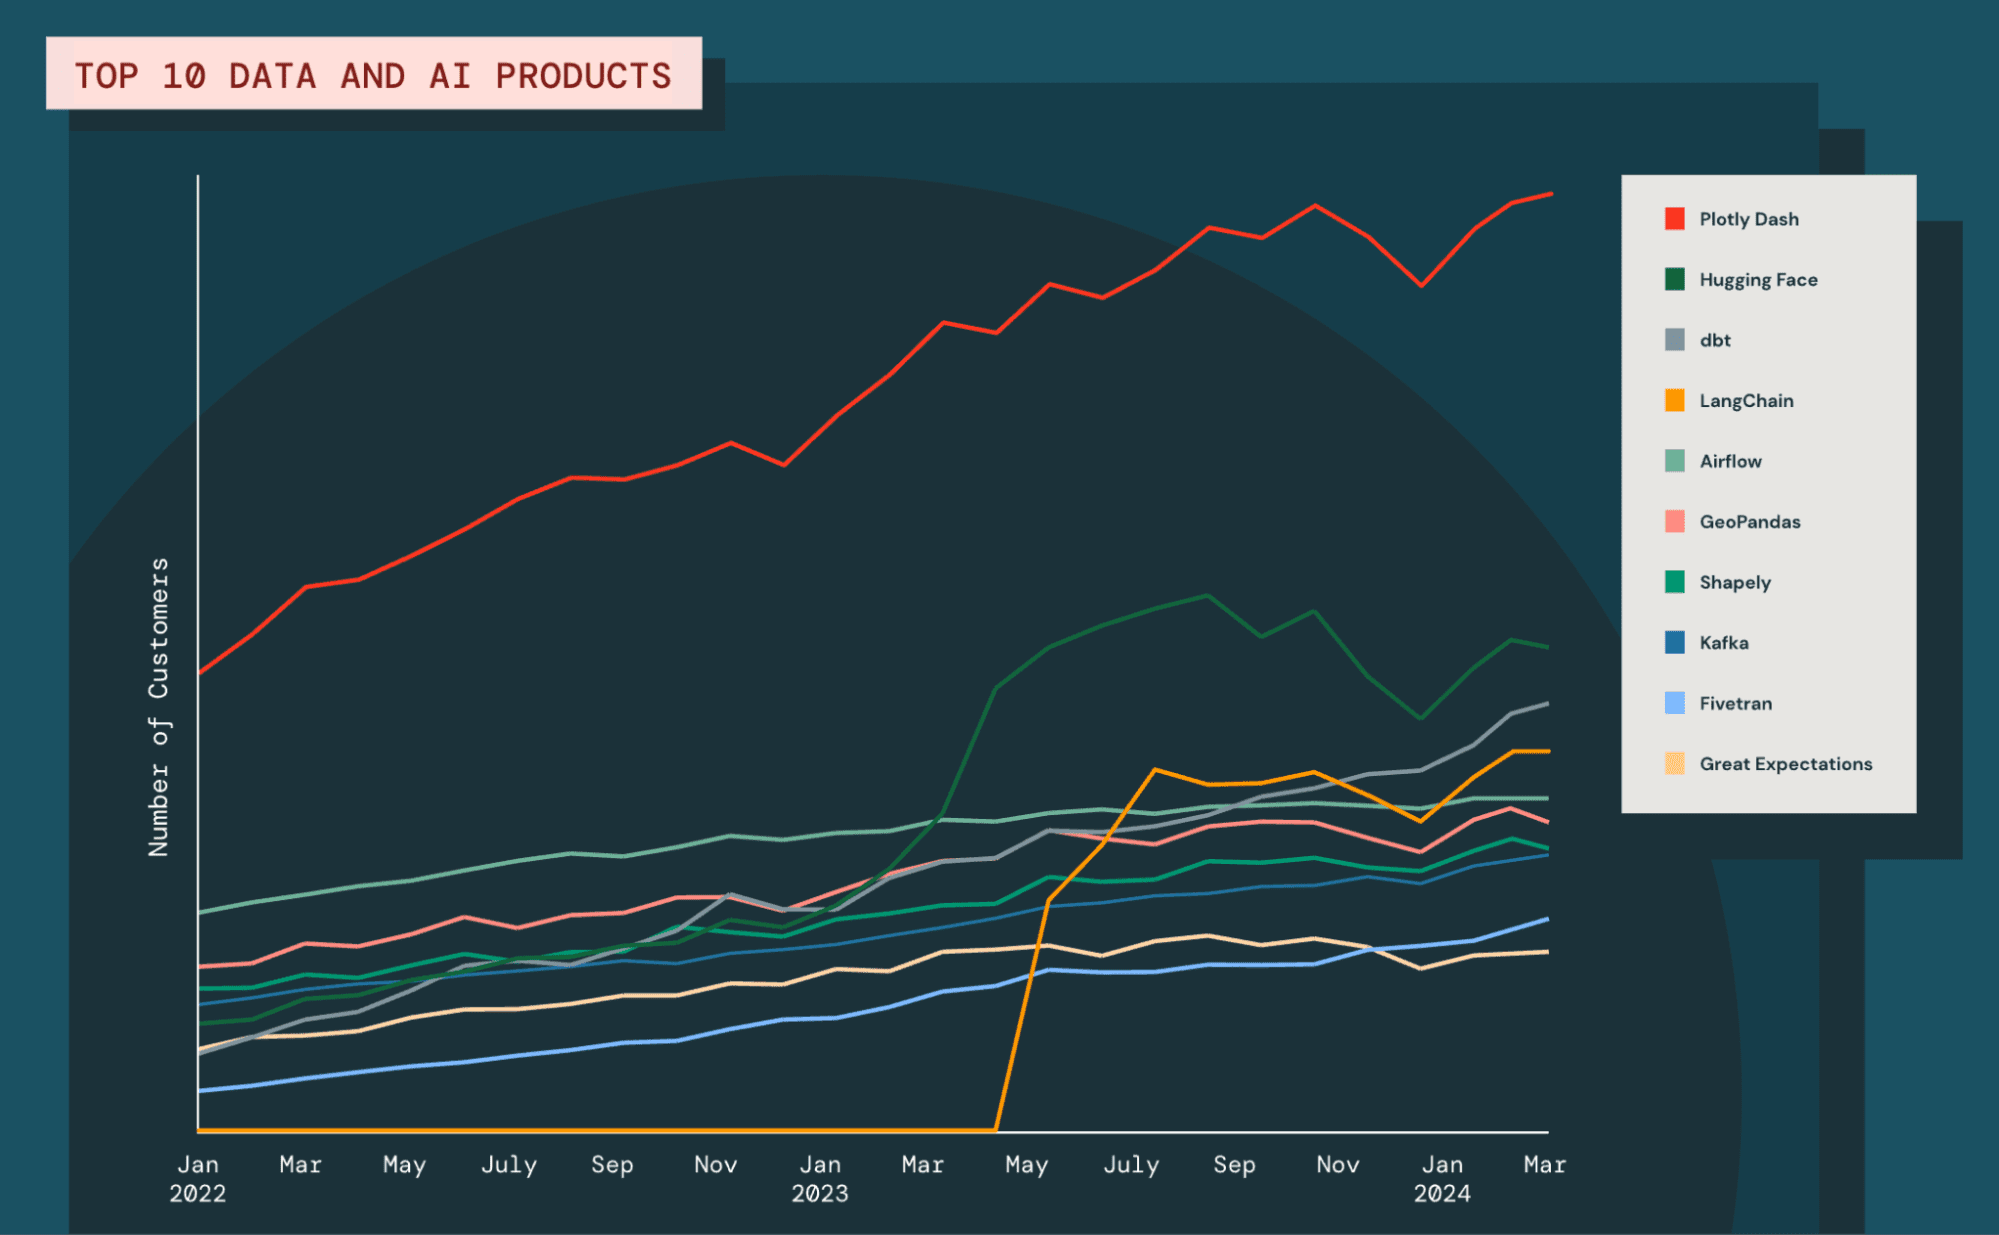
Plotly is the 2024 Top Data + AI Product
Given Databricks’ position as one of the leading data science, analytics & AI infrastructure companies, this survey is significant. According to the report,
“For more than 2 years, Dash has held its position as No. 1, which speaks to the growing pressure on data scientists to develop production-grade data and AI applications.”
And getting applications into production is not a slam dunk. McKinsey among others have reported that
“approximately 90 percent of data science projects do not make it into production and usage in the field, suggesting the last five years of digital transformation have been defined more by proof-of-concept AI than operationalized value.”
So, operationalizing data and insights remains an industry-level challenge and Plotly seeks to close the gap. Plotly Dash Enterprise is focused on making it easier to create and share the most flexible and customizable interactive data applications for production to put data science into action while providing the parameterized controls that let the business steer.
The Plotly and Databricks partnership
It’s worth noting that Plotly and Databricks are good partners and technology complements for much deeper reasons than market trends alone. We see the world from similar perspectives, serve similar audiences, and have similar philosophies. In the opening keynote of the conference, Databricks emphasized that every company aspires to be a data & AI company and Databricks intends to help democratize the ability to become that, in part, through open source software for the new kind of open data and AI infrastructure needed to enable that.
Plotly’s mission is to enable companies to do the same, but we work at the application level to help make that a reality and leverage the sort of data & AI infrastructure Databricks provides. Plotly enables companies to embed data & AI applications in the core operations of their business, industrial, and scientific functions and processes so they can make decisions and take actions in the moment. Plotly’s approach to democratizing this capability is also driven by open source.
Both companies are serving the data teams and domain experts at companies who are investing in becoming data analytics & AI leaders in their industries. They also made the point that compound AI and agentic systems were needed to deliver trustworthy AI applications and Plotly sees it the same way. LLMs are inherently probabilistic and require more checks and balances to ensure quality. The industry is still experimenting with how to apply them to production data applications, including Plotly. Our own compound AI system journey began by offering the Chatbot Builder to leverage LLM APIs in the building of your data applications and later this year we’ll be releasing a significant advancement that embeds LLM capabilities deeper in the workflow of Plotly Dash Enterprise providing higher-quality interactions and greater productivity to data application developers. We also see an increasing number of companies building compound AI applications which incorporate LLMs and agentic workflows.
We look forward to sharing some of this work in future customer stories. In the meantime, if you’re interested in some key how-to information on building compound and agentic AI systems with Plotly, crack your knuckles and start typing along with these videos and then enter the generative AI arena with Plotly by joining the DBRX with Dash App Building Challenge which continues through the end of June 2024.
Listen to the Music
Concrete implementations of Plotly and Databricks were on display everywhere. Hearing data scientists and data teams talk about the impact of their Plotly data applications was music to our ears. The range of topics for the talks included real-world implementations, production data apps for both internal- and customer-facing applications, and novel technology integrations. We’ll cover the 5 most significant ones we came across.
- Production Data Applications for AI-driven Observability – Databricks’ Cody Austin Davis shared how he leveraged Plotly Dash to build an application for observability of Databricks infrastructure. He began by sharing his view on the core elements that define a production data application, which is the ability to combine data, AI, and BI capabilities to connect insights to actions in a single user experience, embed insights into the daily workflow of non-technical end users, and share insights to enable those end users to take action when they need it. We love this description as it fits our message of collaboration, customizability, and control we offer data teams and application users. The problem Cody’s data application addressed was the lack of visibility and monitoring of usage and lack of cost controls of Databricks infrastructure. The observability application leveraged Databricks APIs and an embedded LLM to enable users to ask questions of the data, setup charts and create custom actions. When it comes to infrastructure observability and drilling down into metrics, logs, and traces, Grafana Labs often comes to mind. As a leader in IT observability, they have a plugin which embeds Plotly visualizations called the Grafana community plugin for Plotly which is worth a look.
- Power S&P Capital IQ Data Apps with Databricks and Plotly – Head of Analytical Platforms at S&P Global Market Intelligence, Onik Kurktchian, discussed how they approach converting data into insights and delivering data products to their customers. One of those data products is Capital IQ which was originally built using Tableau but has been migrating and expanded with Plotly Dash Enterprise and Databricks. Onik provided his definition of what a data application is which is an “interactive, web-based application, with a visual component, designed to enable a more sophisticated and deep analytics of data to end users”. Capital IQ data applications provide a curated web experience to discover, explore, and consume data products which allow them to analyze deep data based on specific workflows, such as trending topics from earnings call transcripts and other unique S&P data. These Plotly data applications leverage Databricks Delta tables and Databricks SQL Serverless.
- Petabyte Pitstops with Mercedes, Databricks SQL, and Plotly Resampler – Sachin Seth from Lakeside Analytics explored how he created high-density visualizations to interact with trillion row datasets using Plotly and Databricks. The use case was fleet management and analytics similar to Mercedes which generate terabytes of time-series measurements per minute for 100 of vehicles. The approach used a sophisticated down-sampling algorithm, largest triangle three buckets (LTTB), so the unique quality of the measurements variations were retained with no fidelity lost. This algorithm is implemented in the open source Plotly Resampler library and can be used directly in data applications using the Plotly Dash AIO component. The live demonstration of the interactive drilldown through a trillion rows in Ploty Dash was remarkable. It’s the only talk of the week where I witnessed multiple rounds of applause during a demo and so much praise and thanks during the Q&A session. This talk is a must-watch.
While all of this was happening inside the Moscone center, there were numerous peregrine sightings across San Francisco. In case your knowledge of the animal kingdom and ornithology is a little rusty, peregrines are the world’s fastest animals reaching over 240 mph in their high-speed dives pursuing prey. We couldn’t help but draw the similarity of this behavior to data teams’ high-speed dash delivering data and insights with Plotly. These aren’t the single-player scenarios with notebooks or quick, single-page prototypes with Streamlit that your friend Sridhar yammers about. These Plotly data applications go beyond prototypes and go beyond BI. These are move-the-needle production data applications we’re squawking about after all.
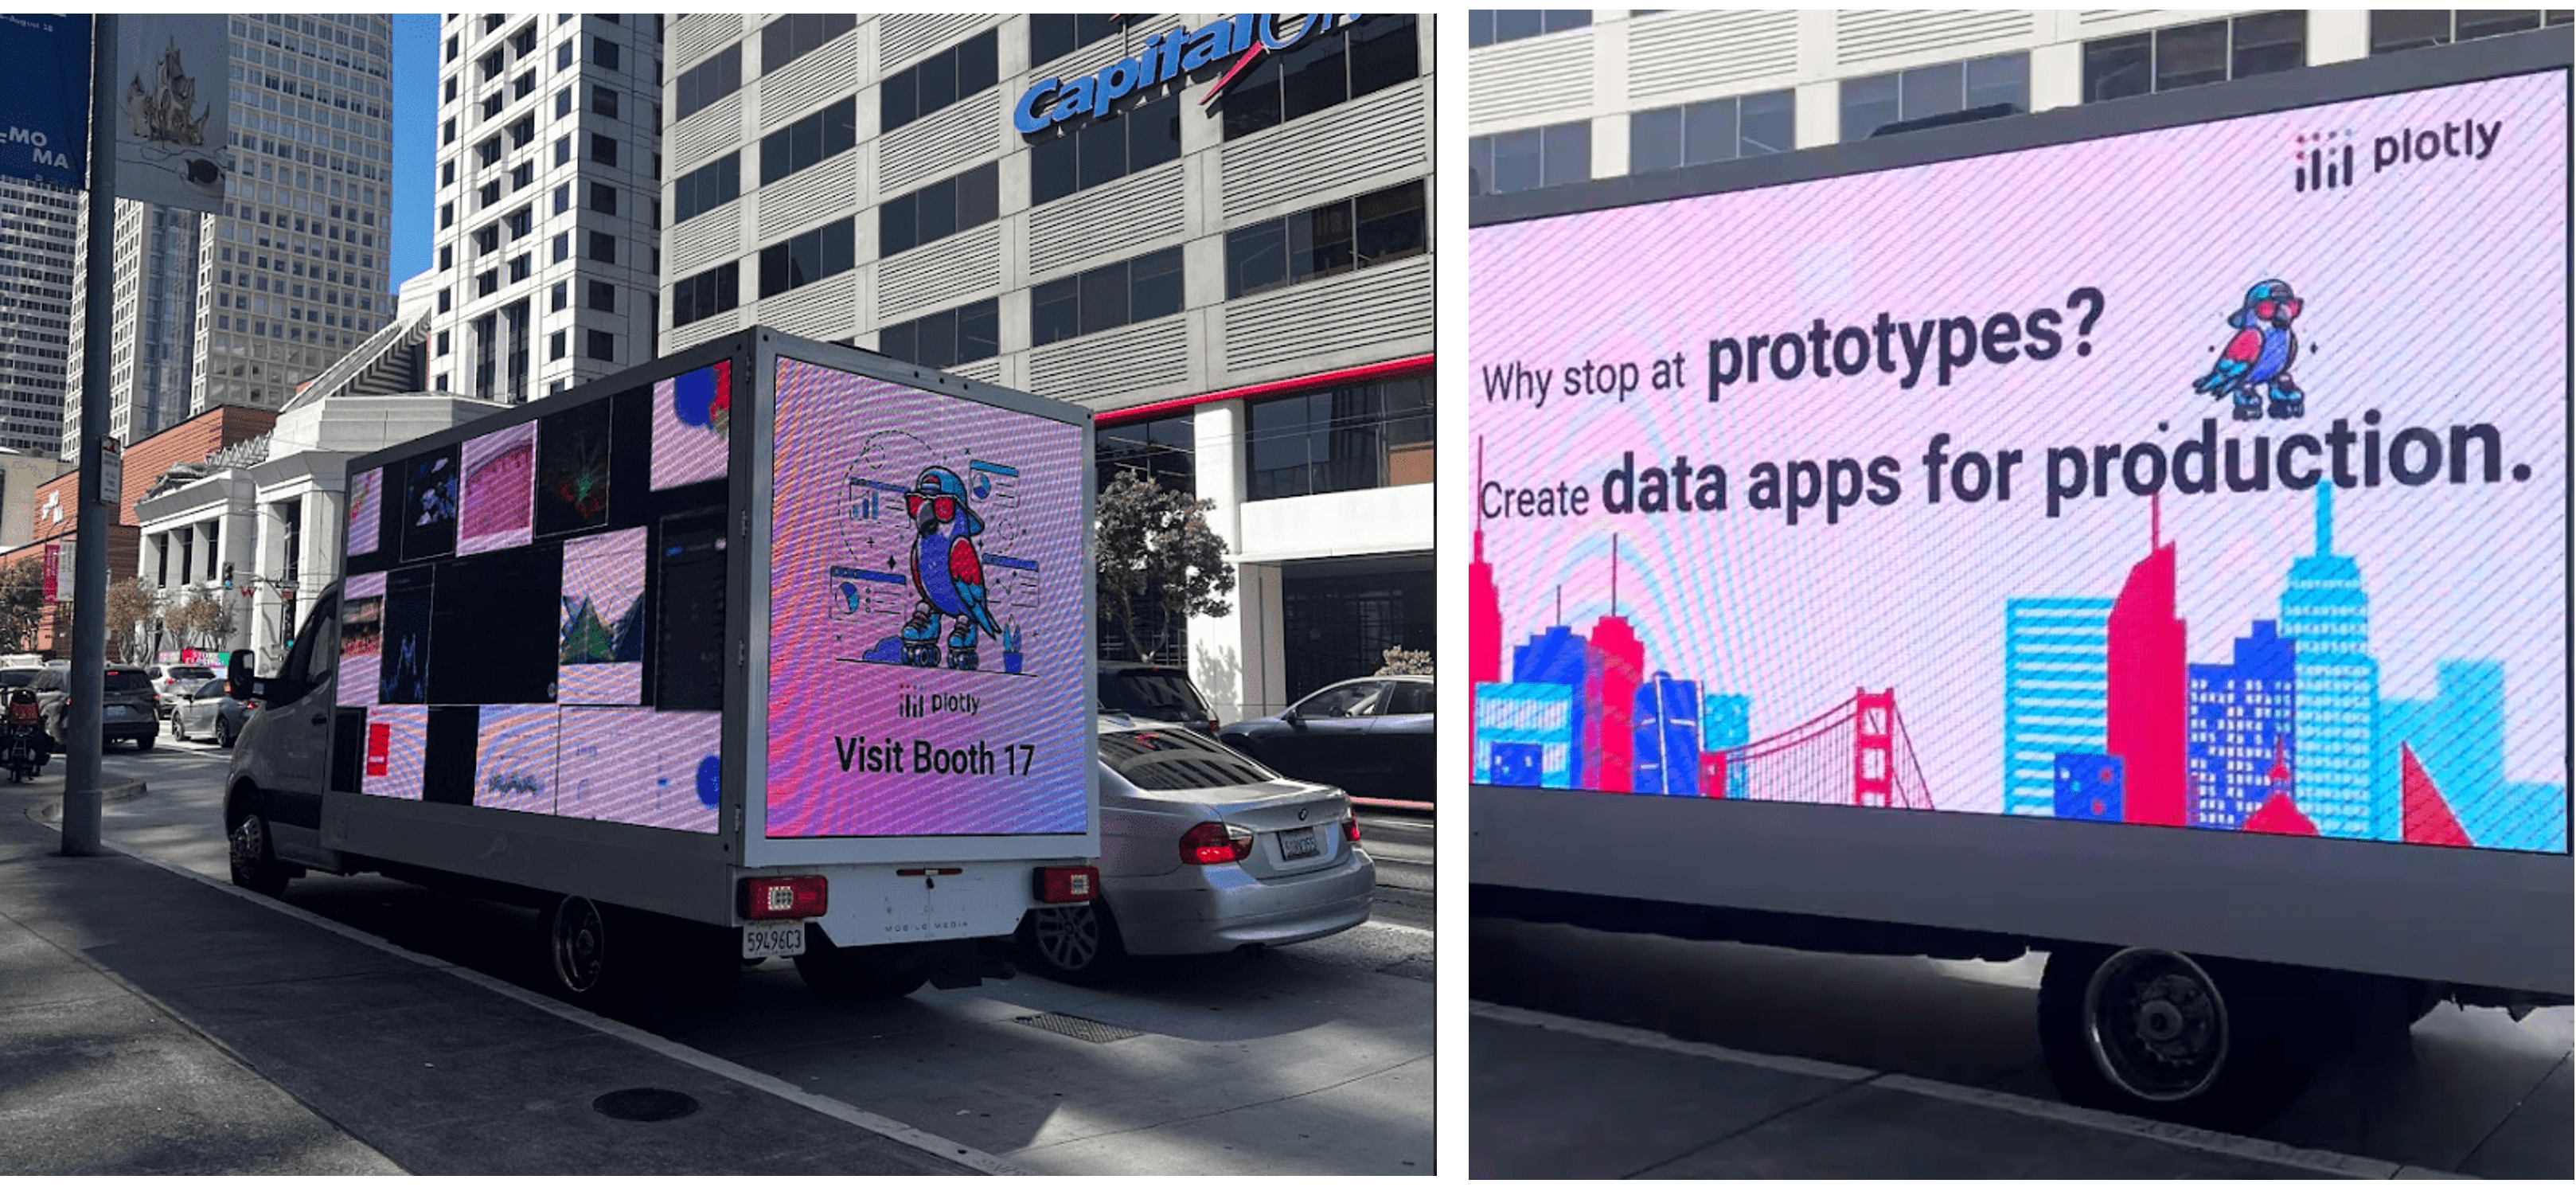
Ads on a few trucks circling the Moscone Center showcasing the Plotly peregrine falcon.
Quite a lot of attendees heard the call and visited the Plotly booth. Some even were prompted in text chains or simply because they were a Dash namesake. Many shared their love for Plotly, learned about what’s new on Planet Plotly, and left with a peregrine of their own, or at least a sticker or t-shirt of one.
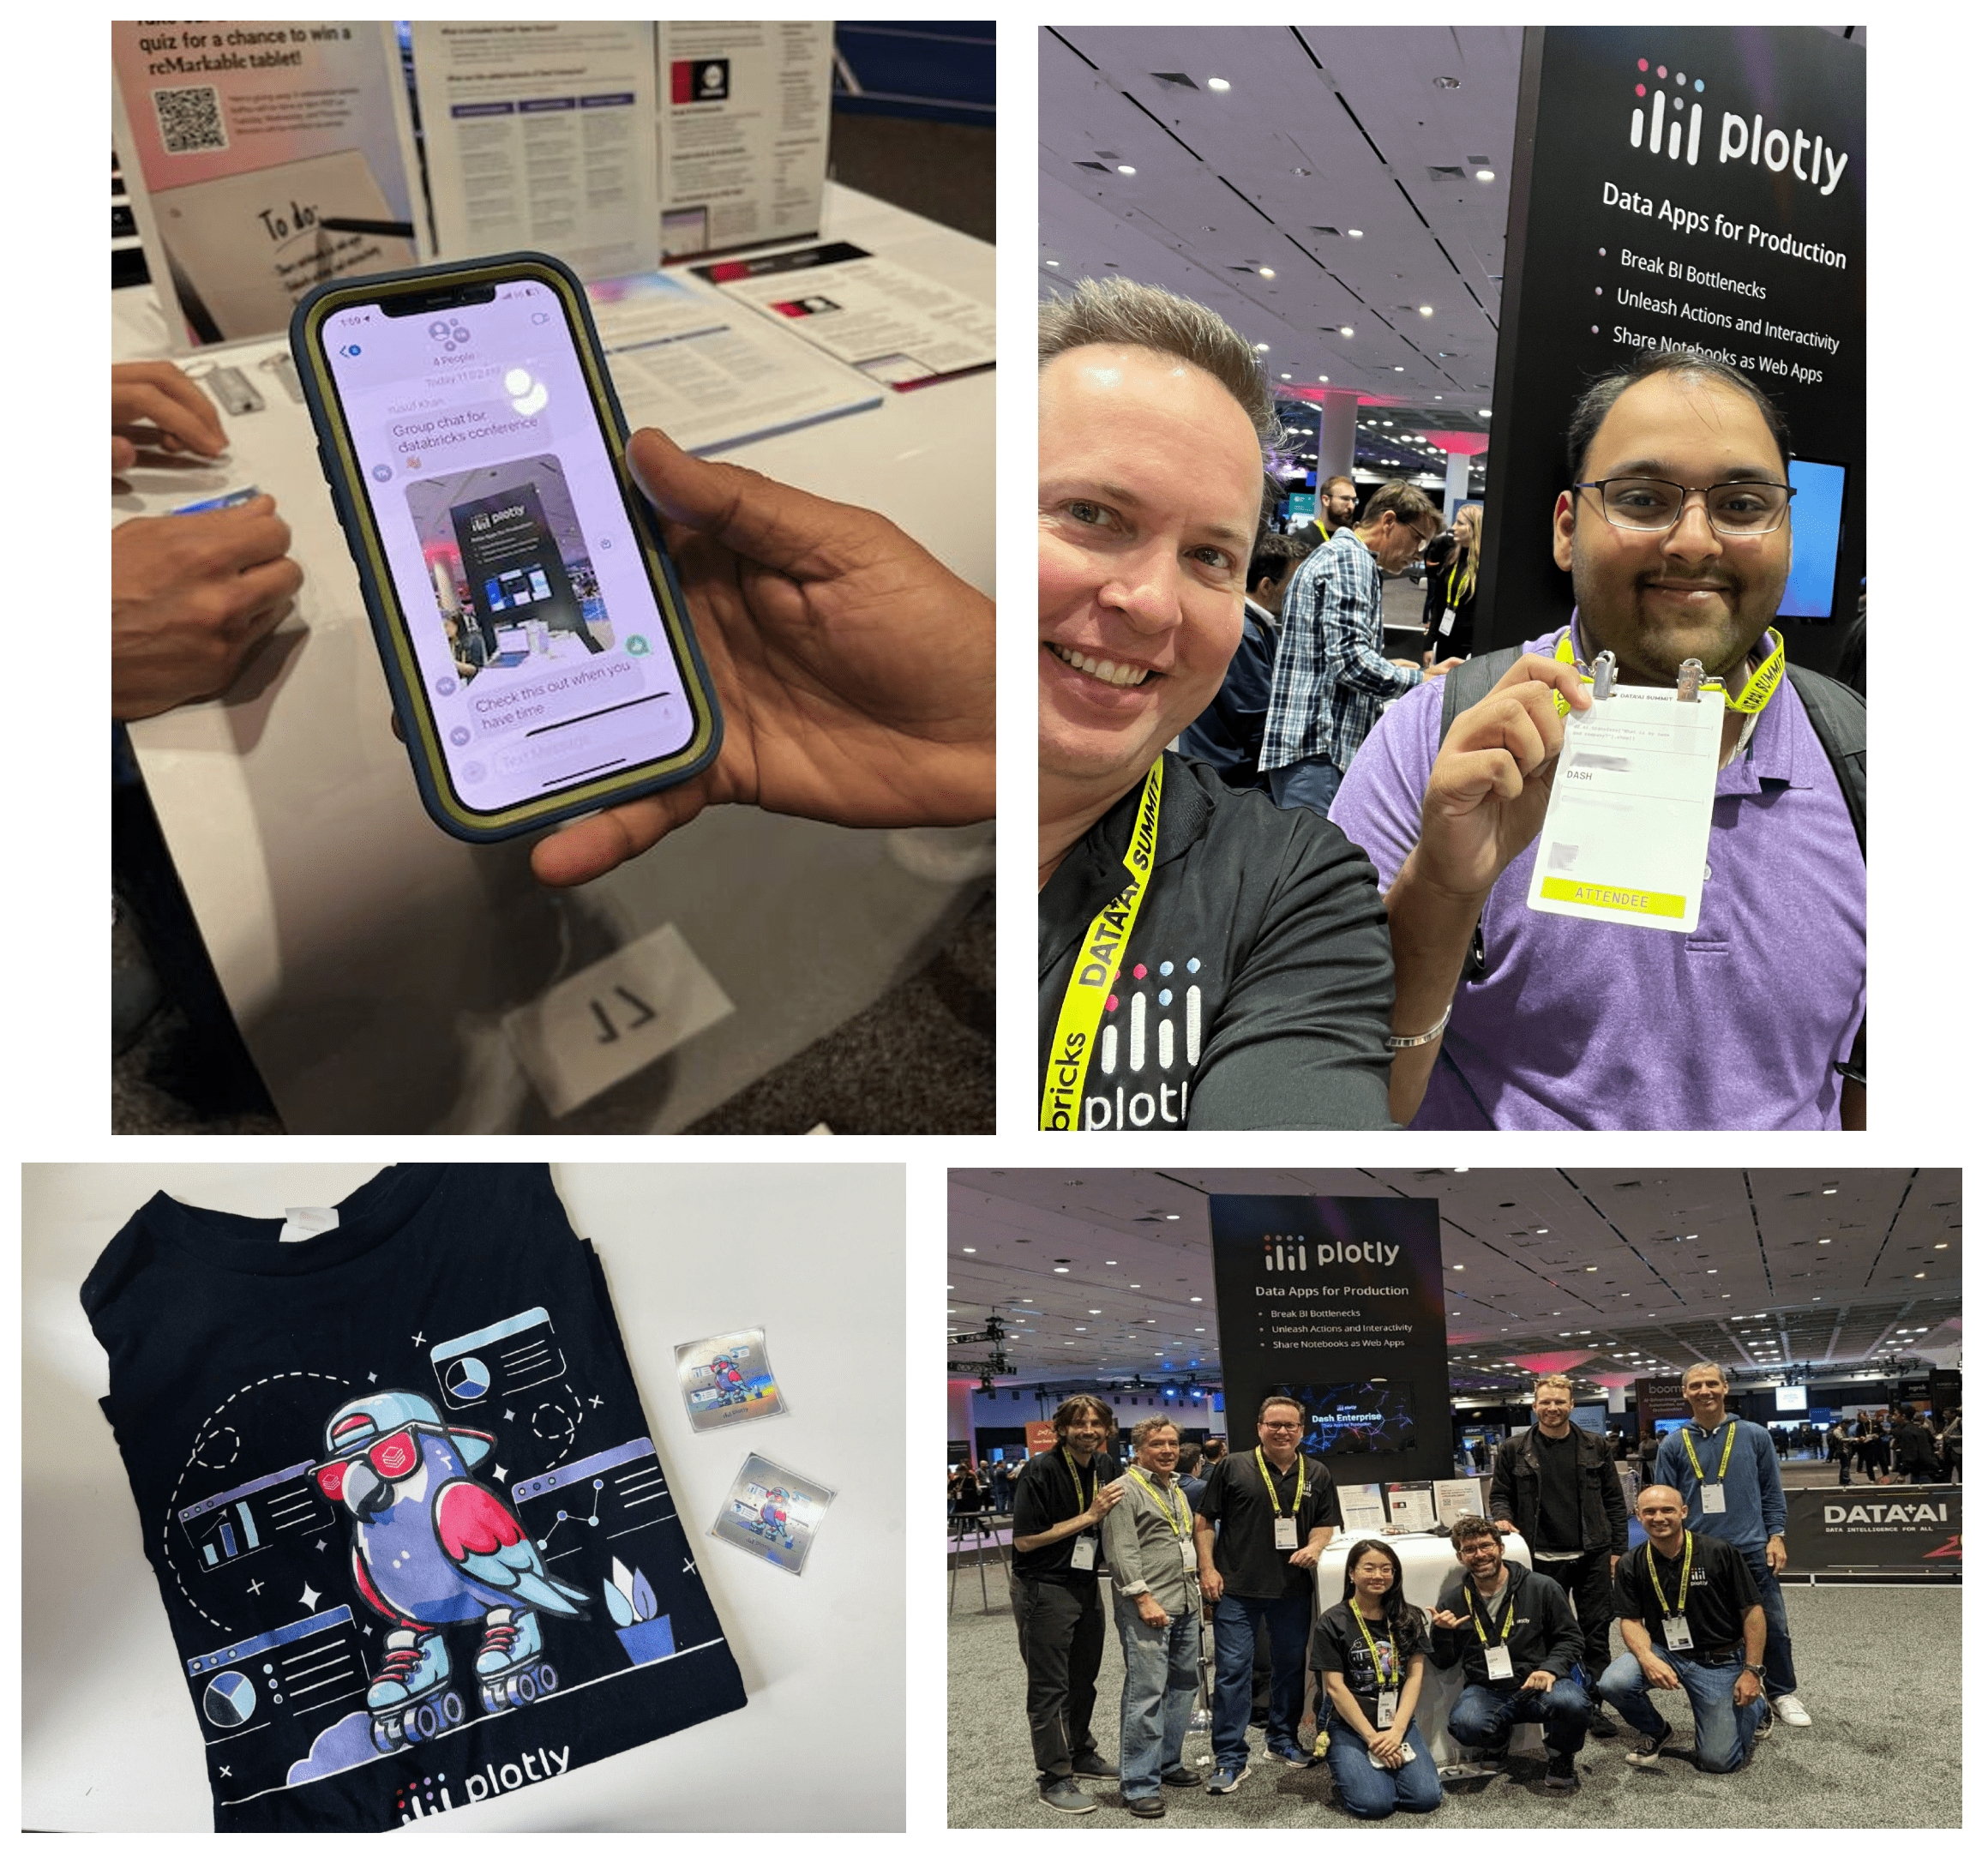
Some Plotly love and cool swag we handed out!
Back in the breakout sessions, Plotly visualizations were showcased in several other presentations. Here are two that caught our eye:
- Shell’s Journey Towards Effective Data Governance – John O’Brien, a Product Manager from Shell, described their data strategy and approach to data governance for delivering data products to their energy trading organization. He shared their rapid success in starting small and growing to 120 users, distributing 20 data products in only 12 months through a combination of Plotly Dash Enterprise, Microsoft GitHub for CI/CD, Databricks SQL, and Unity Catalog. What a great example of using these technology complements to create a new enterprise pattern for data product delivery. The conceptual framework for thinking about data strategy is particularly helpful for those embarking on new initiatives for delivering data products via data applications in the enterprise.
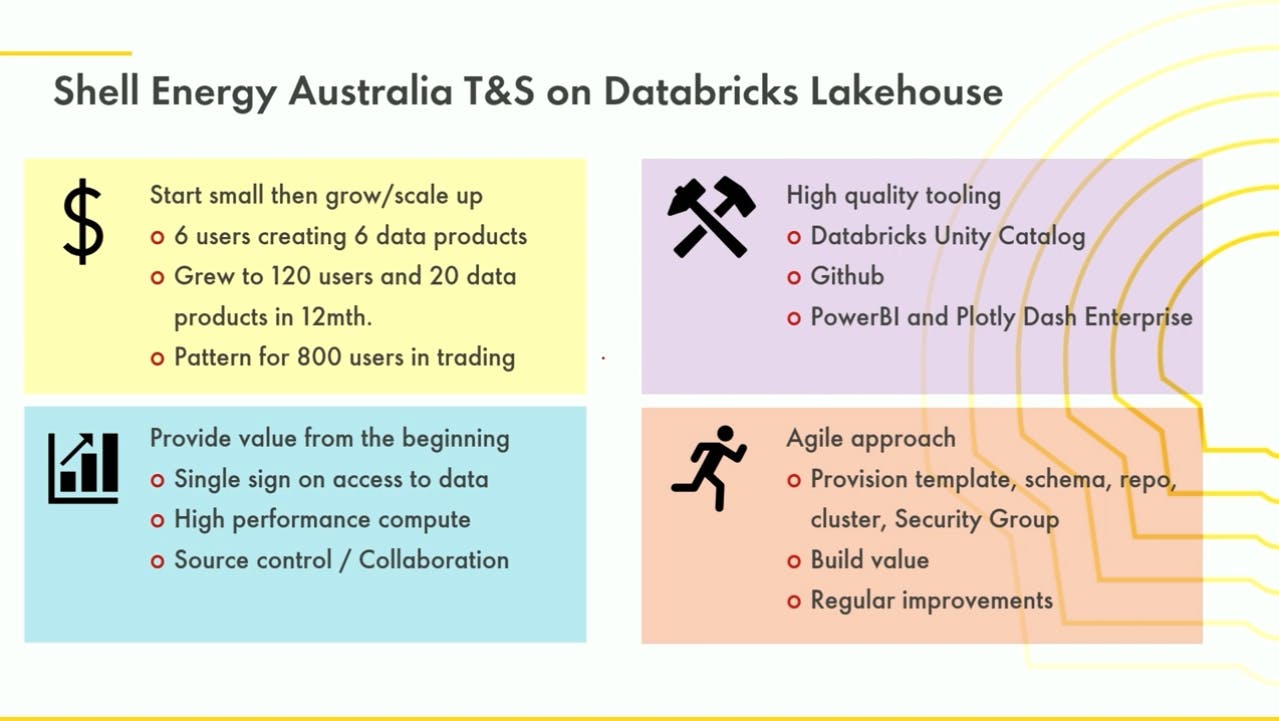
Shell’s Journey Towards Effective Data Governance
- Creating Optimized Thematic Portfolios with Bloomberg Enterprise Data – Katherine Laue and Michael Beal from Bloomberg showed how to use Bloomberg market data and analytics to create thematic investing tools using Plotly visualizations powered by data from the Databricks platform. Bloomberg has curated a set of more than 275 enterprise datasets designed to feed enterprise data applications. These enterprise datasets cover almost any company research need spanning reference data, pricing, risk, ESG, supply chain, revenue segmentation, facility geo-mapping, mutual fund & ETF holdings, tick history, and event feeds. They demonstrated a revenue segmentation scenario using Plotly visualizations embedded in Databricks notebooks to aid portfolio managers in calculating statistics and predictions on client portfolios.
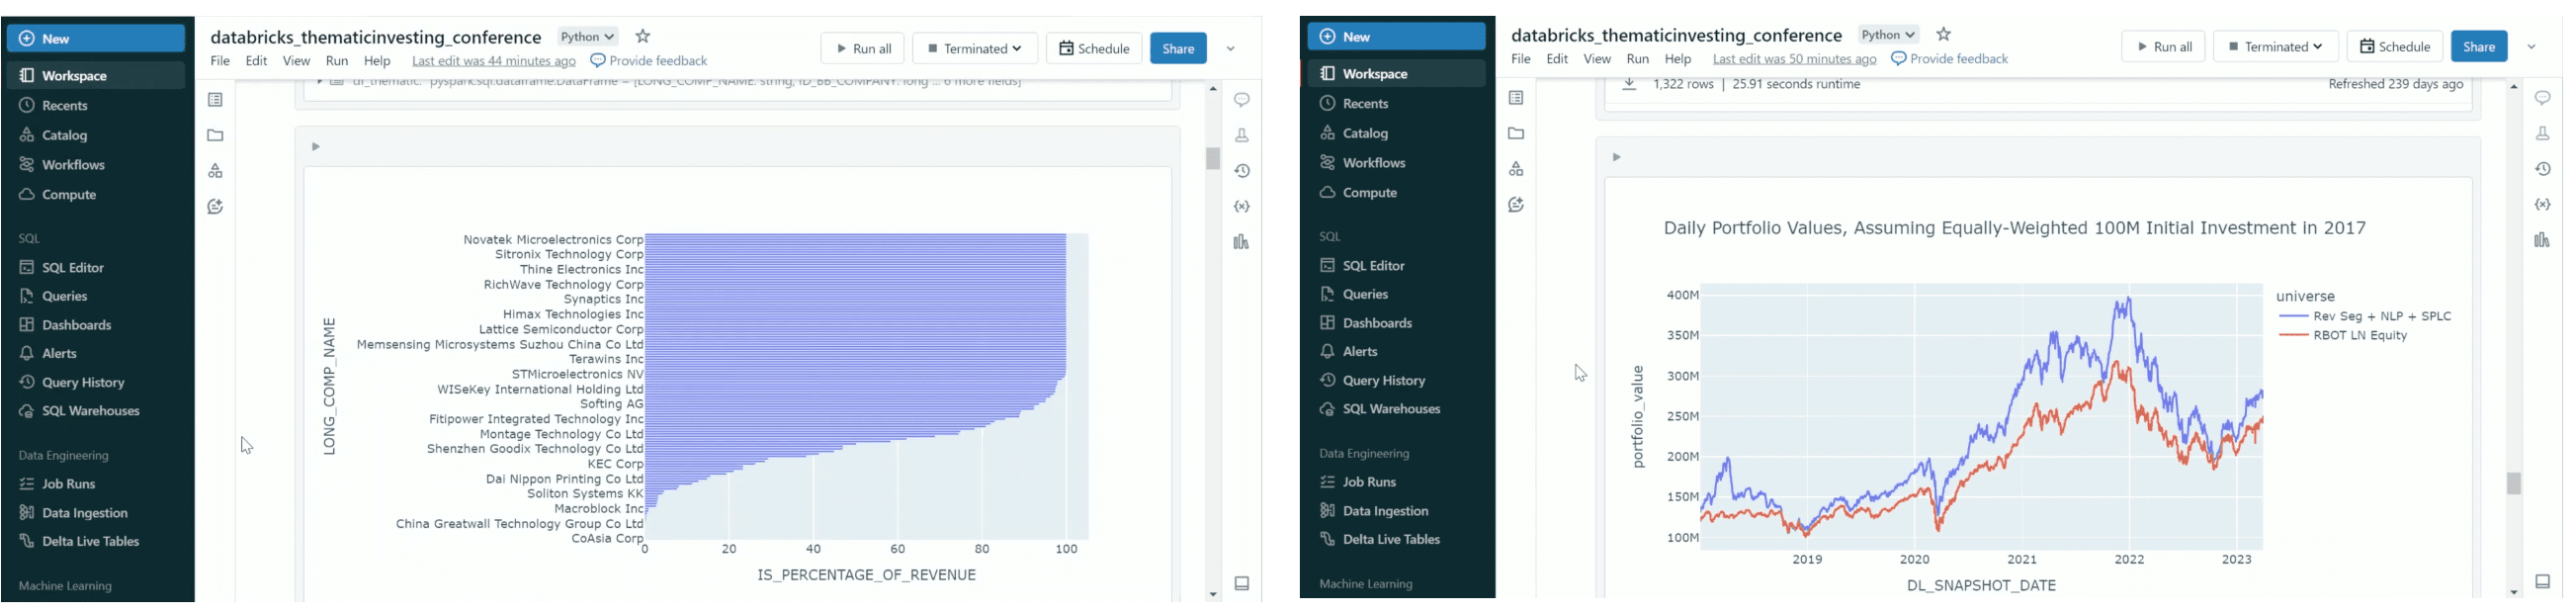
Creating Optimized Thematic Portfolios with Bloomberg Enterprise Data
Imagine
The Databricks announcements have been covered well by many others, so we won’t repeat all of them here. Instead we’ll share some thoughts on what the announcements regarding BI & analytics mean for the state of the market and Plotly’s direction.
At any large tech industry event, you’re asked to imagine a future where hard computer science challenges are solved and compatibility concerns are no more. If we all could just agree and adopt a single standard for this or that, the world would be a better place. Following Databricks’ acquisition of Tabular, that's the future Databricks imagines for open table formats with Delta and Iceberg coming together in a single, unified, and industry standard table format. Databricks announced UniForm as a table type adapter, like Apache xTable, to be used in the meantime until that vision manifests. UniForm helps ease the conversion and reading of other table types.
Of particular interest to the Plotly community was the announcement of AI/BI Dashboards and Custom Apps. AI/BI Dashboards replace the Lakehouse Apps product which they introduced last year and provide a purely SaaS experience for creating read-only business intelligence dashboards. These Databricks dashboards can be enhanced by a chat engine called Genie. This offers a convenient way to create basic, read-only dashboard views for internal users similar to Microsoft PowerBI or Tableau but as a new offering it will take some time to come close to the power of those BI tools.
Plotly continues to complement BI tools like Databricks AI/BI Dashboards, Microsoft PowerBI, and Tableau. We do that through Plotly’s read-write data application platform with 100s of visualizations types, sophisticated interactivity, parameterized controls, and high degree of customizability delivered through a composable framework built on Python. Customers value Plotly Dash Enterprise for data applications delivered to both internal and customer-facing users with pixel perfect reporting, branding, and the simplicity of enterprise security integration and application lifecycle management. Custom Apps represent another way to host application code similar to Snowflake Native Apps, but in your Databricks environment. This is in private preview today, so it remains to be seen what exactly will be supported. Plotly’s approach is agnostic to any particular data platform, cloud, or on-premises data center environment and runs anywhere. Today, many customers run Plotly data applications in their VPCs, in air-gapped on-premises environments, or in third-party hosting services.
The Load Out
To close out the show before the final load out, we gathered the Plotly community for our first in-person San Francisco event led by co-founder, Chris Parmer, and our community lead, Adam Schroeder. The event kicked off with hors d'oeuvres, drinks, and networking. Adam gave a heartfelt opening address followed by Chris previewing some really exciting new product innovations. (More to be announced later.) Adam then covered new initiatives in the community and invited the group to participate in the Plotly AI app building challenge.
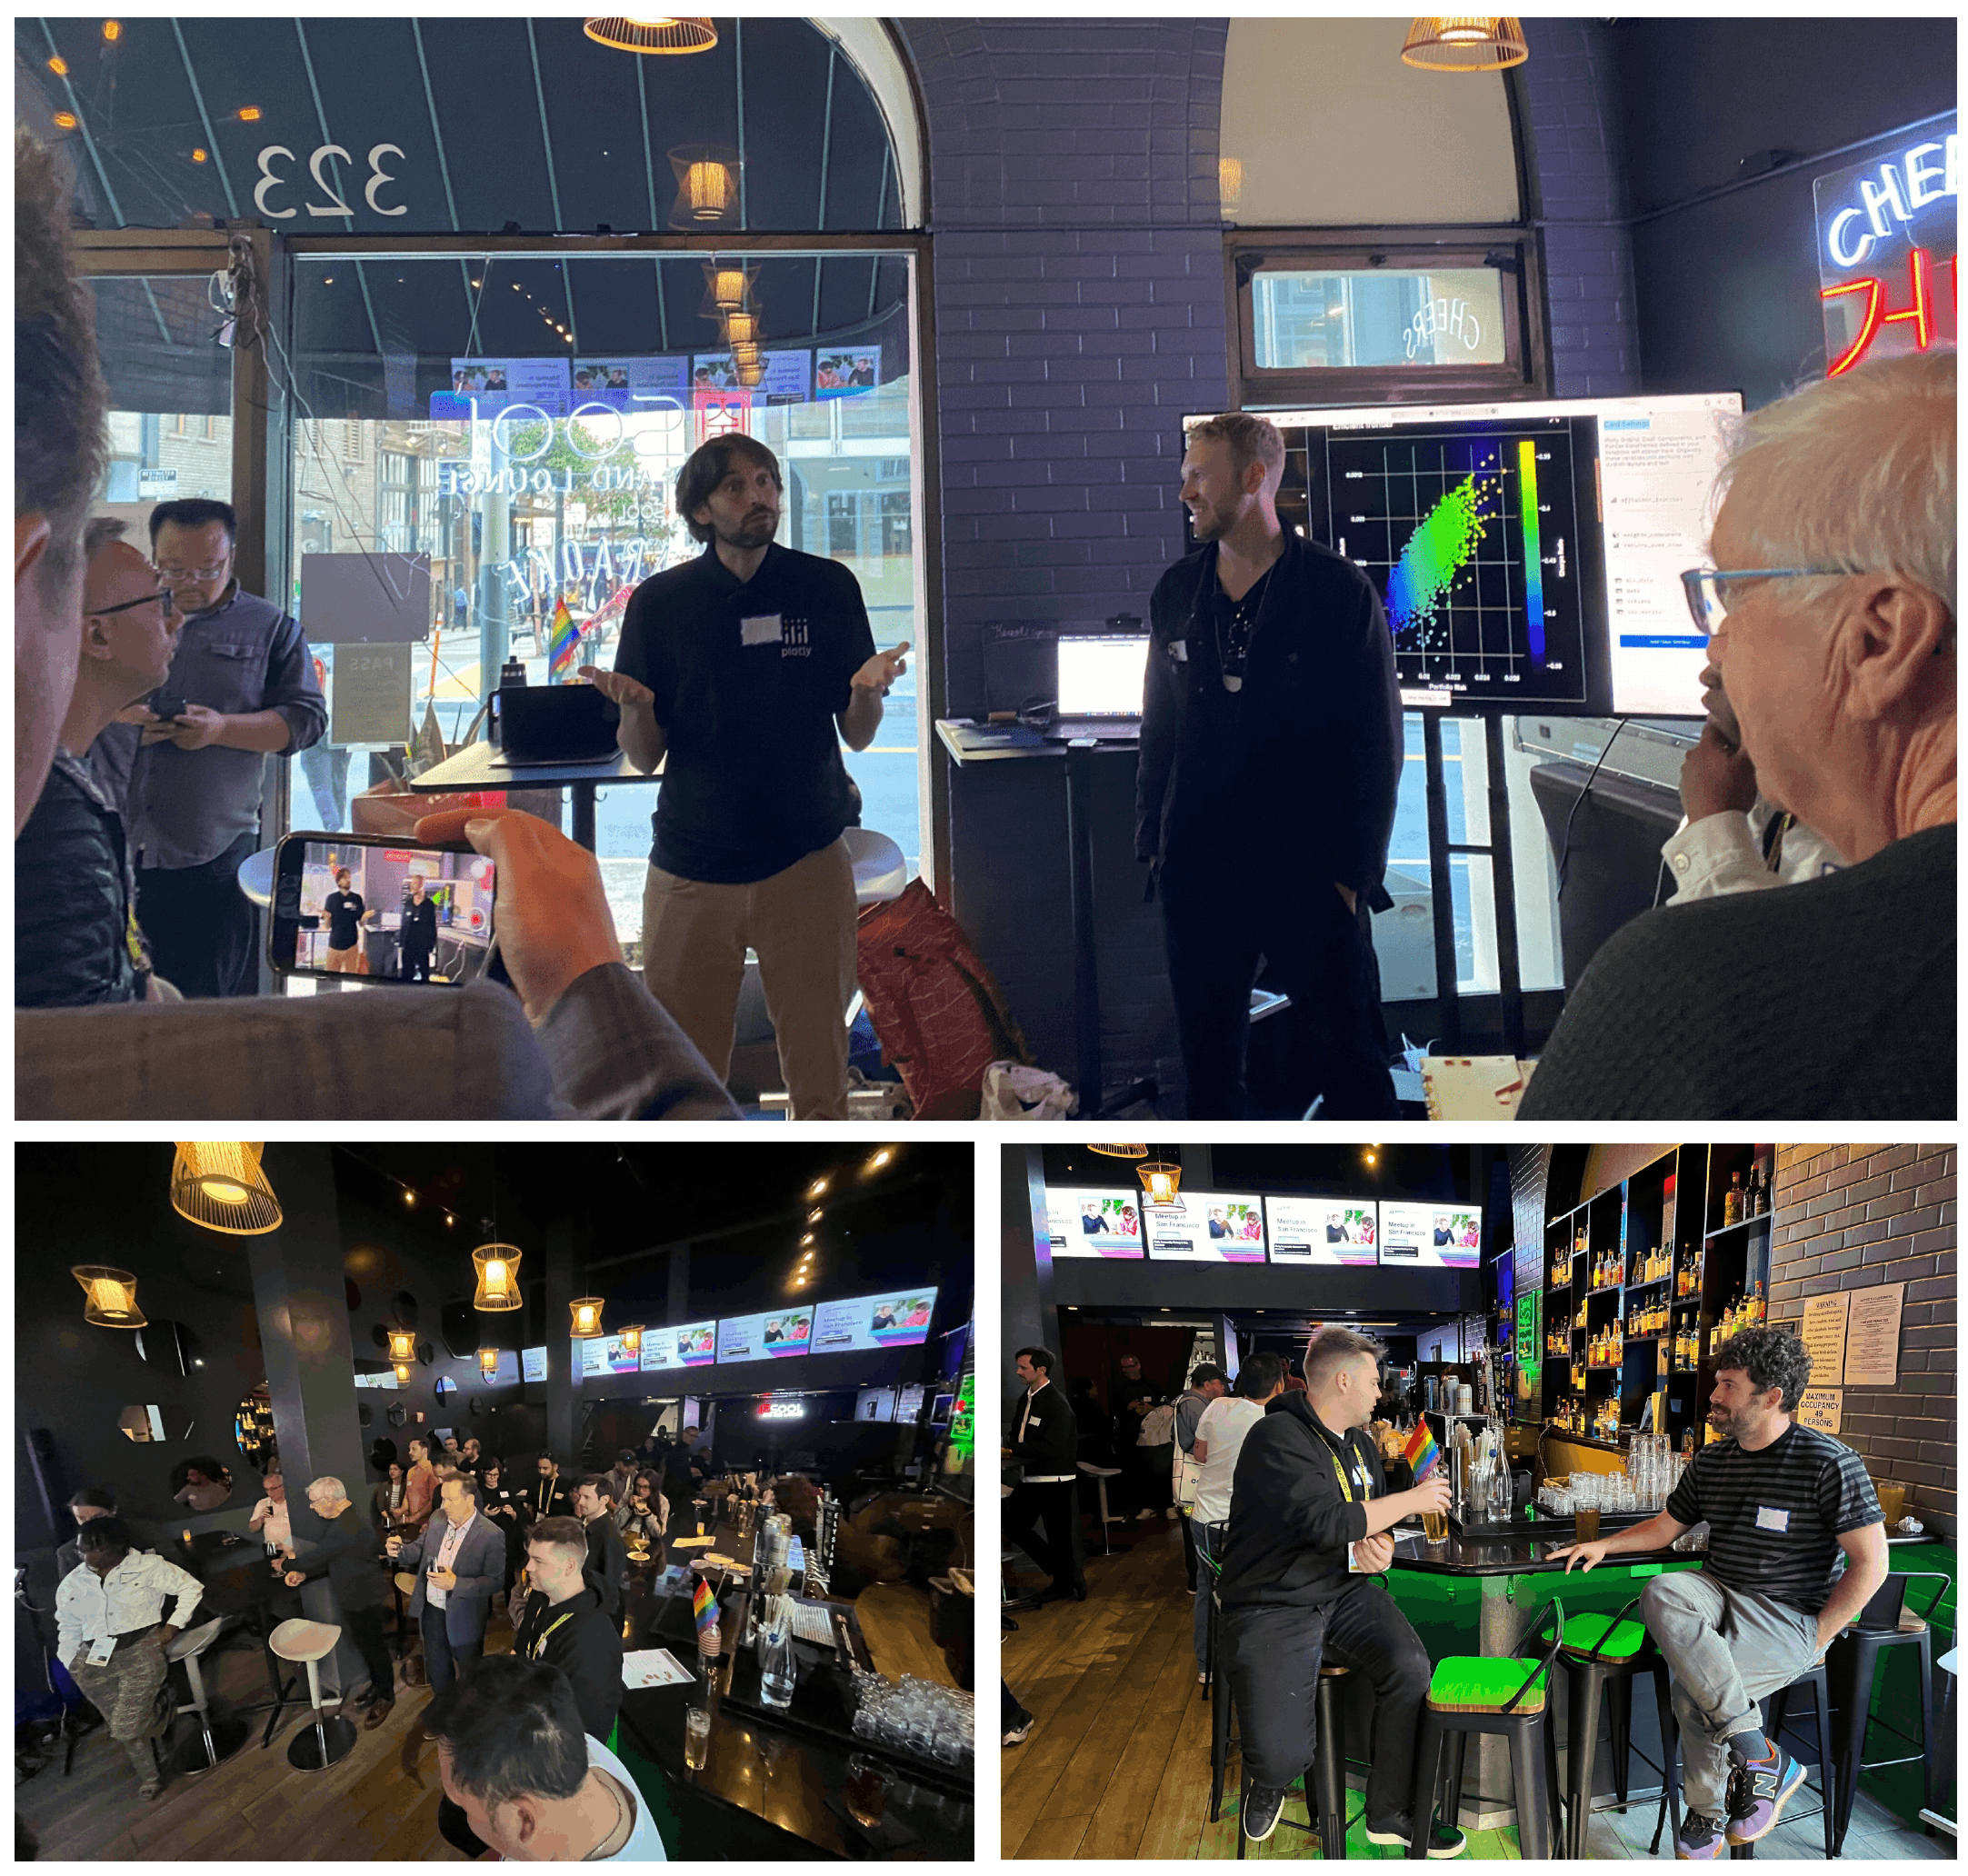
Photos of our community meetup in San Francisco.
We’ve Only Just Begun
If you’ve read this far, I thank you. With so many events in a week, we still haven’t covered everything regarding Plotly at Data + AI Summit, but we’ve played the hits. We’d like to invite you to join us July 24 for a Plotly event celebrating our customers, community, and product where we will share what’s new in the upcoming Plotly Dash Enterprise release. We want to hear from you about your event experience. Put your records on, tell me your favorite songs.