
Chris Parmer
November 20, 2026
Wind farm asset monitoring and turbine performance app
A data app example built with Dash and an AI coding agent in 20 minutes
TL;DR
- Building data apps with AI coding agents in Python and managing them on Dash Enterprise or Plotly Cloud is the modern alternative to BI. At Plotly, many of our customers are migrating away from point-and-click tools like Spotfire, Tableau, and Power BI toward code-backed tools powered by AI. This example showcases the types of apps that you can create.
- This app monitors a working wind farm from its public supervisory control and data acquisition (SCADA) records: energy, availability, power curves, stops, and component temperatures. A coding agent built it from one prompt in about 20 minutes.
- You can go from the farm to a single turbine by clicking, and every page has its own link you can send to a colleague.
- Each turbine's component temperatures are compared with a normal-behavior model learned from its sister turbines, so a bearing that runs hot stands out before it fails.
- The full prompt is below, so you can build the same kind of app on your own data and run it on Dash Enterprise behind your firewall or have it hosted for you on Plotly Cloud.
Walkthrough
The app follows how an asset manager looks at a wind farm: the farm first, then the turbine that looks wrong. It runs on Kelmarsh, a six-turbine farm in England whose operator published its 10-minute SCADA data and status logs.
See how the whole farm performed
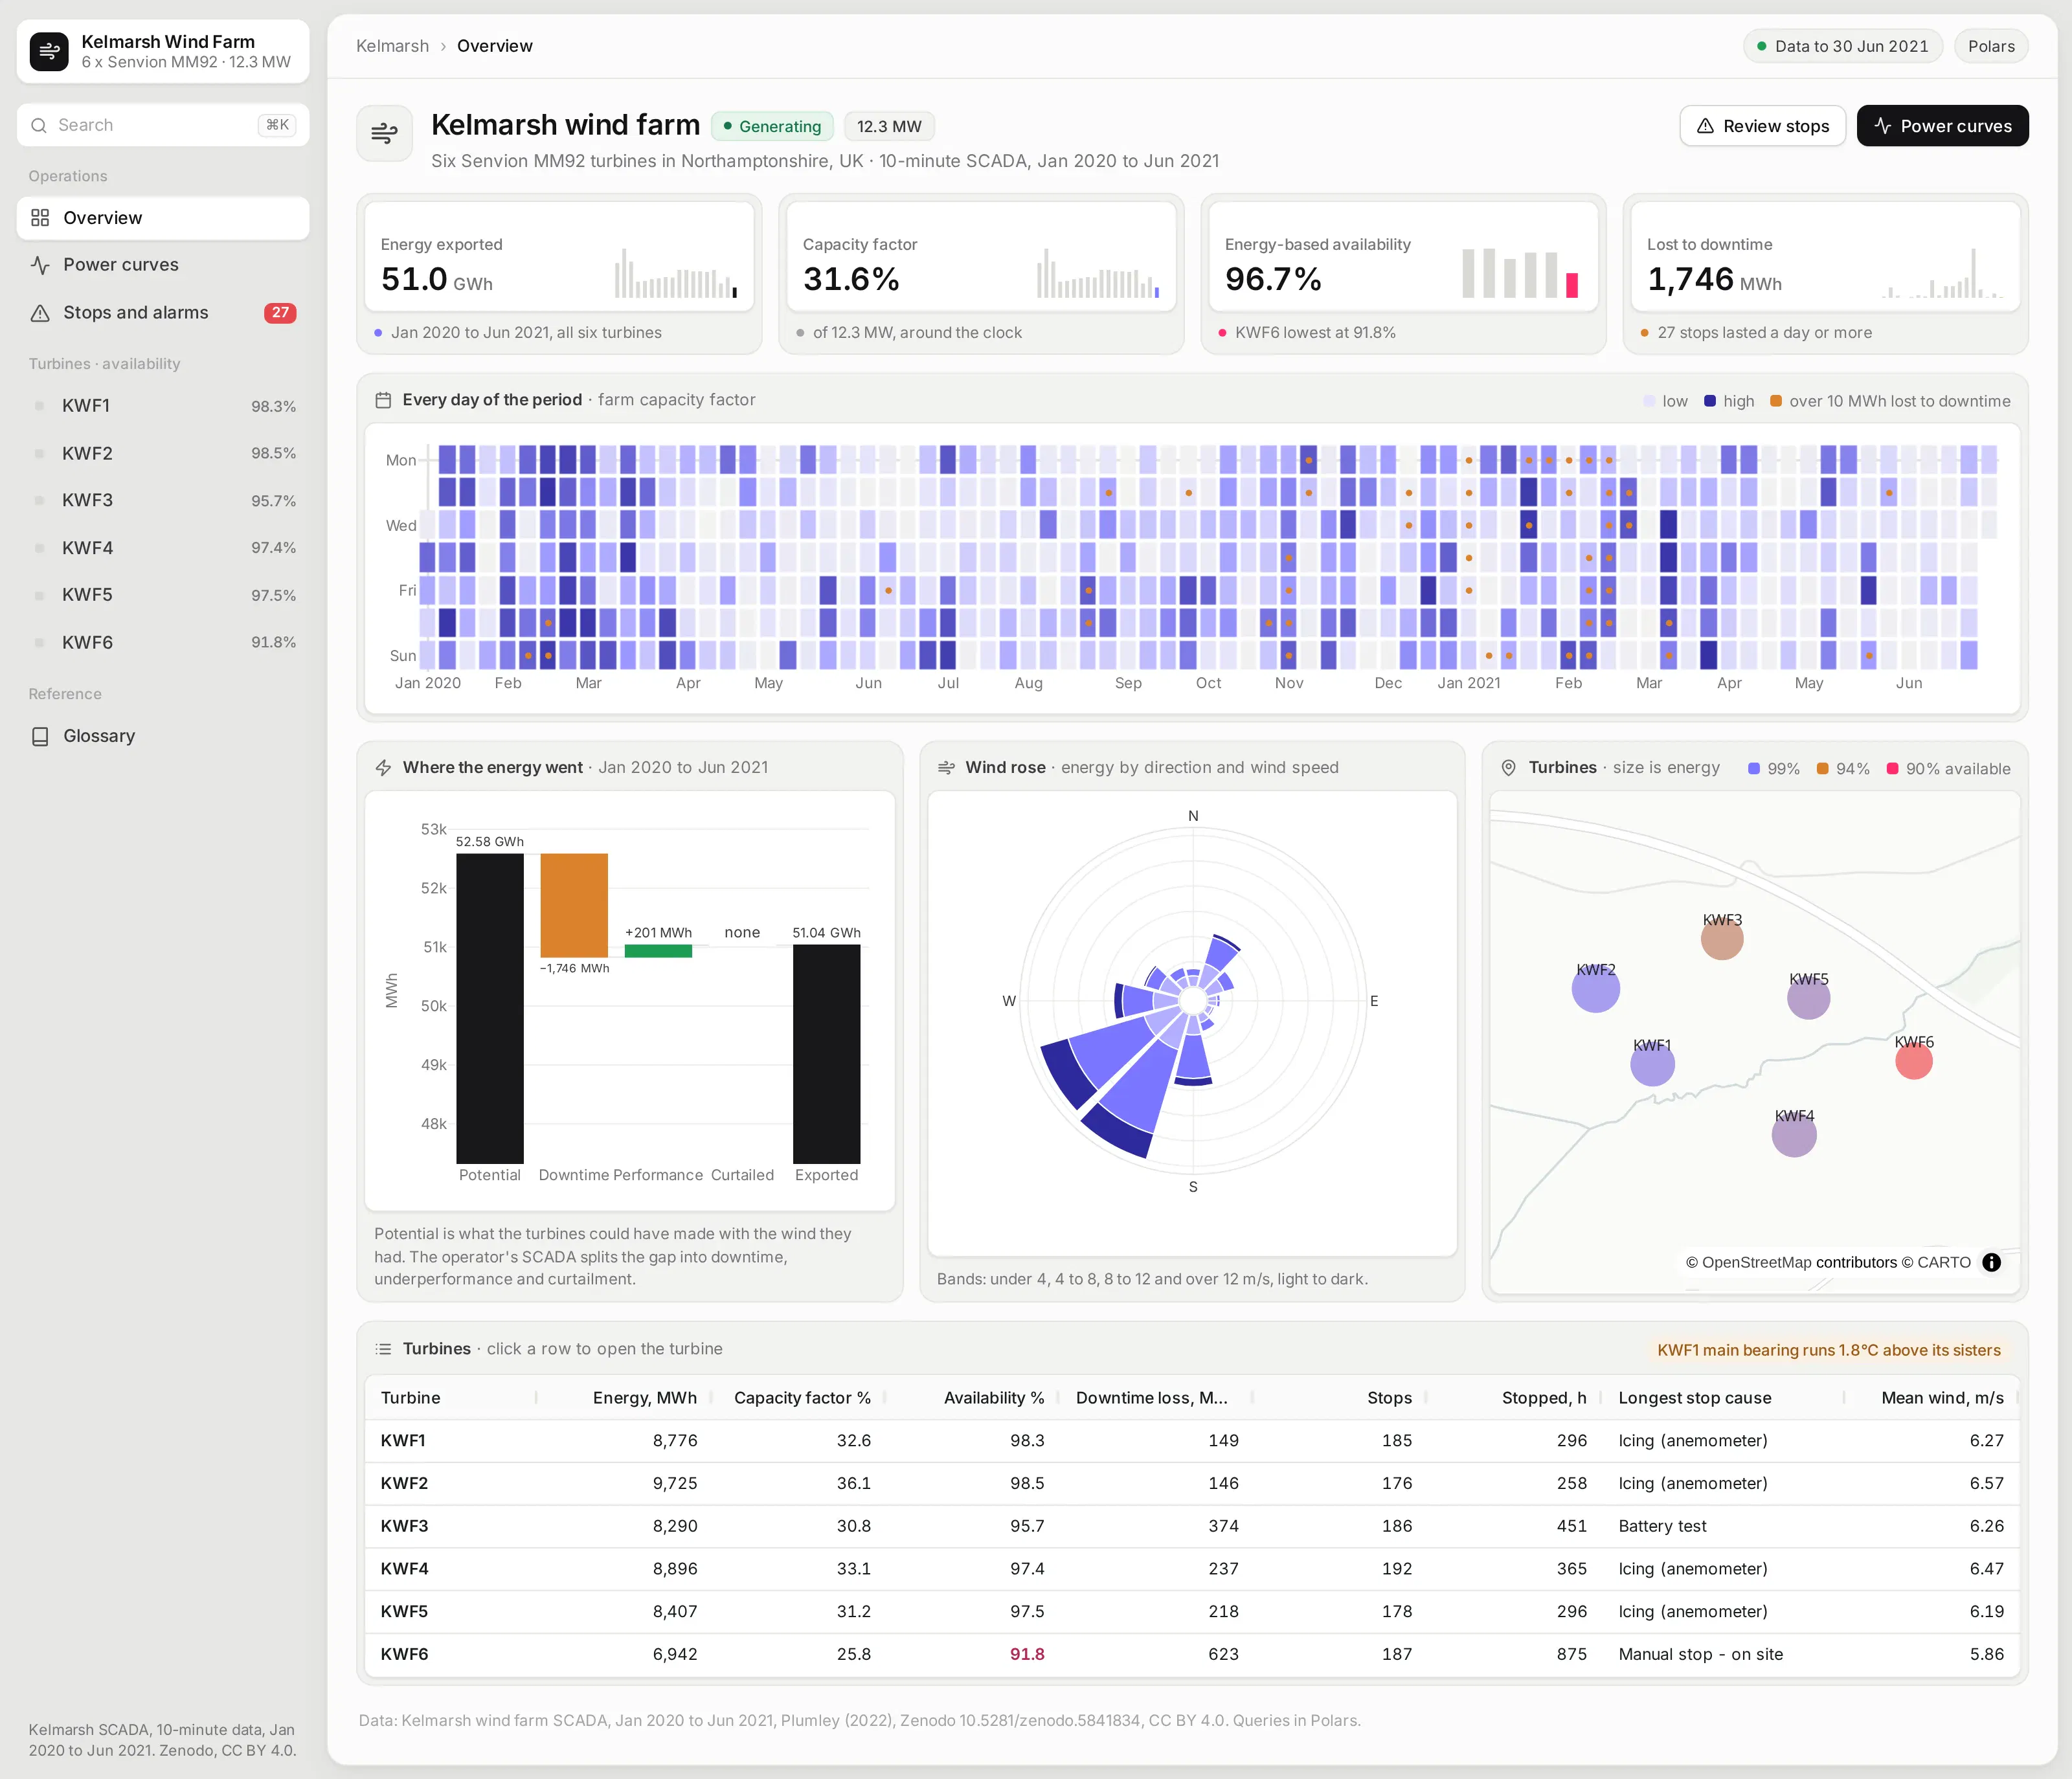
The overview answers the first questions an asset manager asks: how much the farm made, how available it was, and how much energy was lost to downtime. Each headline number has a small trend line under it.
A calendar shows every day colored by output, with a marker on the days that lost the most energy to stops. A waterfall walks from what the turbines could have made with the wind they had to what they exported.
The turbine table ranks the six machines on energy, availability, and stop hours. Clicking a row opens that turbine.
Check a turbine's power curve and component health
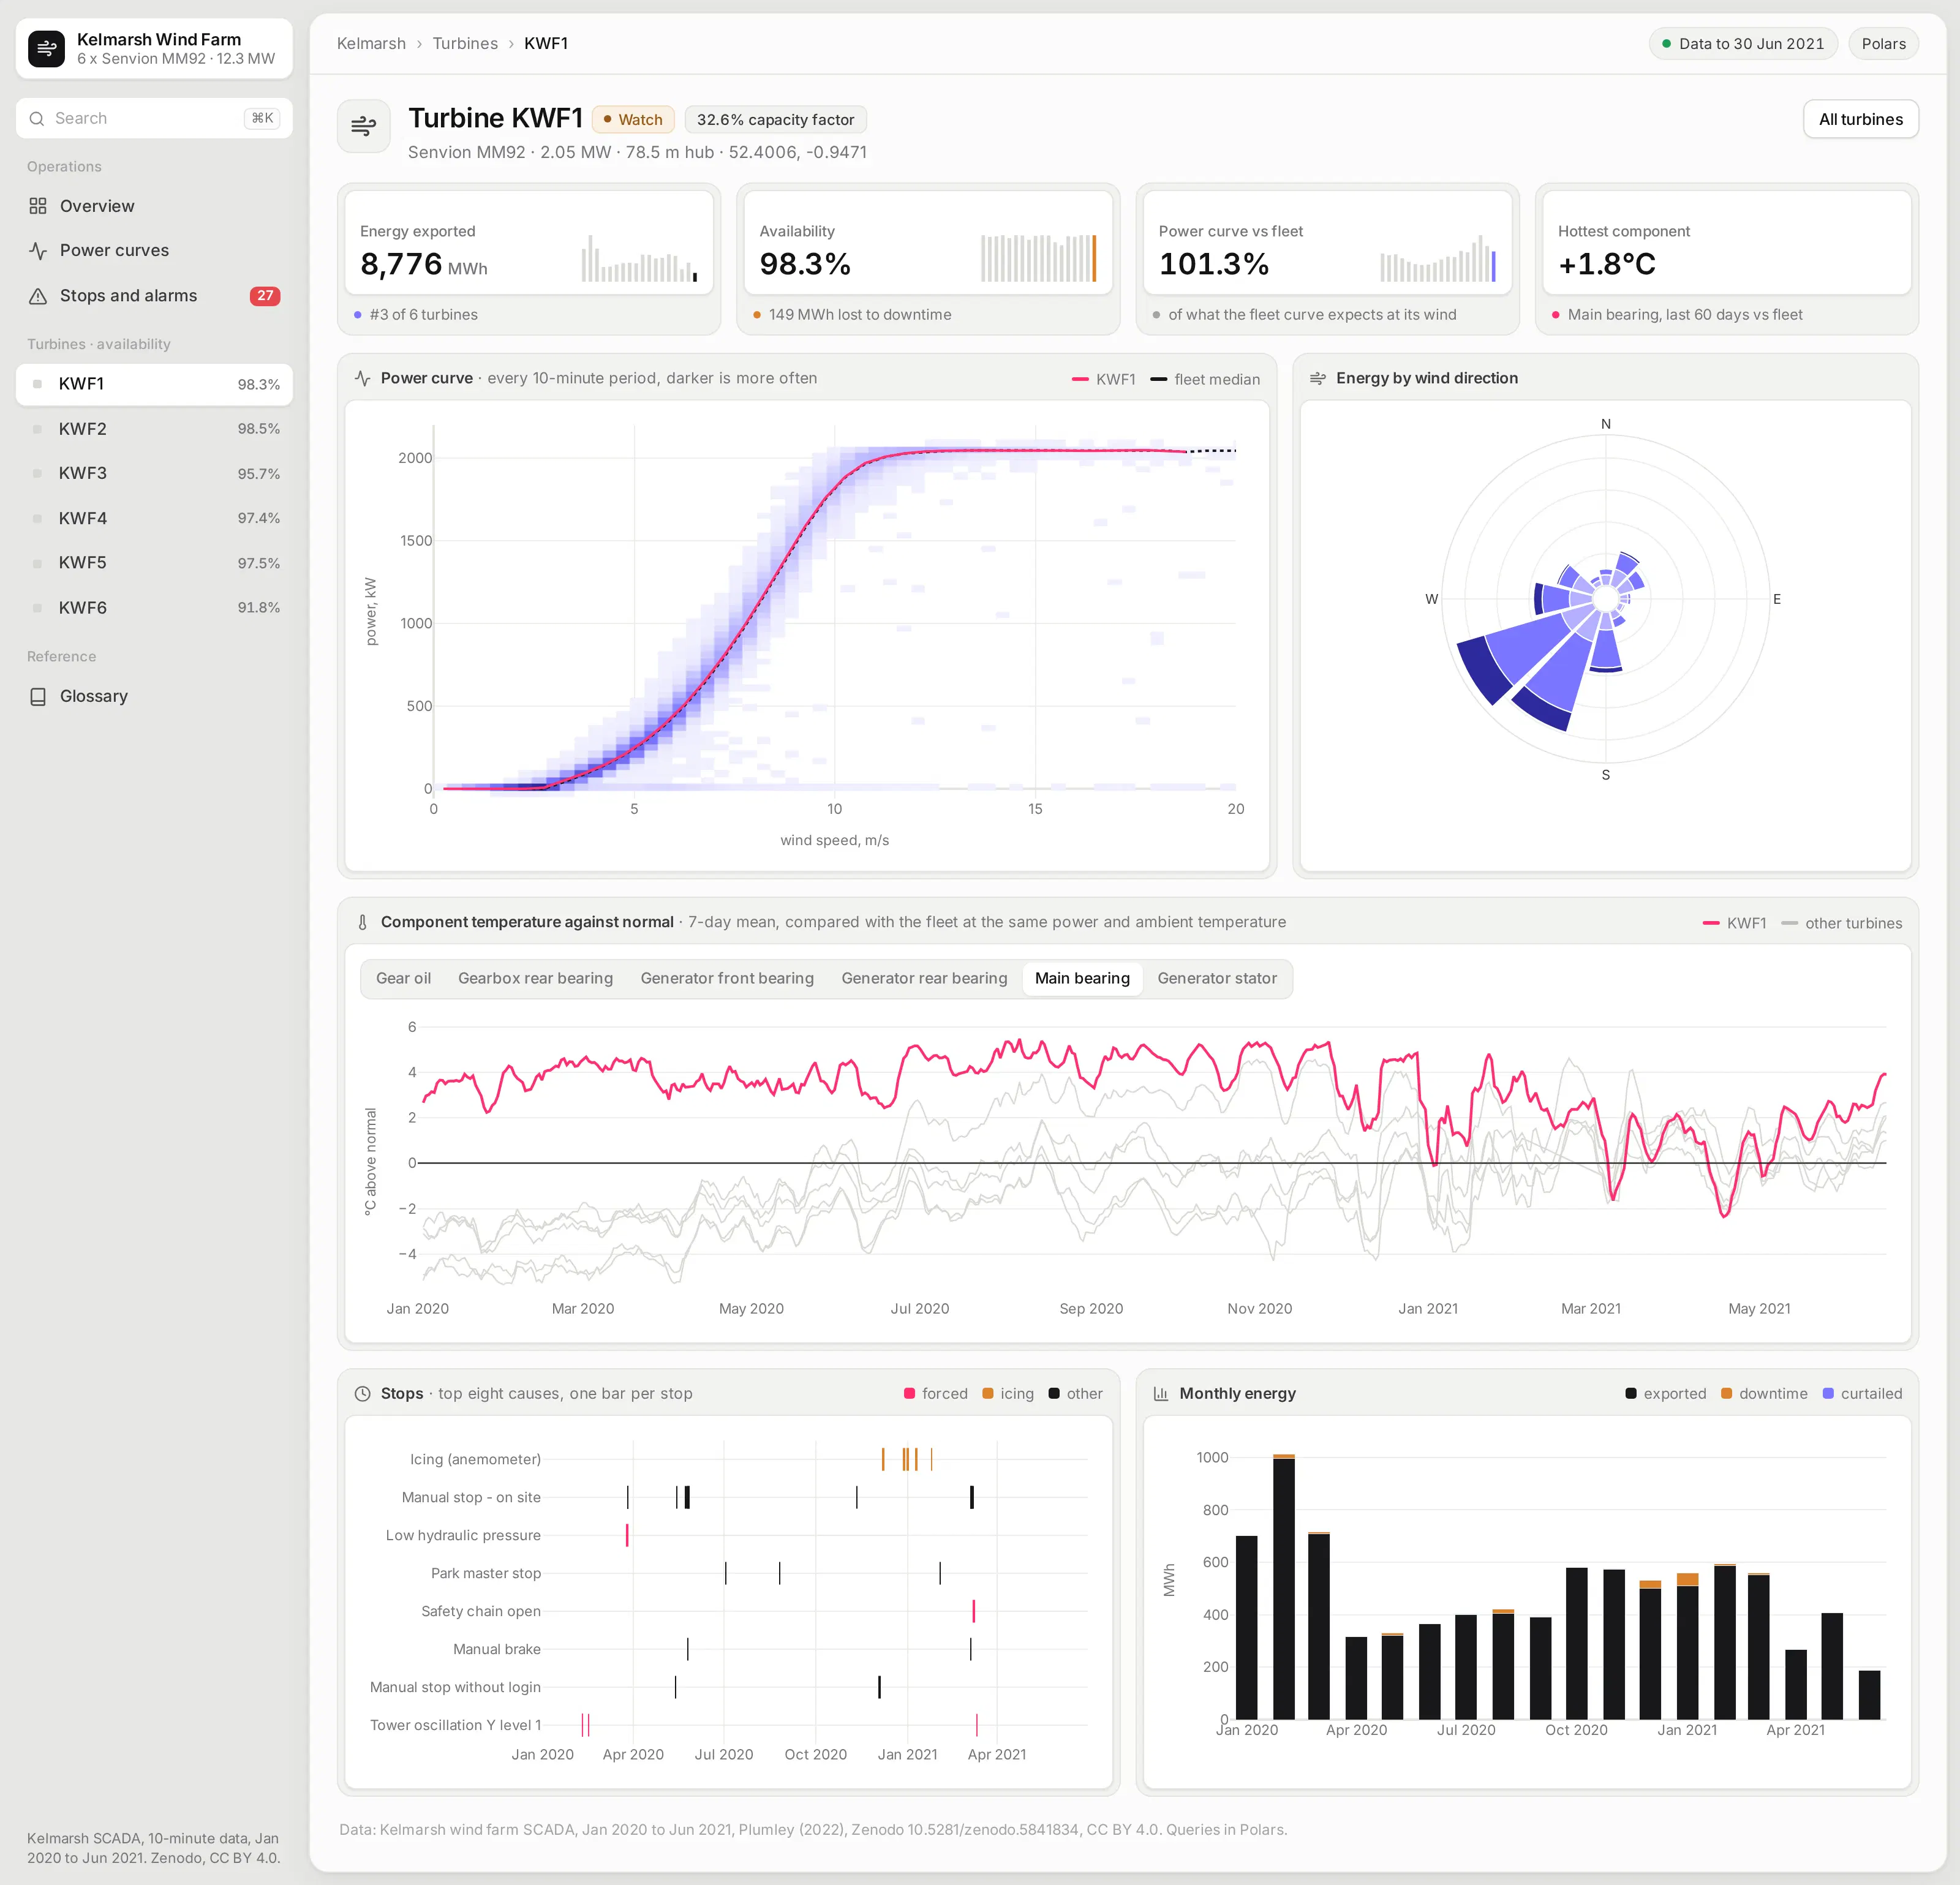
Each turbine page draws its power curve from every 10-minute period, with the turbine's own curve and the fleet's curve on top. A turbine that sits below its sisters at the same wind speed is losing energy.
The component chart compares each bearing, the gearbox, and the generator with what the fleet runs at under the same load and outside temperature. Switch components with one click, and a component that has been drifting warm shows up as a line pulling away from its sisters.
Under it, a timeline of every stop and a monthly energy chart show when the turbine was down and what that cost.
Compare every turbine with the fleet, month by month
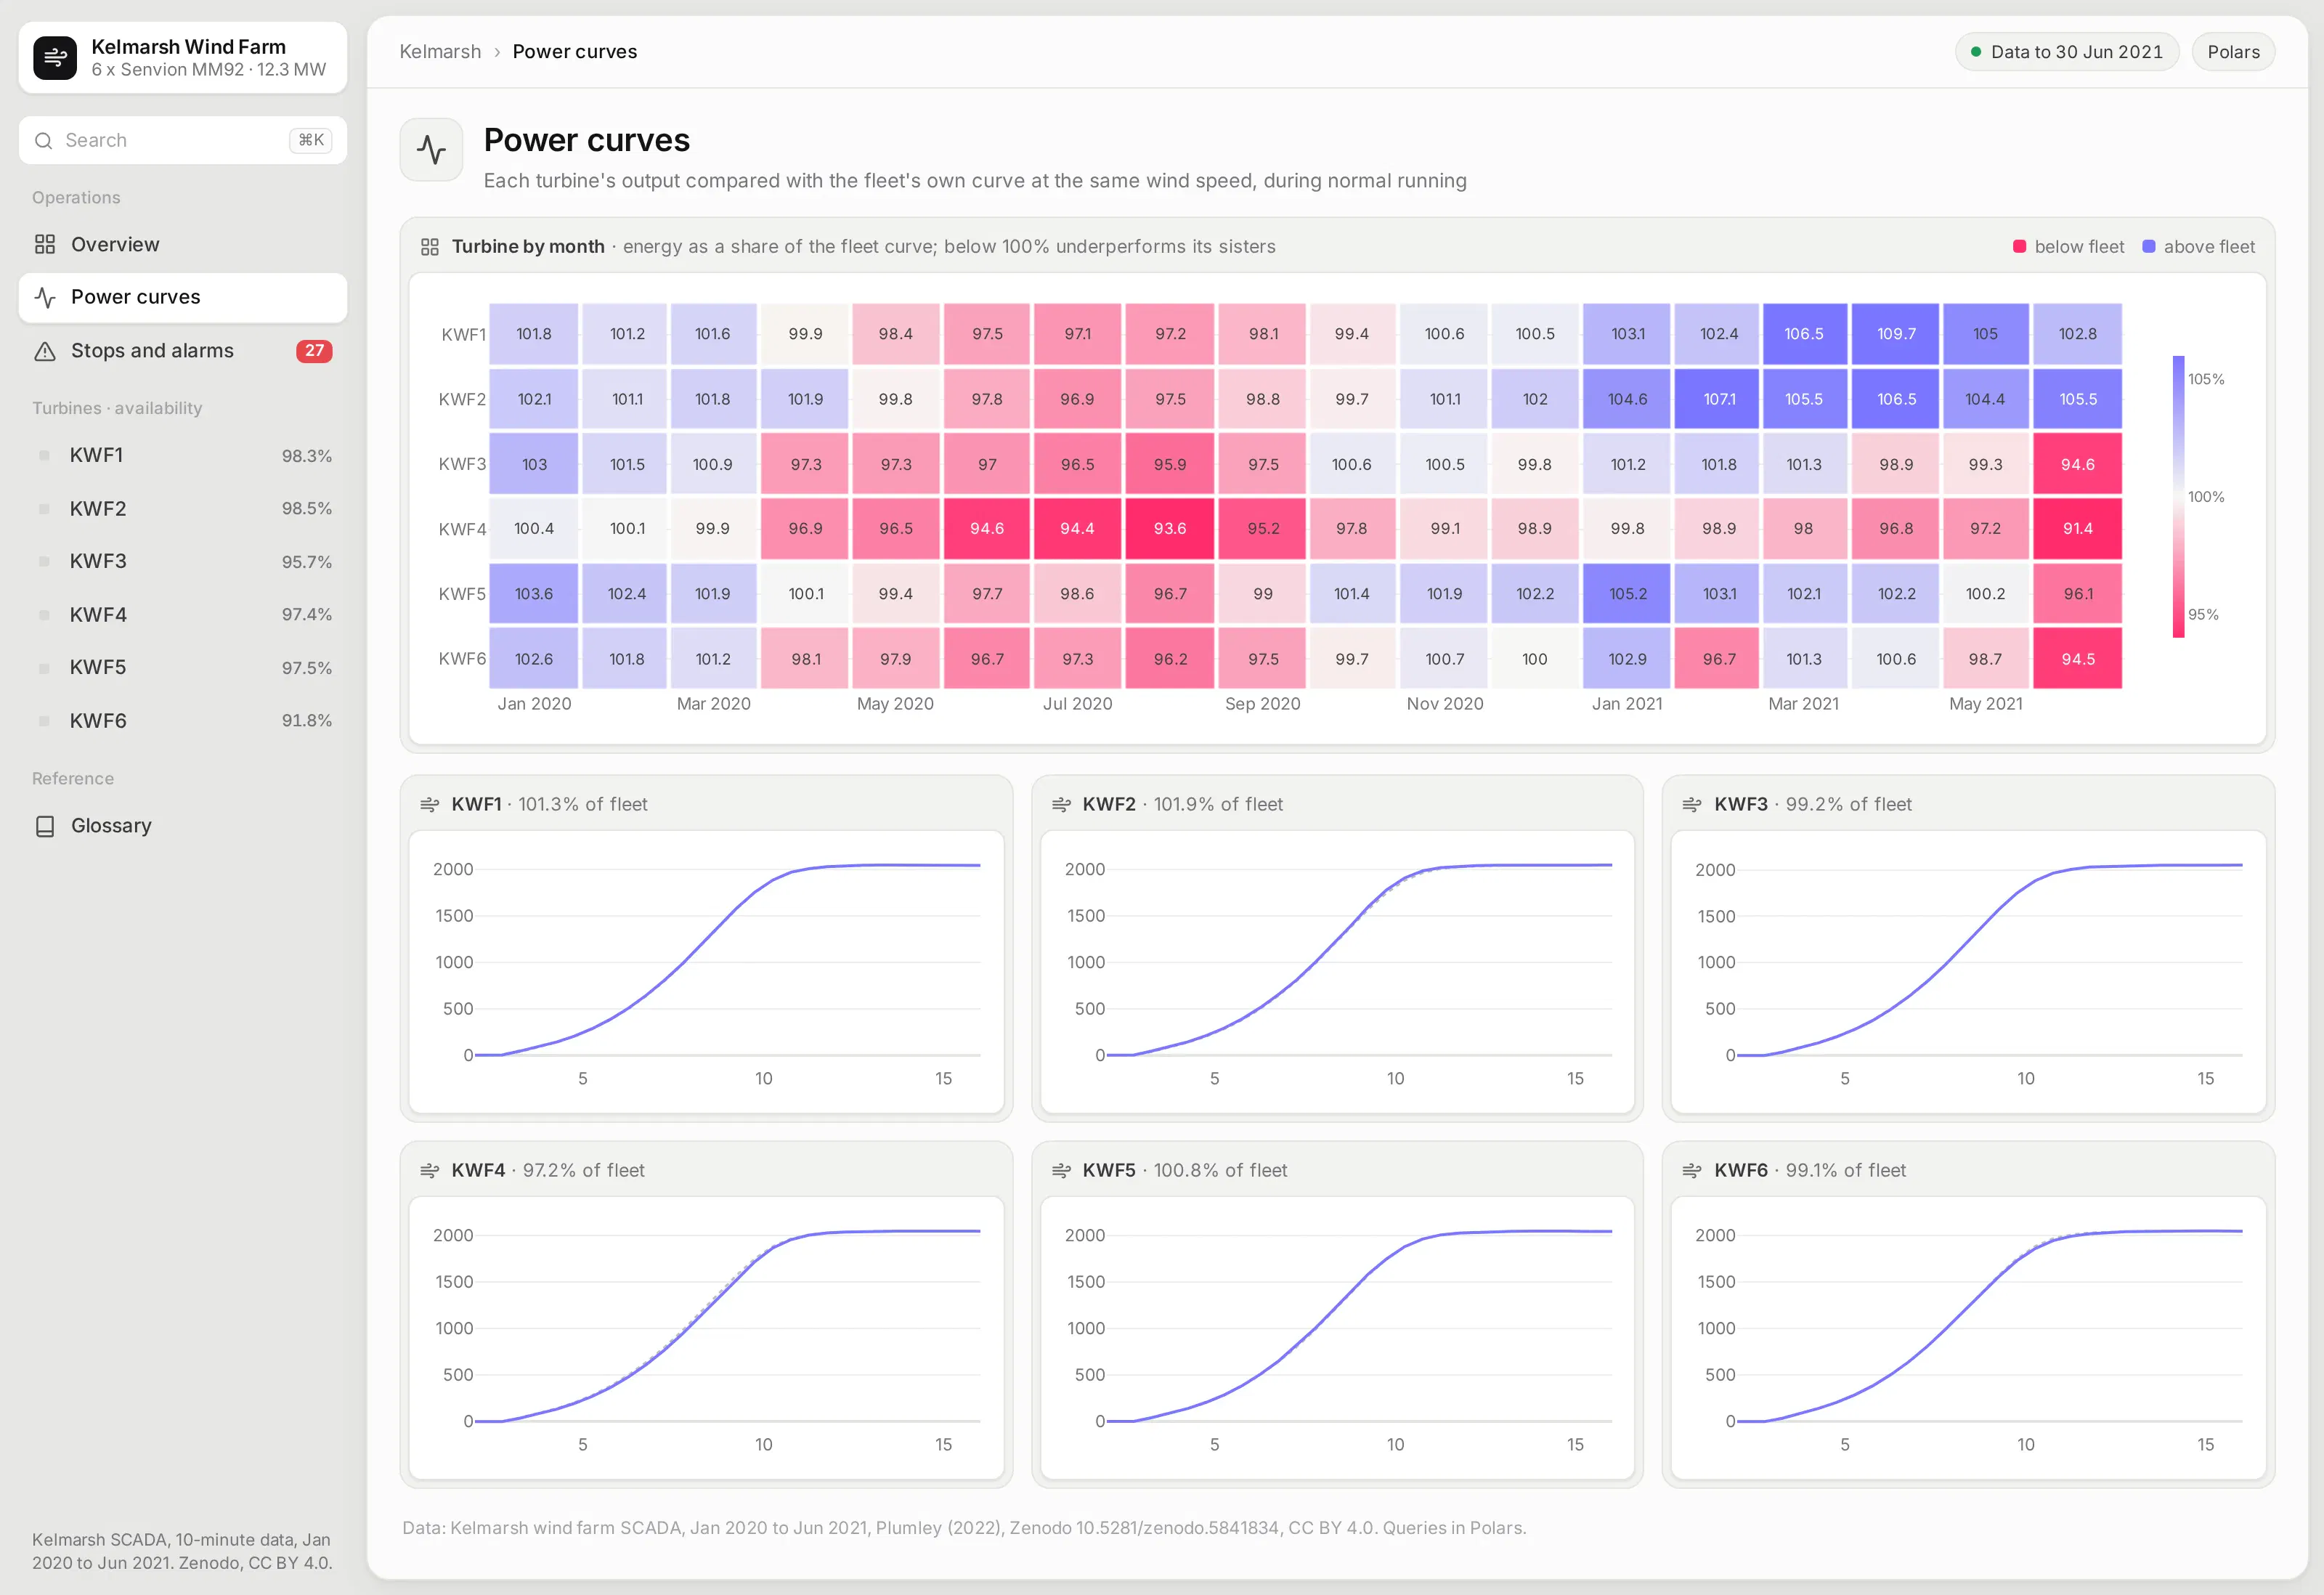
This page puts every turbine against the fleet's own power curve for every month. Cells below 100% mean the turbine made less energy than its sisters would have with the same wind.
Small multiples of each turbine's curve sit underneath, so you can see whether a gap comes from the ramp-up or from the turbine not reaching rated power.
Find what stops the turbines
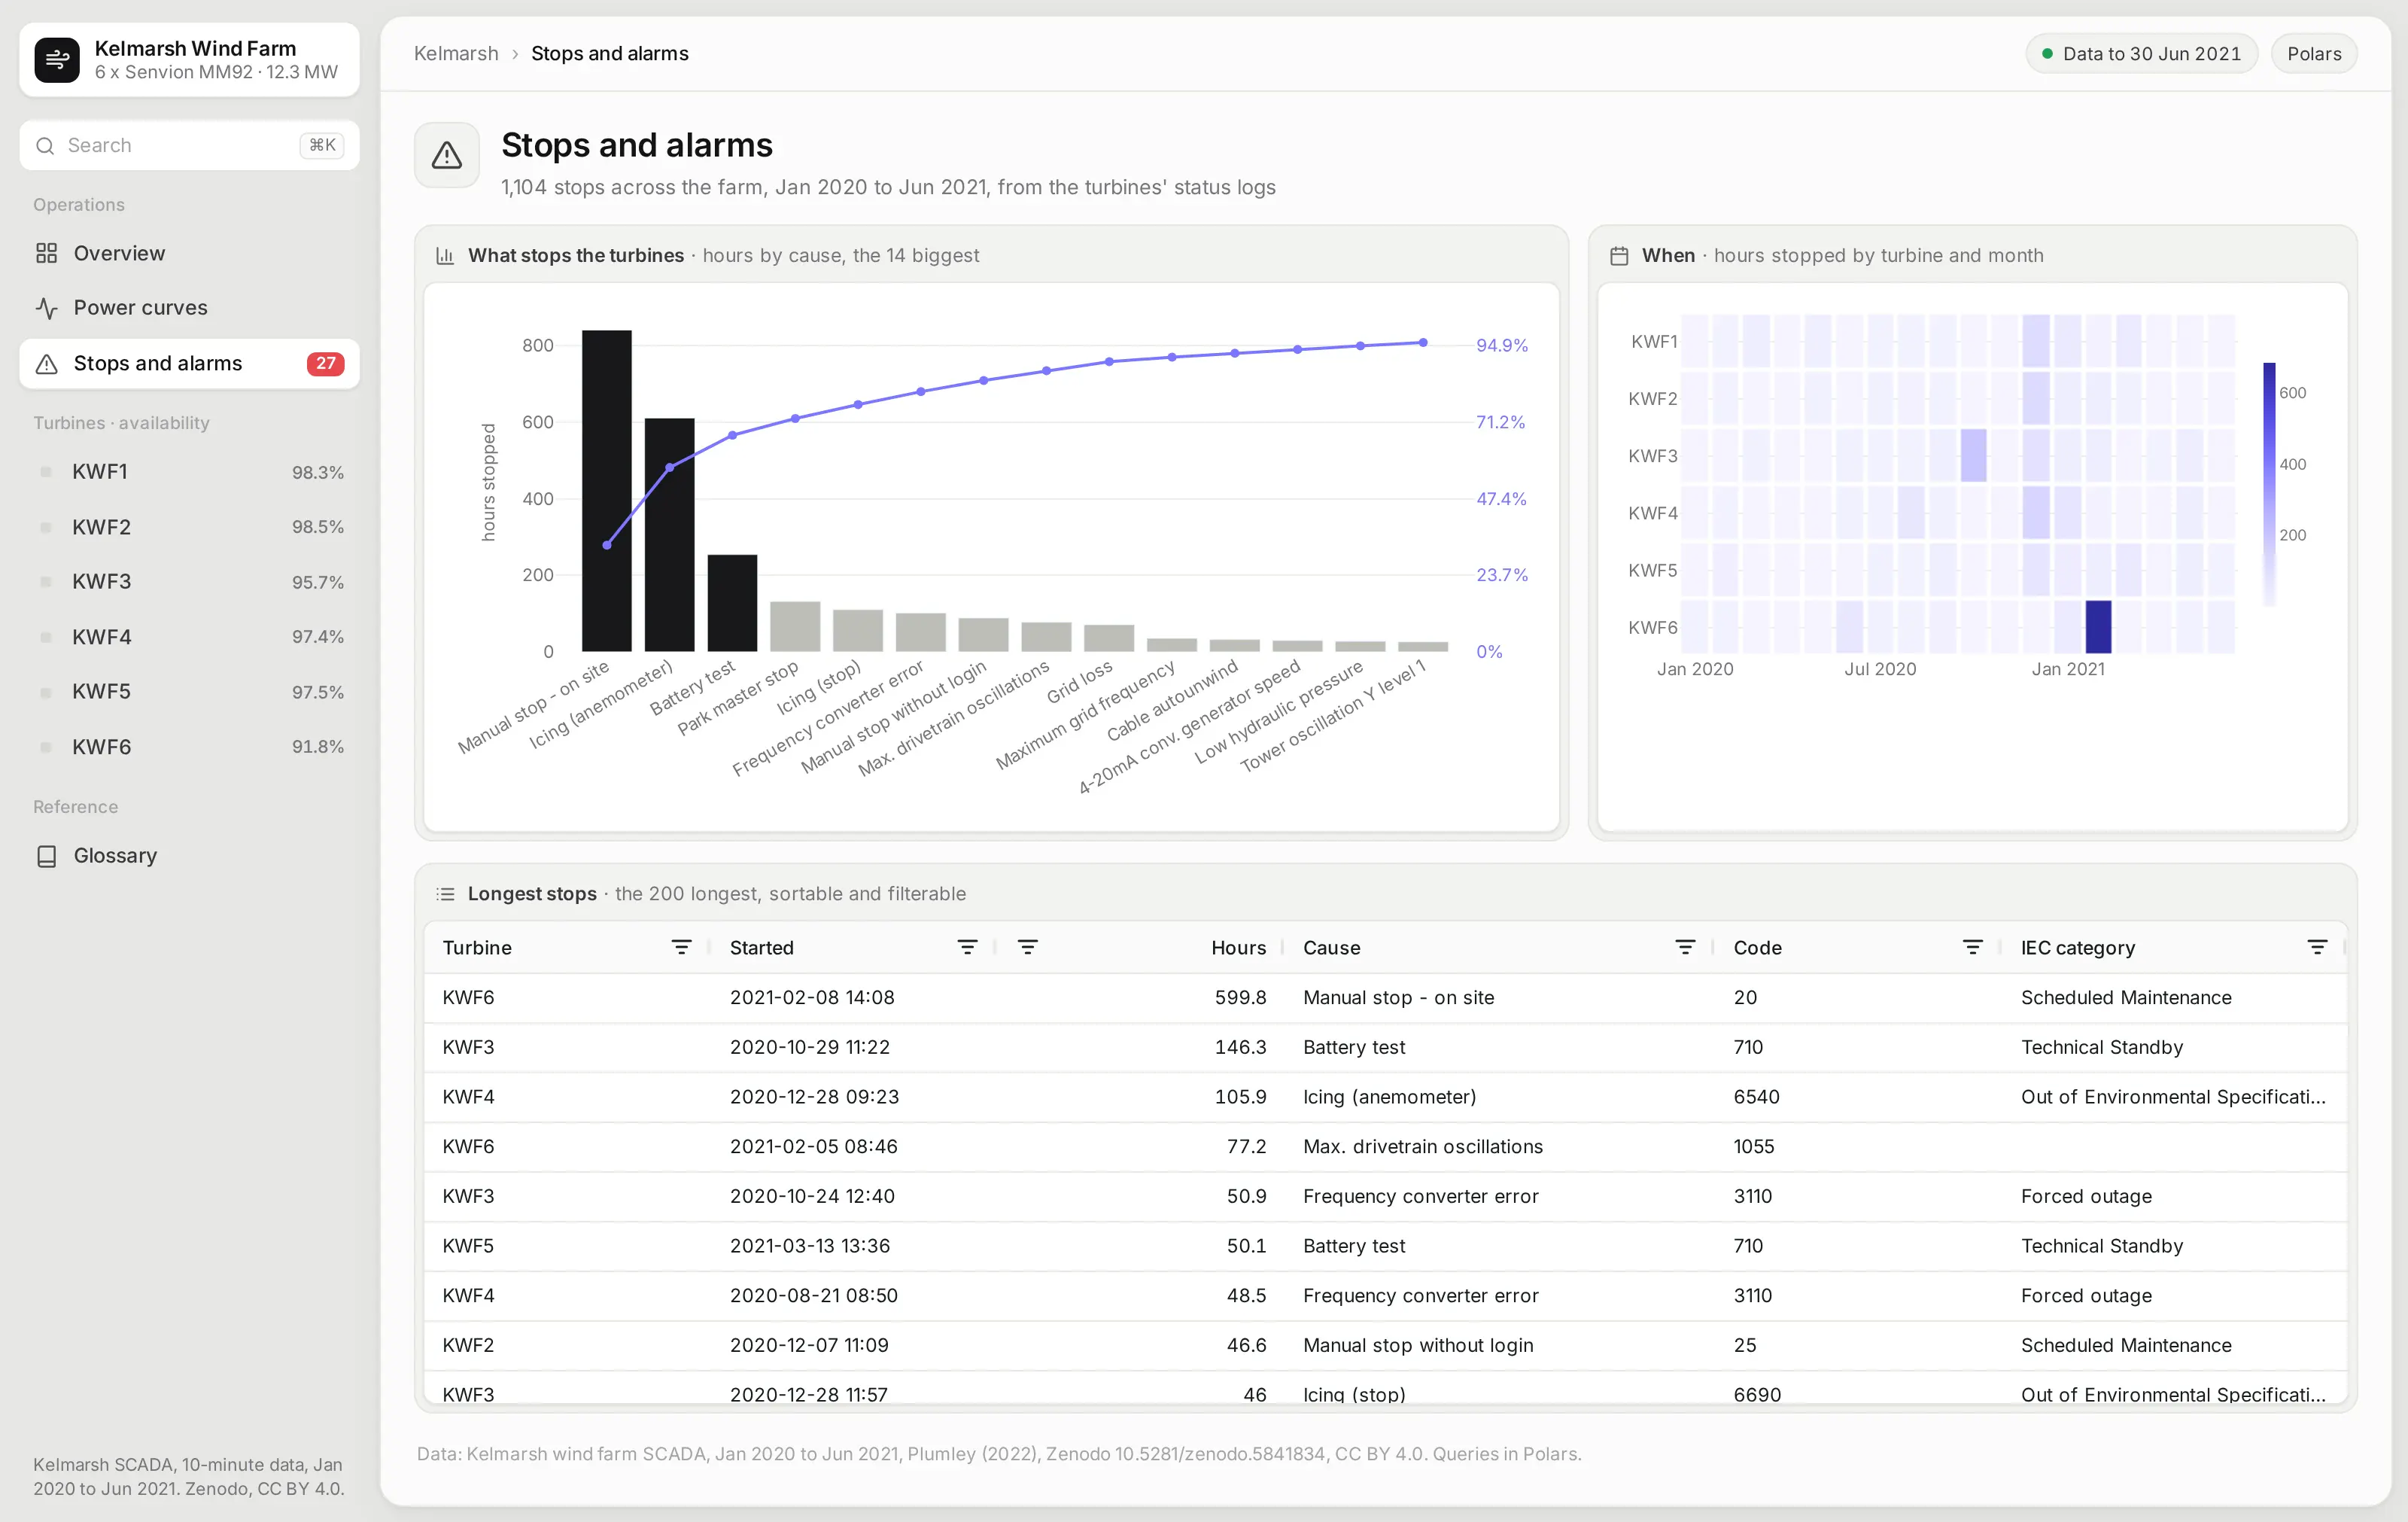
A Pareto chart ranks the causes of downtime by hours, with a cumulative line, so it's clear which few causes cost the most. A heatmap shows which turbine was down in which month.
The table of the longest stops can be sorted and filtered by turbine, cause, and IEC category, which is where a maintenance planner would start.
Ask the app from an AI agent
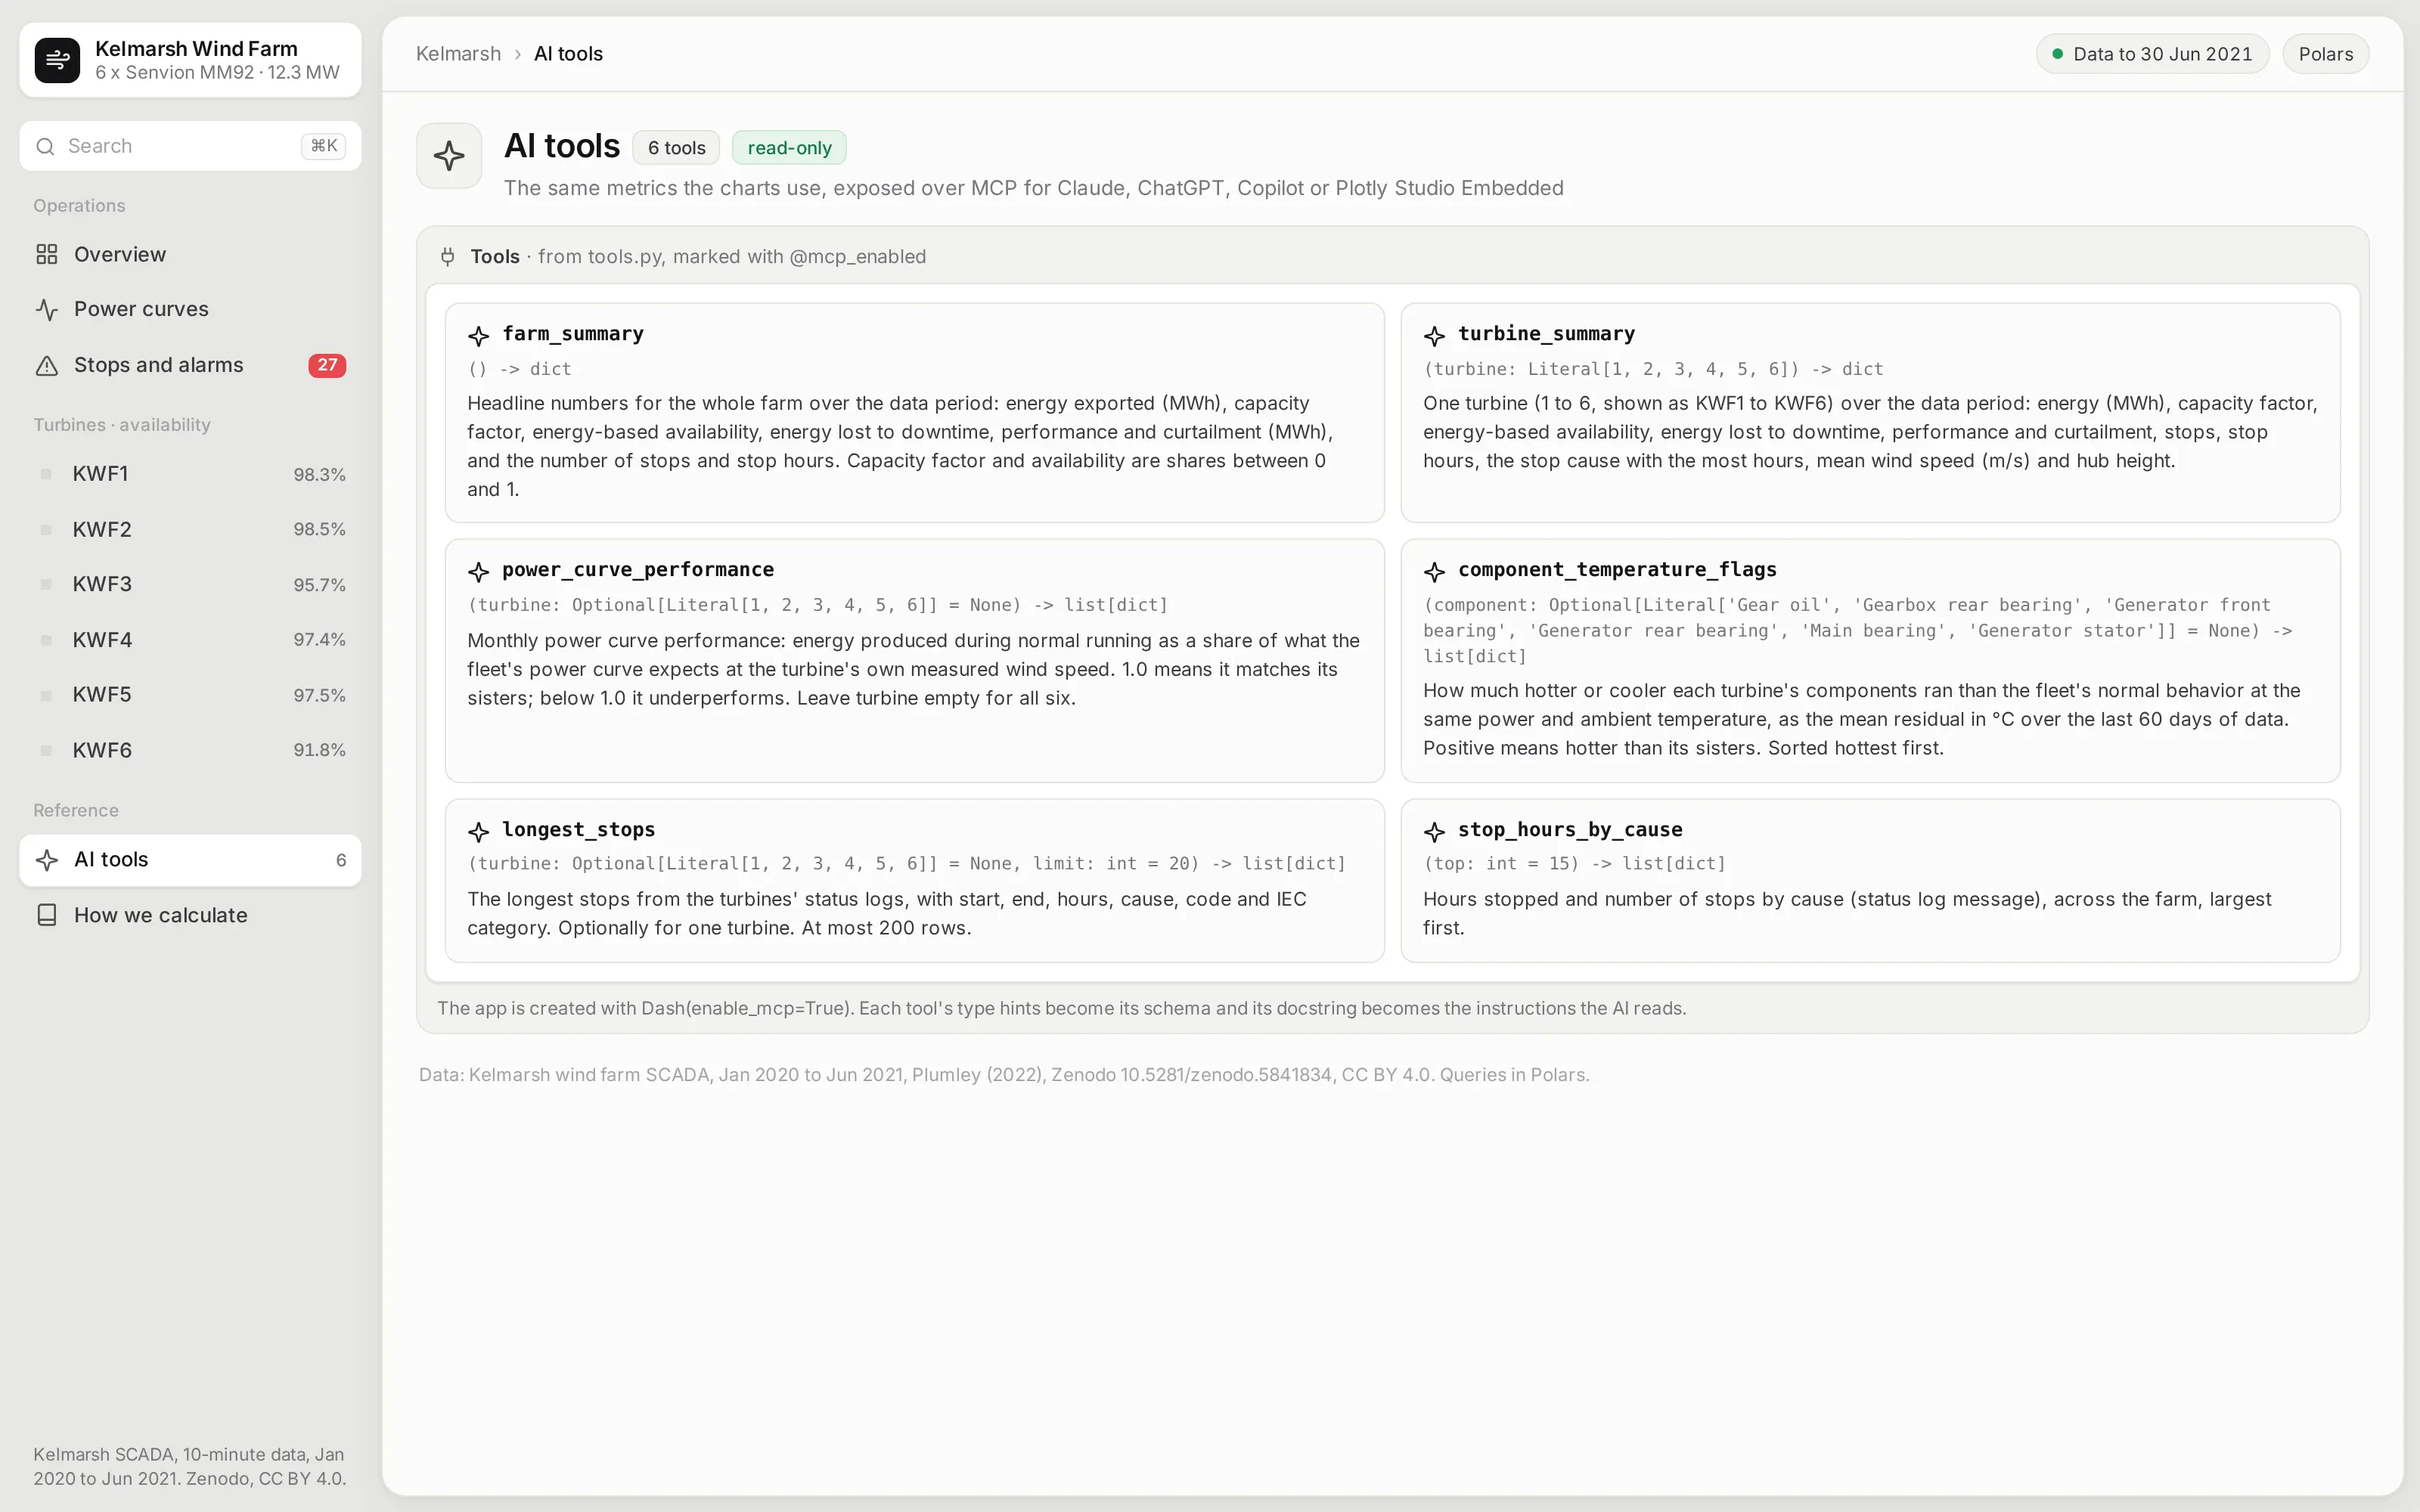
The app is also an MCP server. Six of its Python functions are marked with @mcp_enabled, so an AI agent connected to the app can ask which turbine's main bearing runs hottest, how a turbine tracks the fleet power curve month by month, or what stopped the farm longest, and get the same numbers the pages show.
Each tool's type hints become its schema, and its docstring becomes the instructions the agent reads:
from dash.mcp import mcp_enabled@mcp_enabled(expose_docstring=True)def component_temperature_flags(component: Optional[Component] = None) -> list[dict]:"""How much hotter or cooler each turbine's components ran than the fleet's normal behavior at thesame power and ambient temperature, as the mean residual in °C over the last 60 days of data.Positive means hotter than its sisters. Sorted hottest first."""f = W.component_flags()if component:f = f.filter(pl.col("component") == component)return _records(f.with_columns(pl.col("resid").round(2)).sort("resid", descending=True))
Ask it inside the app with Plotly Studio Embedded
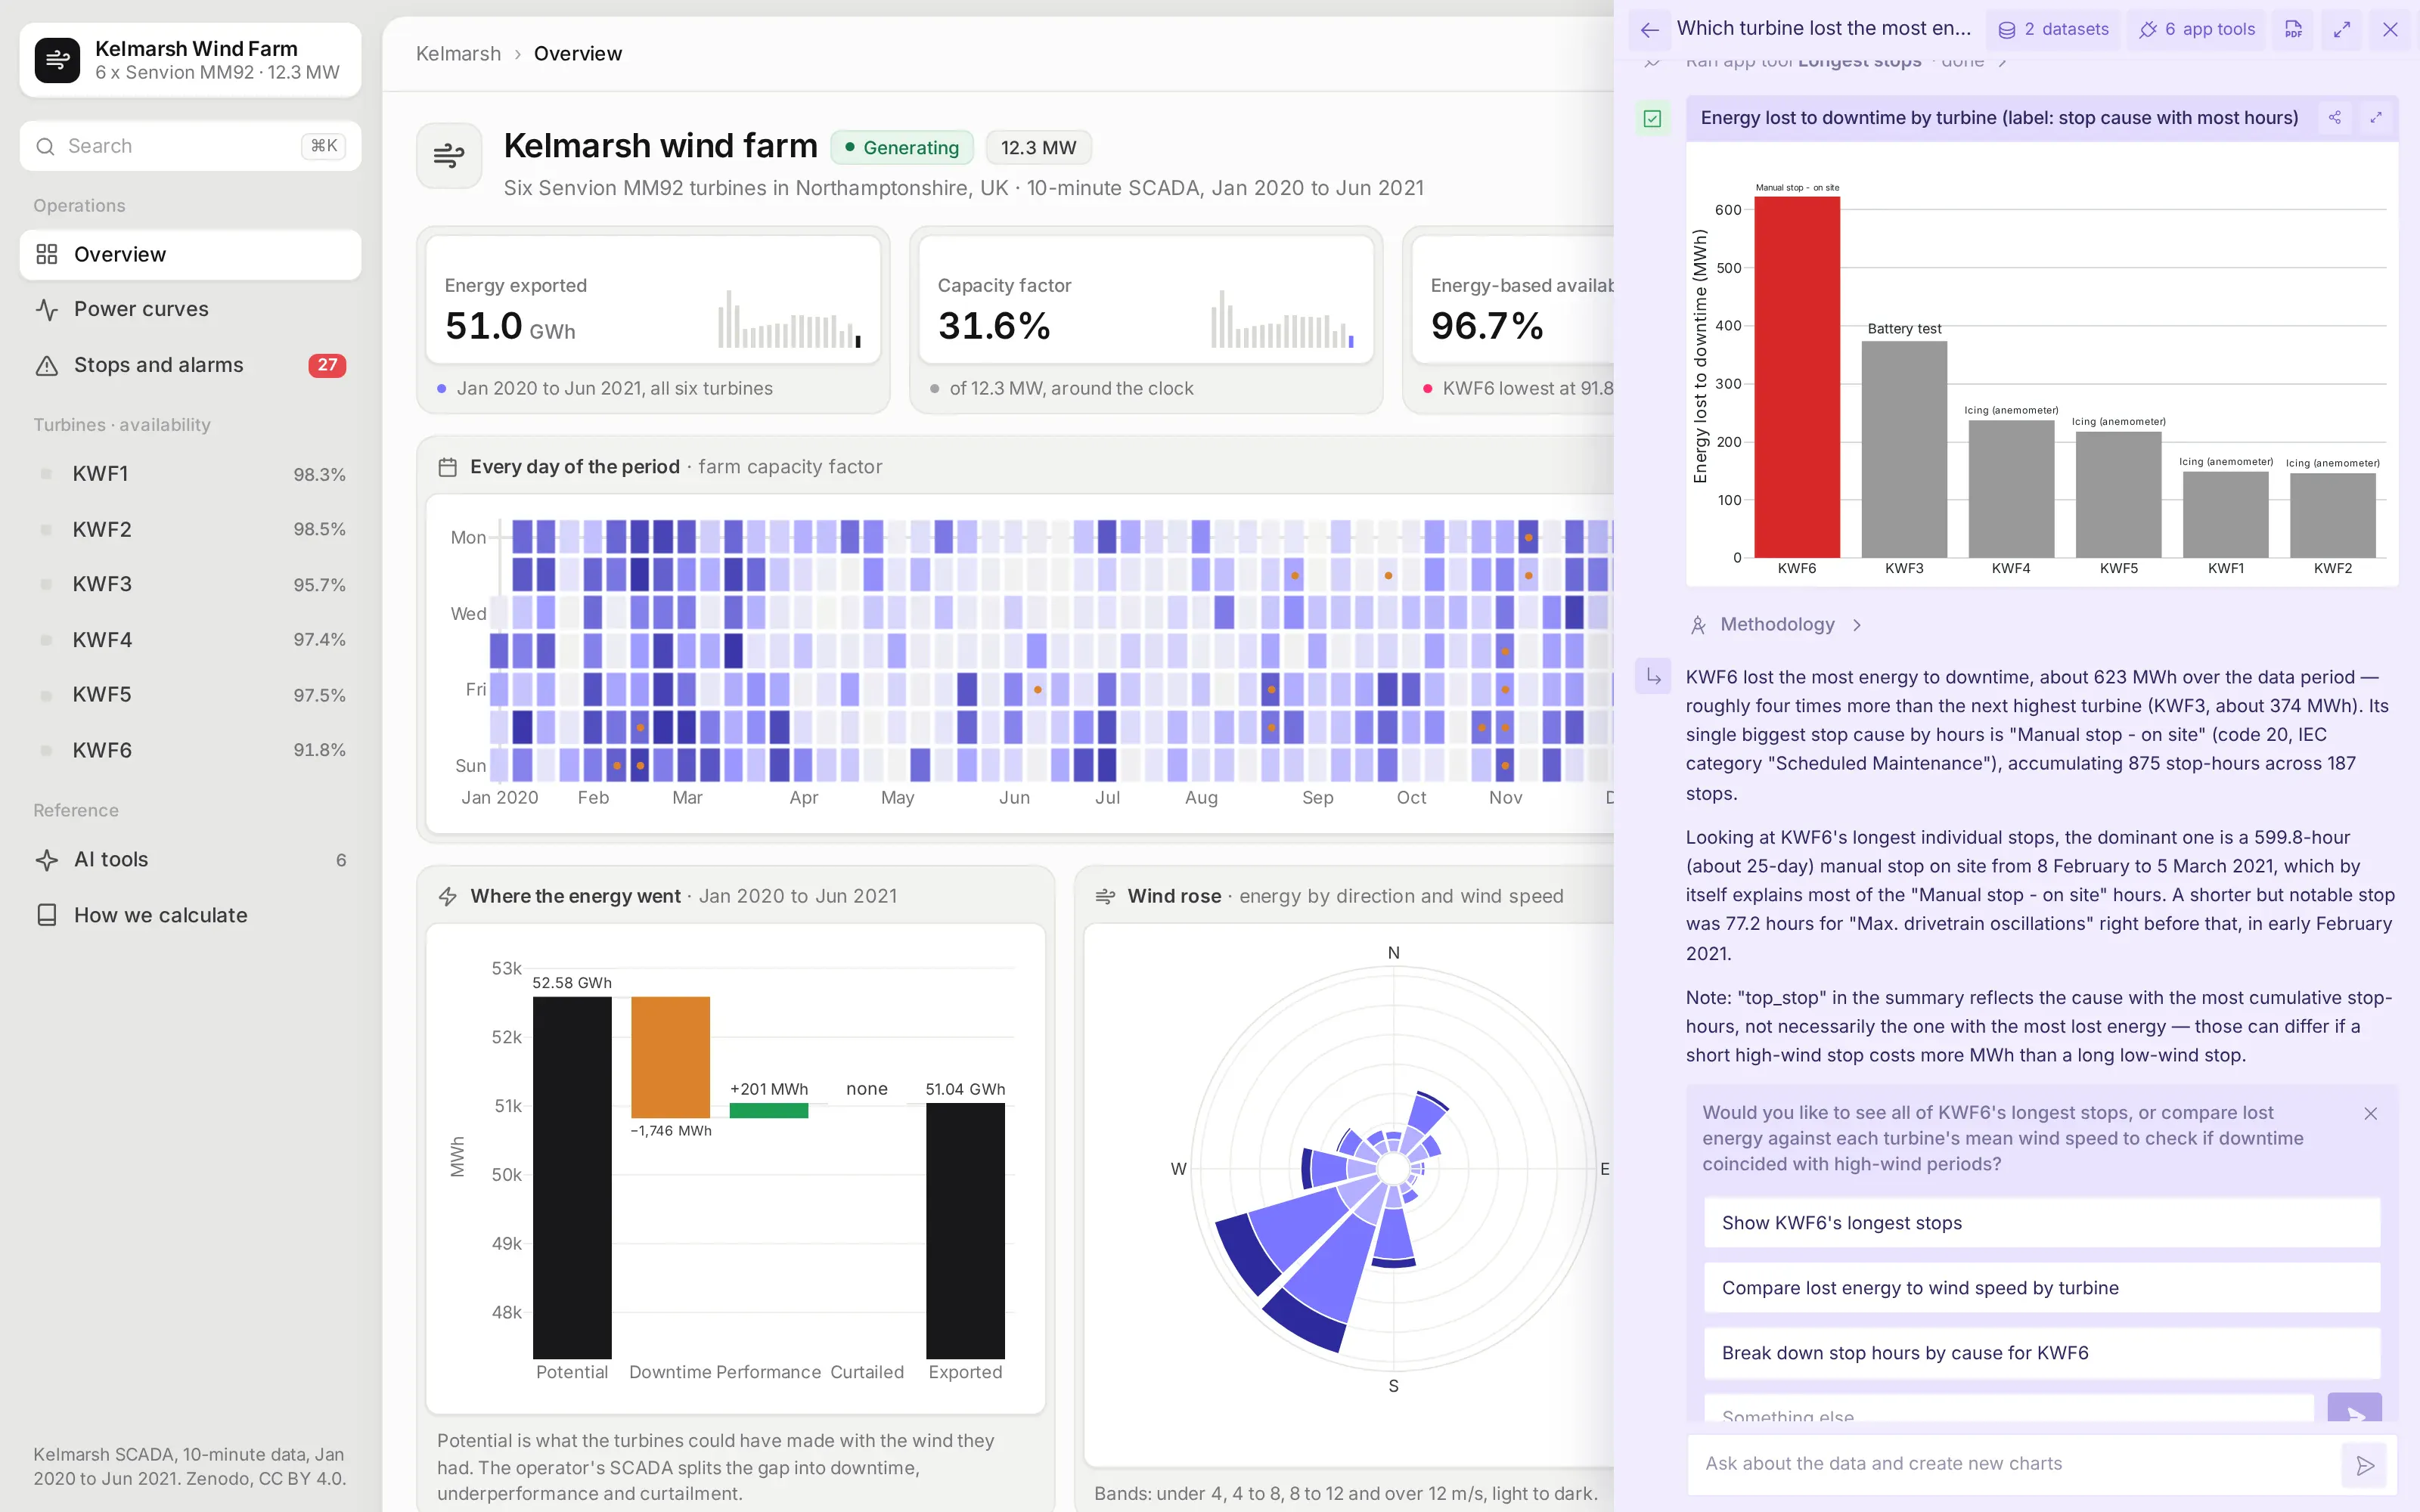
On Plotly Cloud you can switch on Plotly Studio Embedded, a chat panel that sits on top of the app and calls the same tools. Asked which turbine lost the most energy to downtime, and what stopped it, it ran the app's longest_stops tool and drew the chart from what the tool returned, so its numbers match the app's own pages.
Studio Embedded is available on Plotly Cloud now and comes to Dash Enterprise in Q4 2026. Every answer has a Methodology link that shows the tool calls and code behind it.
See how every number is defined
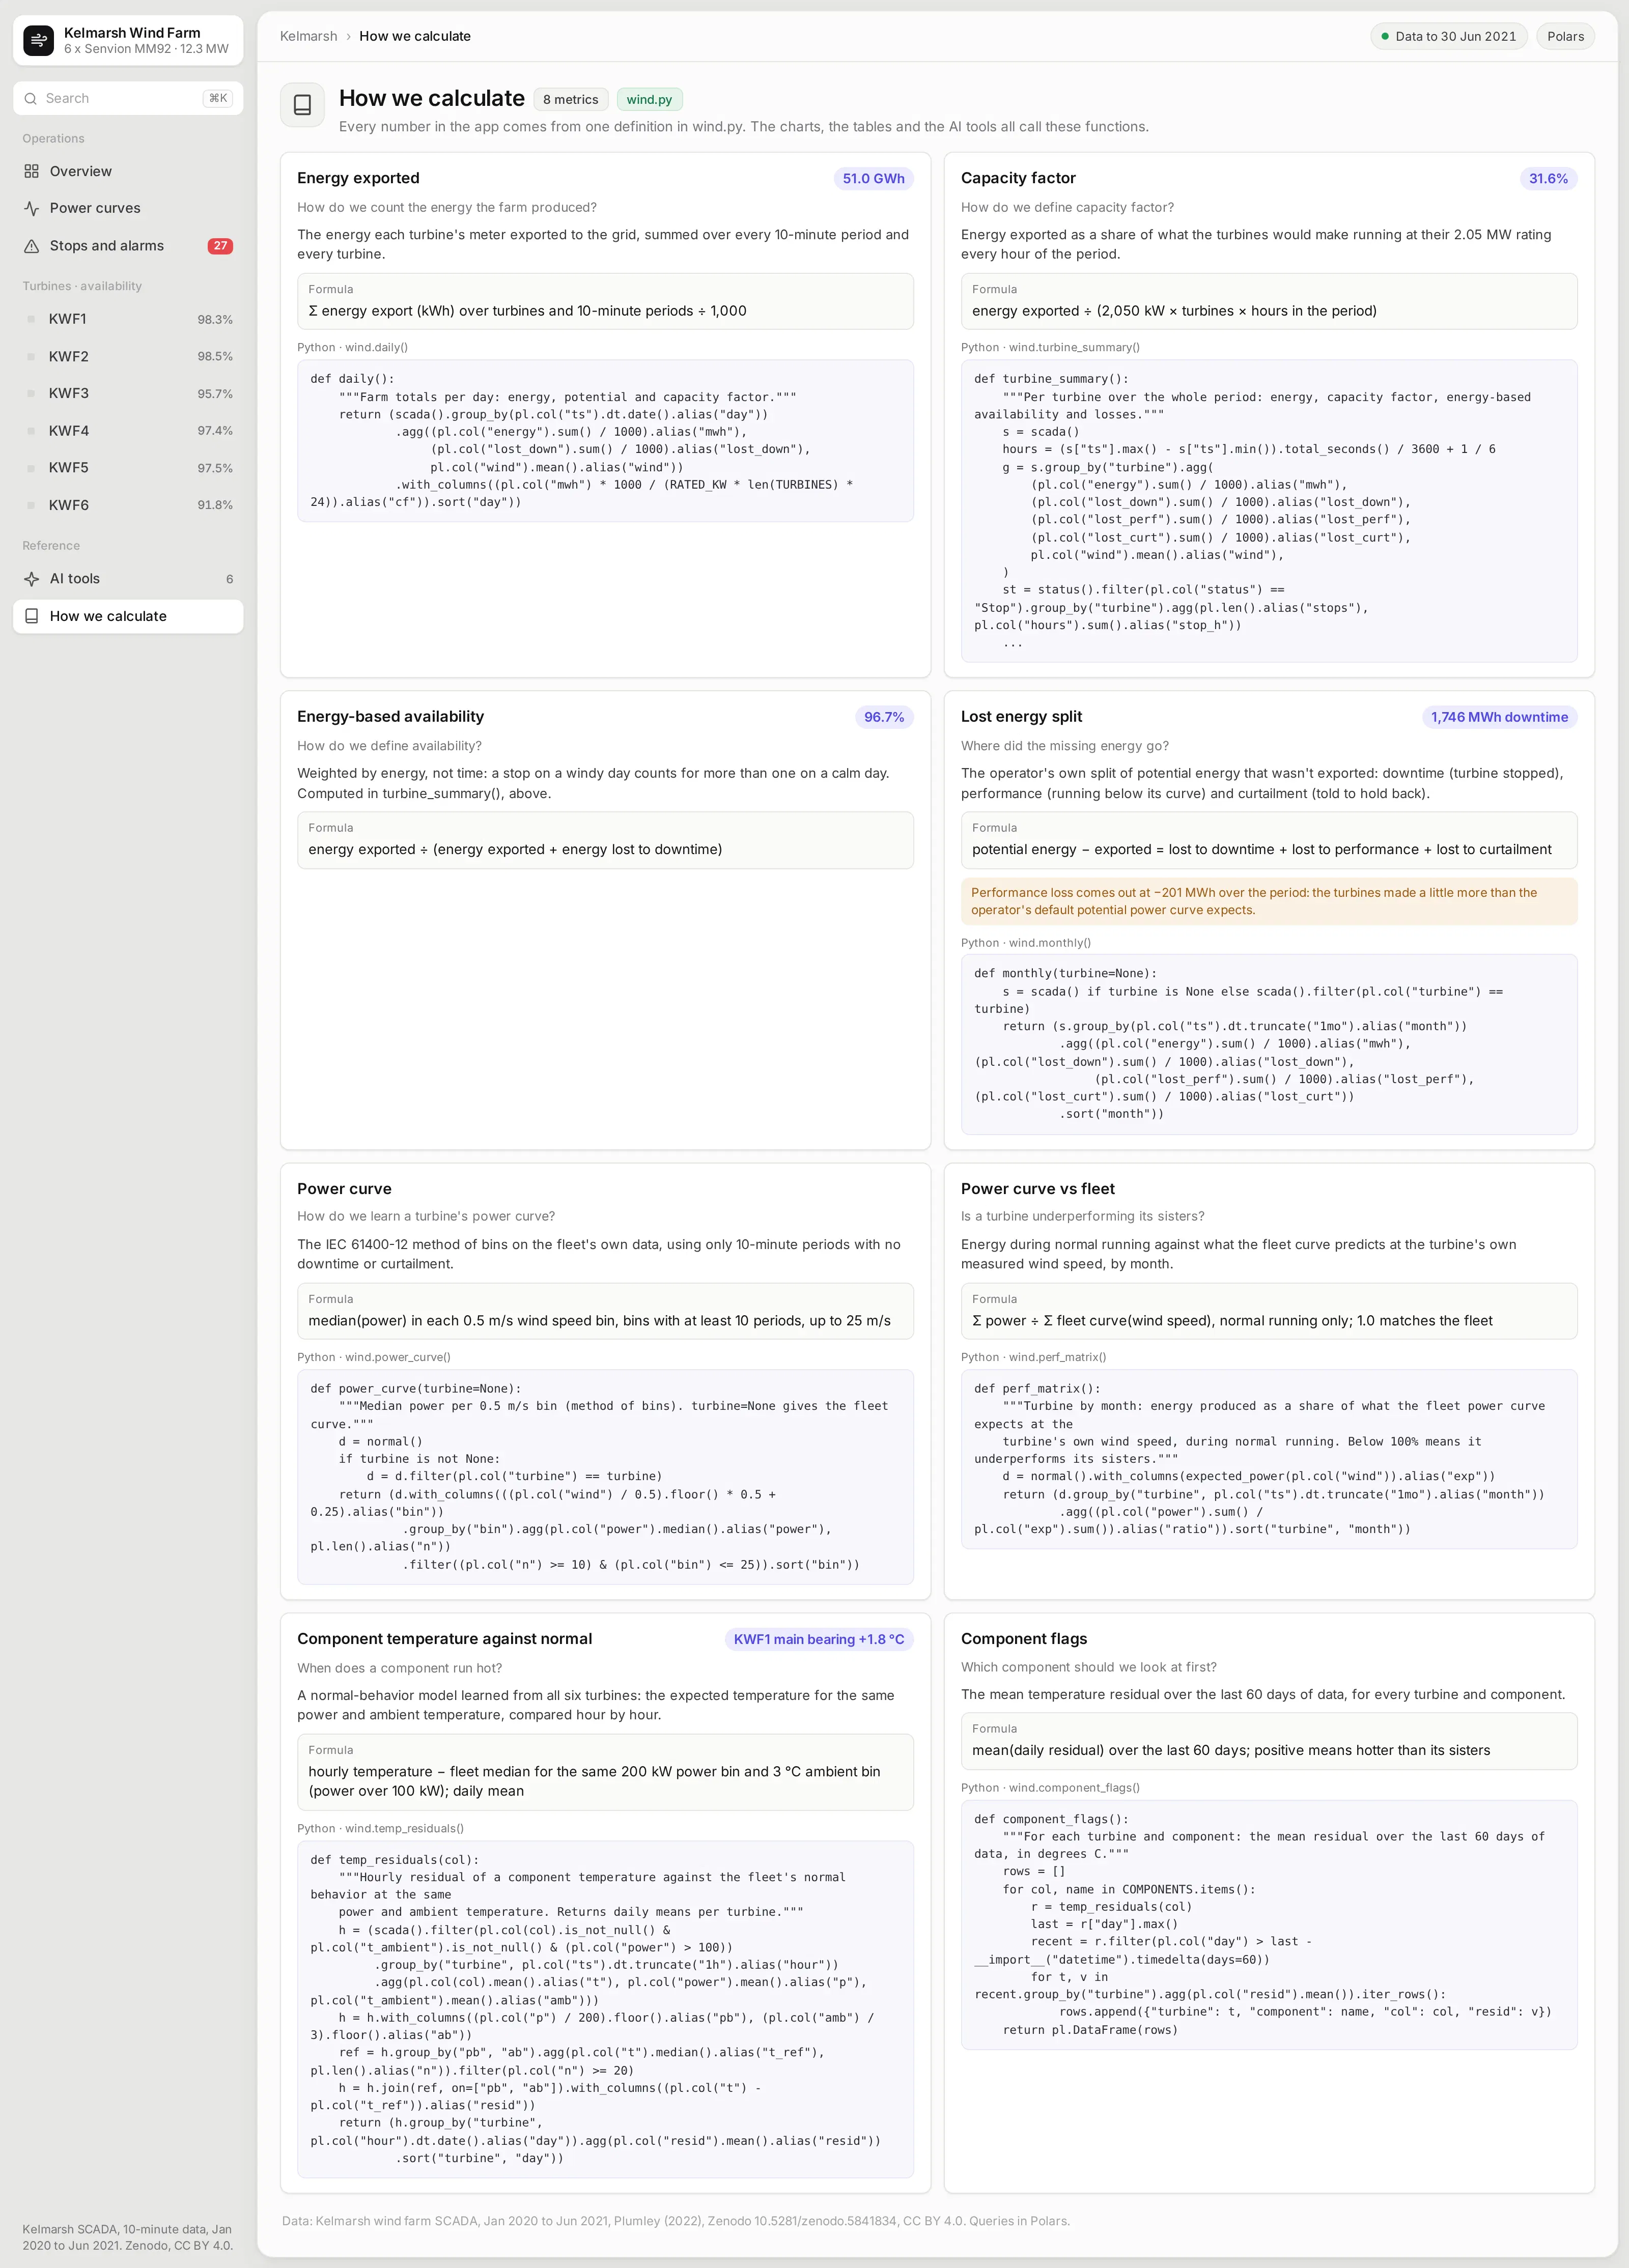
The How we calculate page answers "how do we define this?" for every number in the app: capacity factor, energy-based availability, the lost energy split, the power curve, and the temperature model. Each card gives the definition in plain words, the formula, the current value, and the Polars function that computes it.
This is the app's semantic layer, written as plain Python functions. The pages, the AI tools, and this page all call the same functions, so a definition changes in one place and everyone sees the same number.
What else could you add?
The prompt is a starting point. These are the kinds of things teams usually ask for next, and each one is a sentence or two more in the prompt:
- Read from your own SCADA historian or data platform instead of a public export, and refresh every 10 minutes
- Raise a work order when a component drifts past a threshold, and write it back to your maintenance system
- Add yaw misalignment and pitch checks, or blade icing detection from the power curve
- Compare actual output with the energy yield assessment and the contract's availability guarantee
- Switch on Plotly Studio Embedded so people can ask the app's own MCP tools questions in a chat beside the charts
How is this different from Spotfire and other BI tools?
If you're comparing Spotfire alternatives or other BI tools, the main differences come down to five things:
- With AI, apps like this can be built quickly and cheaply by anyone, including the performance engineers and asset managers who know the data best.
- The apps are backed by code, which you can version control, manage, and update more easily than a fleet of point-and-click dashboards, especially when AI is making the changes.
- The apps can go much further than a traditional BI tool, with multiple pages, write-back to databases, custom simulations, AI chart building inside the app, MCP endpoints, and more.
- You have full control over the app: the look and feel, the controls, filters, and buttons, and every computation. You aren't fighting a tool to get what you want.
- The apps can connect to several data sources at once, and to the other systems your team already uses.
How long did it take to build?
About 20 minutes of agent time. Claude Code (with Claude Opus 5.5) downloaded the public data, checked it, built the app, ran it, took screenshots, and fixed what looked wrong in them, all from one prompt.
Before building anything on the data, it compared each turbine's 2020 energy export, summed from the 10-minute records, with the production total printed at the top of that turbine's status log. All six matched to the kilowatt-hour.
The prompt
Paste this into Claude Code, Codex, Copilot, Cursor, or another coding agent, in an empty folder. Swap in your own data source and the features you need.
Build a Dash app for wind farm asset monitoring on the Kelmarsh wind farm's public SCADA data, using Polars for every query.
Data
- Download the Kelmarsh SCADA and status exports for 2020 and 2021 from Zenodo (doi 10.5281/zenodo.5841834) and save them as Parquet.
- Keep the 10-minute power, wind, potential power, the lost-energy split, and the component temperatures, plus every stop and warning from the status logs.
- Check each turbine's 2020 energy against the production total in its status file before you build anything, and tell me how close they are.
Pages (each with its own URL, and the back button must work)
- Overview: KPI cards for energy, capacity factor, energy-based availability, and downtime losses, with sparklines. A calendar heatmap of daily output. A waterfall from potential to exported energy. A wind rose. A map of the turbines. A turbine table where each row opens the turbine.
- /turbine/<n>: the power curve as a 2D histogram with the turbine's and the fleet's curves on top, component temperatures against a normal-behavior model learned from the fleet, a timeline of stops, and monthly energy and losses.
- /performance: a turbine-by-month heatmap of energy against the fleet power curve, and small multiples of each turbine's curve.
- /alarms: a Pareto of stop hours by cause, a turbine-by-month heatmap of hours stopped, and a table of the longest stops.
- A How we calculate page with every metric's definition, formula, current value, and the function that computes it.
- An AI tools page listing the metric functions exposed with `@mcp_enabled`.
Design
- A gray page with an inset sidebar. Each card is a light surface with its title above a white inset panel for the chart or table. Inter everywhere. No chart toolbars.
Run it, screenshot every page at 1600x1000, and fix anything that overflows, looks empty, or doesn't match the numbers before you stop.
How do I run it on Dash Enterprise or Plotly Cloud?
Dash Enterprise runs Dash apps inside your own infrastructure, behind your firewall and even air-gapped, with single sign-on and access control for each app.
This app needs nothing special. It's a Dash app with a requirements.txt, and your coding agent can deploy it through the Dash Enterprise or Plotly Cloud command line.
Keep the Parquet files on a persistent filesystem so the app doesn't download the data again after a restart. Point the app at it with an environment variable such as DATA_DIR=/data.
If you'd rather not run any infrastructure, Plotly Cloud hosts the same app for you. We tested this one there.
Tips and tricks
These are things we like doing when we build apps like this one.
- Ask for a page per thing. A page for each turbine, with its own URL, makes the app feel like a website rather than a report, and lets people share exactly what they're looking at.
- Make the agent check the data first. Ask it to compare a total with a number the source publishes before it builds the charts. That check is what lets you trust everything built on top of it.
- Learn "normal" from the fleet. Six identical turbines on one site are each other's best reference. Comparing a turbine with its sisters at the same load removes the weather and the season from the picture.
- Let plain Python functions be your semantic layer. The power curve, the availability calculation, and the temperature model are short Polars functions, and you can read them, test them, and change them, and so can the agent. Plain Python functions like these can become your semantic layer, one definition that every page, test, and agent uses.
- Have the agent look at its own screenshots. Asking it to fix anything that overflows or looks empty catches most layout problems before you see them.
- Wrap your Python functions in @mcp_enabled. Turn on enable_mcp=True in the Dash(...) call and mark the functions with @mcp_enabled, and chat agents like Claude, ChatGPT, or Copilot can call them over MCP and get the same numbers the app's pages show.
- Switch on Plotly Studio Embedded. The same tools power Plotly Studio Embedded, an AI chat inside the app that answers questions with charts and tables built from your functions. It's available now on Plotly Cloud (in beta) and is planned for Dash Enterprise in Q4 2026.
FAQ
See what Dash Enterprise and Plotly Cloud can do for your team
Our customers in energy, pharma, finance, and manufacturing are building apps like this one with coding agents and running them on Dash Enterprise behind their firewall or on Plotly Cloud. Request a demo and we'll show you how it works for your team.