
Chris Parmer
November 16, 2026
Continued process verification app for tablet manufacturing
A data app example built with Dash and an AI coding agent in 20 minutes
TL;DR
- Building data apps with AI coding agents in Python and managing them on Dash Enterprise or Plotly Cloud is the modern alternative to BI. At Plotly, many of our customers are migrating away from point-and-click tools like Spotfire, Tableau, and Power BI toward code-backed tools powered by AI. This example showcases the types of apps that you can create.
- This app covers continued process verification (CPV), the ongoing check that a validated manufacturing process stays in control, for a cholesterol-lowering tablet. It runs on real production data for 1,005 batches published by Janja Žagar and Jurij Mihelič, and a coding agent built it from one prompt in about 20 minutes.
- You can go from a control chart to a single batch by clicking, and see that batch's tablet press data, the material lots it was made from, and where it sits against every other batch.
- Every metric, from control limits to process capability, is defined once in a tested Python module, and a Metrics page in the app shows the code behind each number.
- The full prompt is below, so you can build the same kind of app on your own batch data and run it on Dash Enterprise behind your firewall or have it hosted for you on Plotly Cloud.
Walkthrough
Manufacturing science and quality teams review CPV in the same order each time: check whether the process is in control, find the batches that look unusual, and trace each one back to how it was made. The app follows that order, with pages for the overview, each batch, each quality attribute, the metric definitions, and a glossary.
Every page has its own URL, so the back button works and a link to a batch opens that batch. In a review meeting, you can send someone the page instead of a screenshot.
Check whether the process is in control
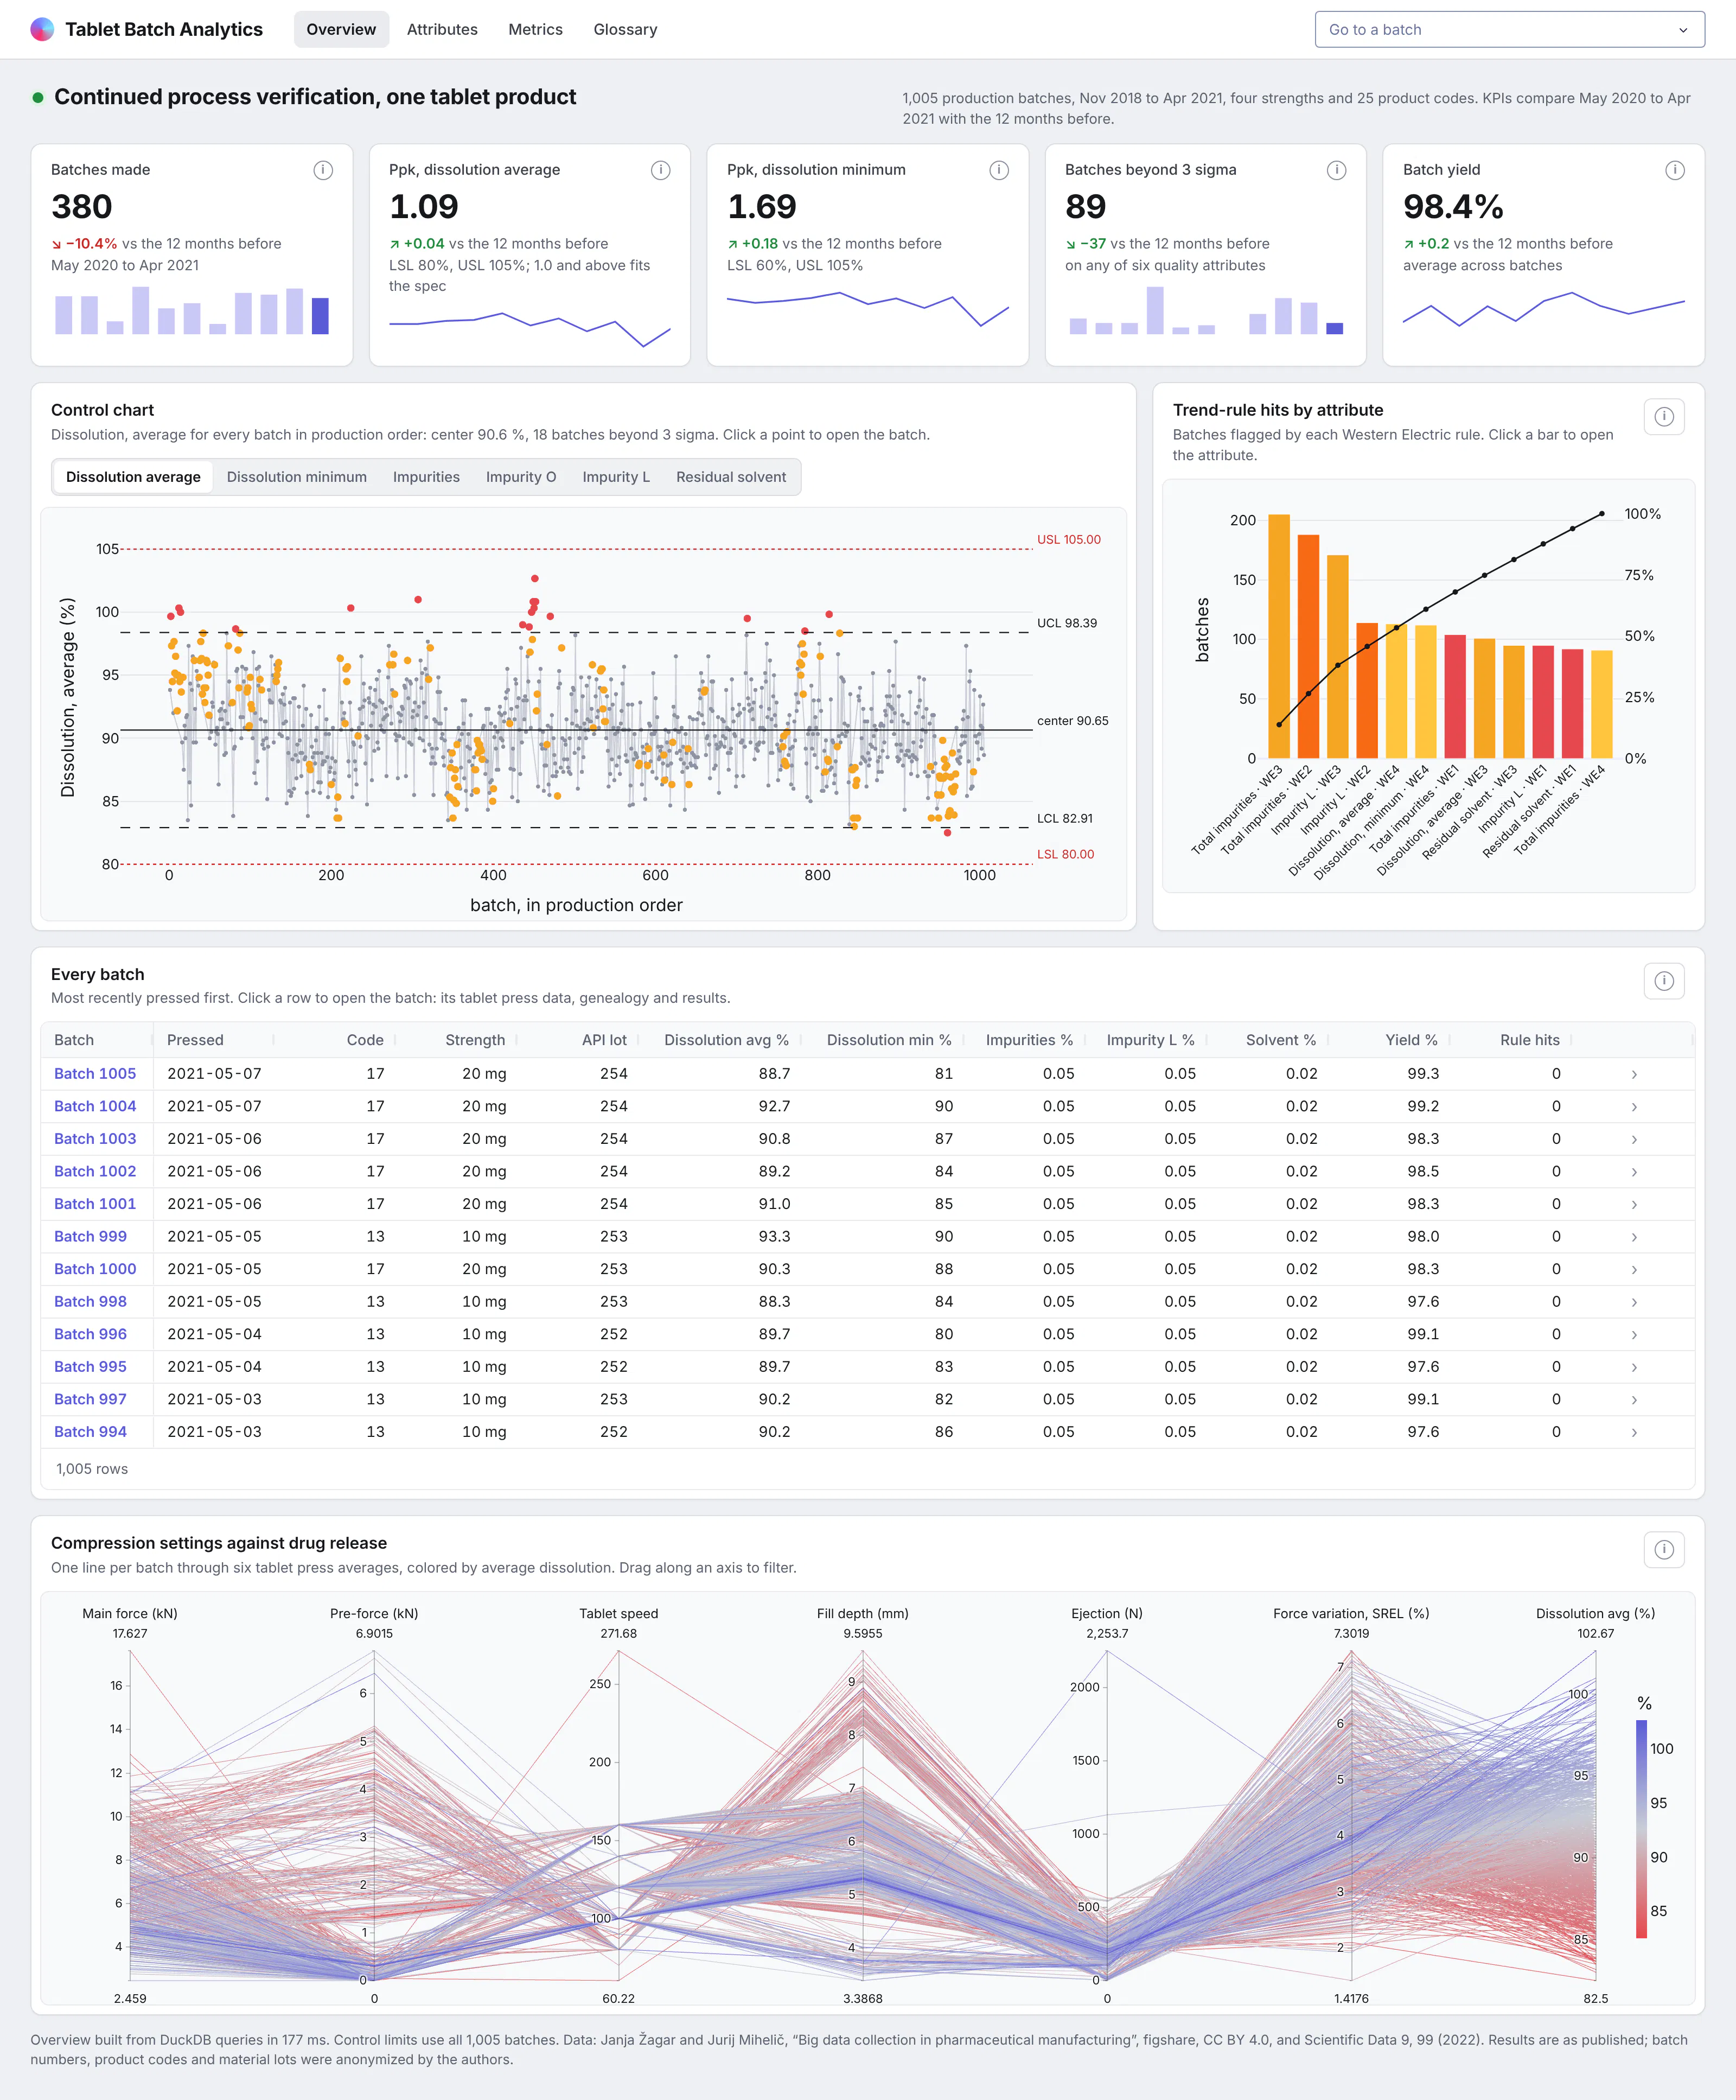
The overview opens with headline cards for the last 12 months of production, each compared with the 12 months before, including process capability (Ppk) for dissolution. Under them, an individuals control chart shows every batch in production order, with the four Western Electric trend rules highlighted.
Tabs switch the chart between six quality attributes, and clicking a point opens that batch. A Pareto chart next to it shows which rules fire most often and on which attributes.
Further down, a parallel coordinates plot runs one line per batch through the tablet press settings, colored by dissolution. You can drag along an axis to see which settings go with slow-releasing batches.
Trace a batch back to how it was made
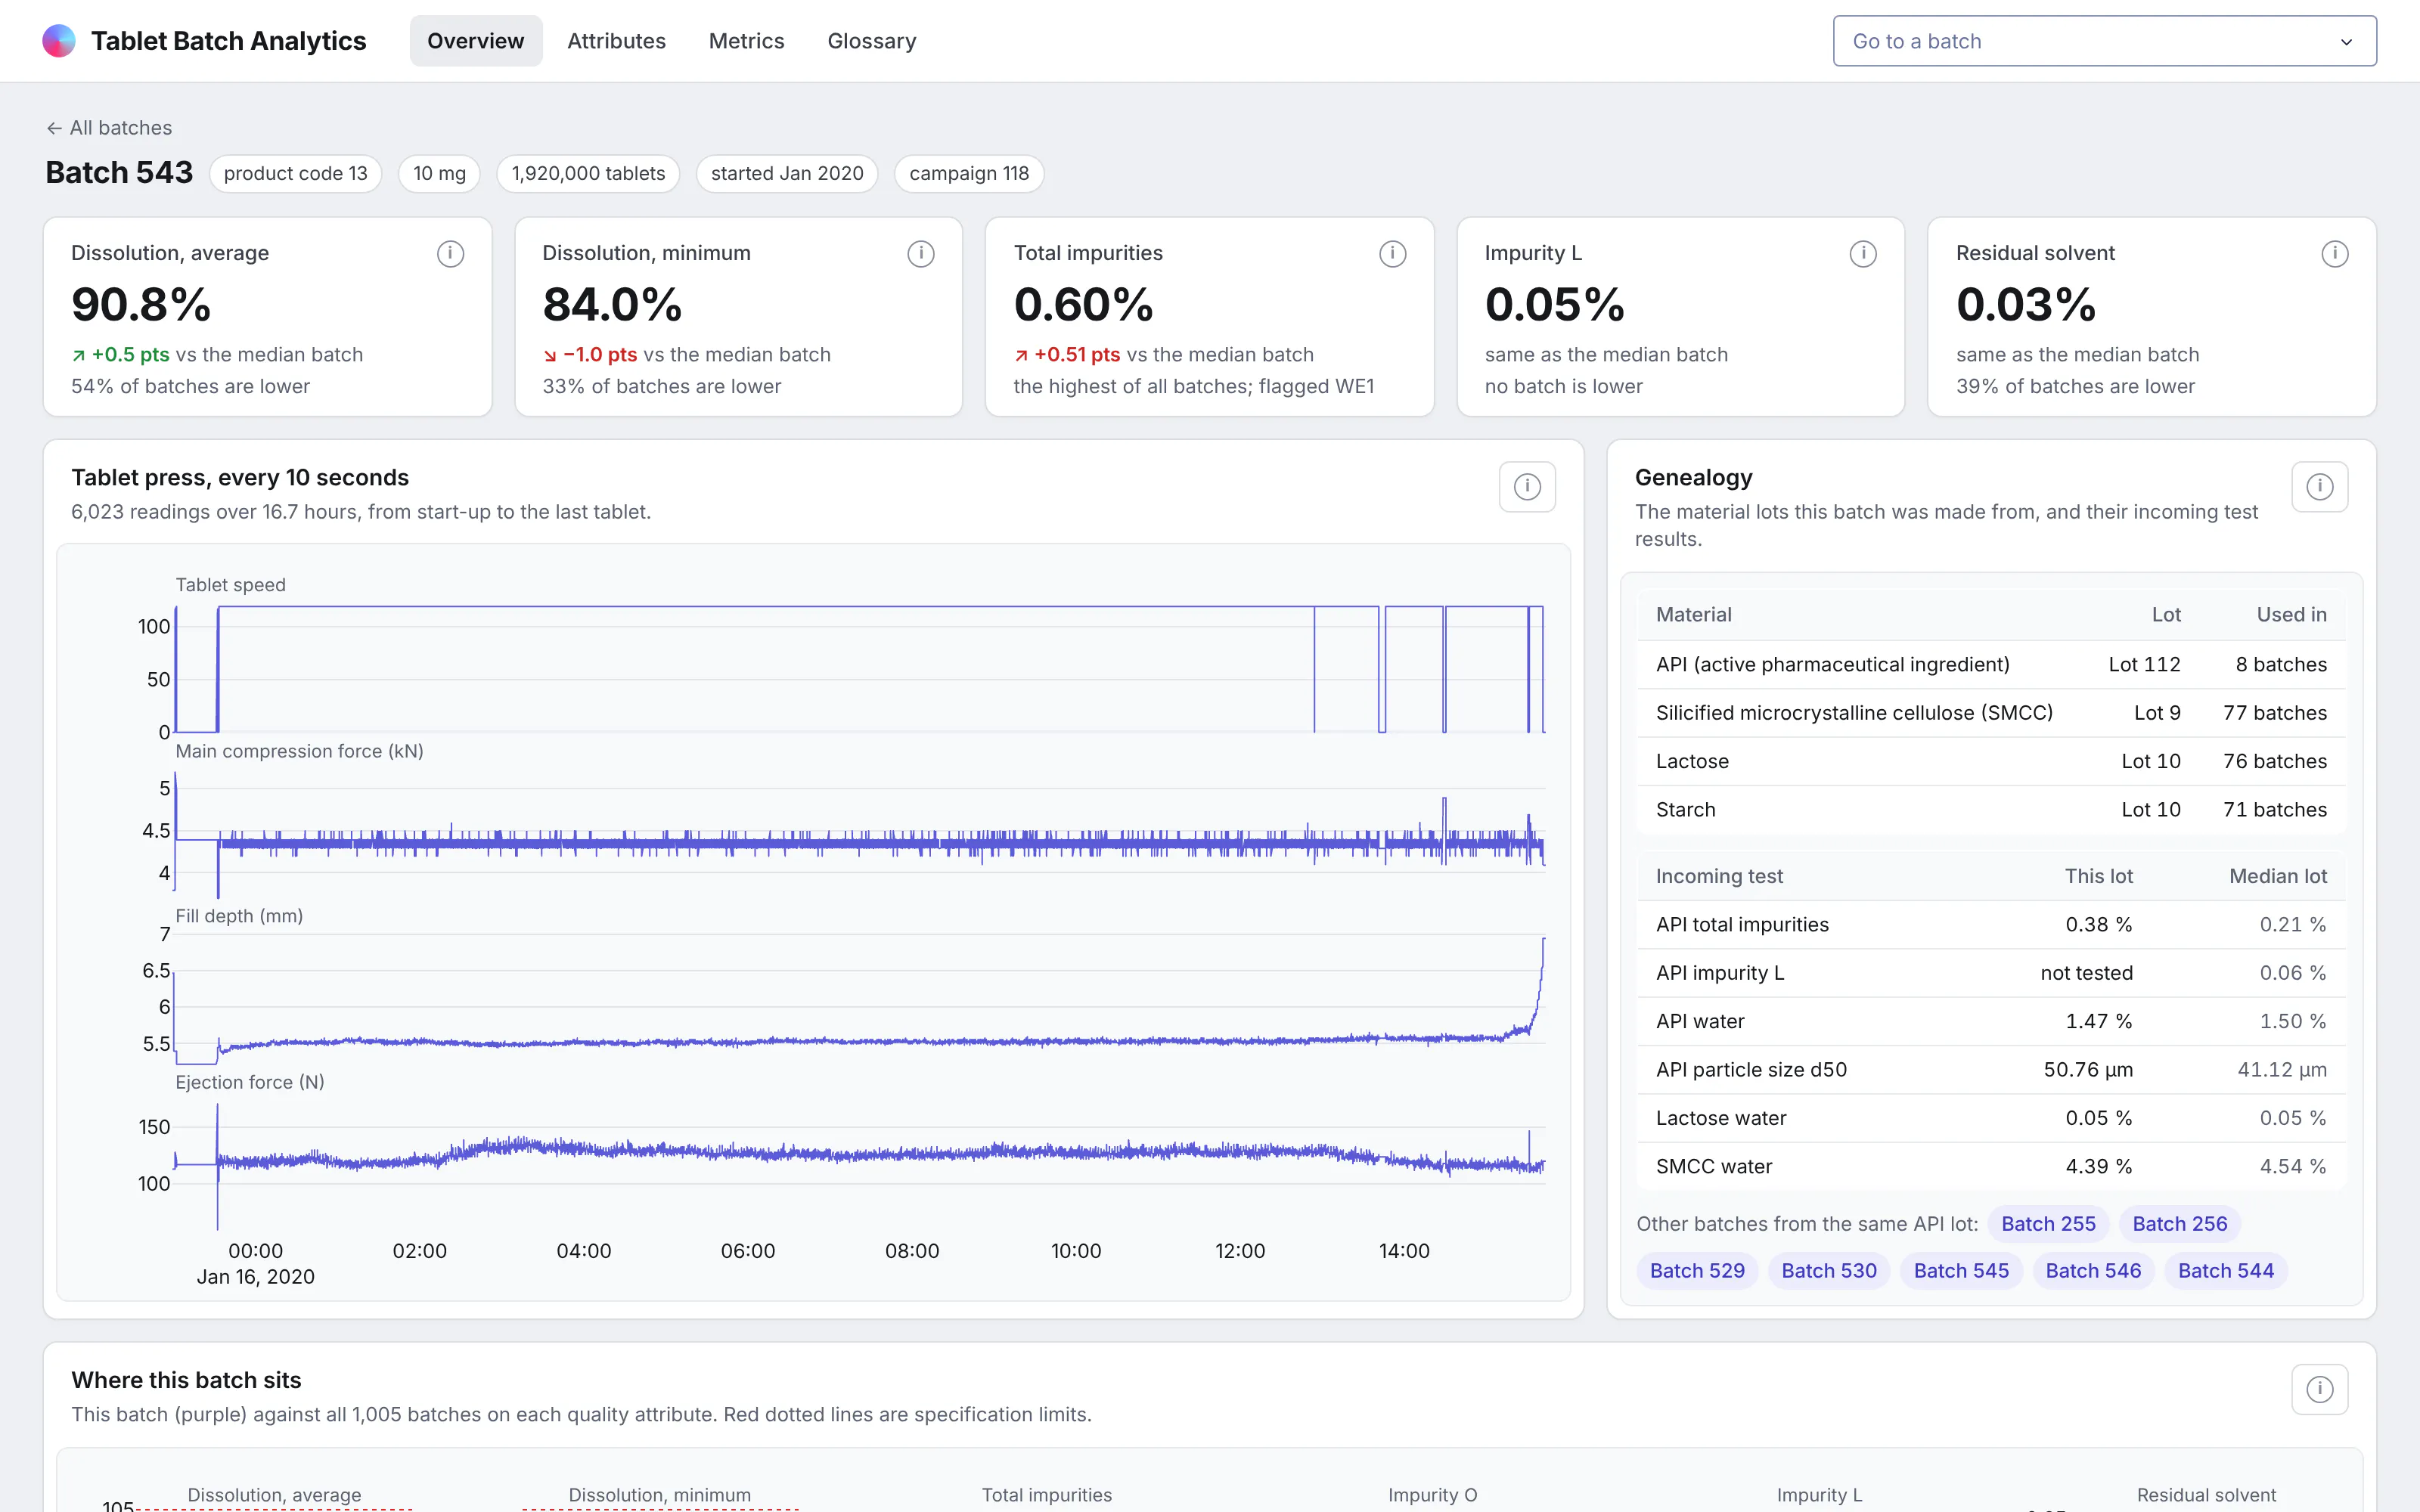
This is the page you'd open when a result looks wrong. It starts with the batch's quality results, each compared with the median batch, and any trend rules it triggered.
The tablet press data covers the whole run, read every 10 seconds: tablet speed, main compression force, fill depth, and ejection force. Next to it, the genealogy lists the lots of active pharmaceutical ingredient (API) and excipients the batch was made from, with their incoming test results.
Links to the other batches made from the same API lot let you check whether a problem follows the lot. Further down, strip plots show where the batch sits against every other batch.
See capability and what moves with each attribute
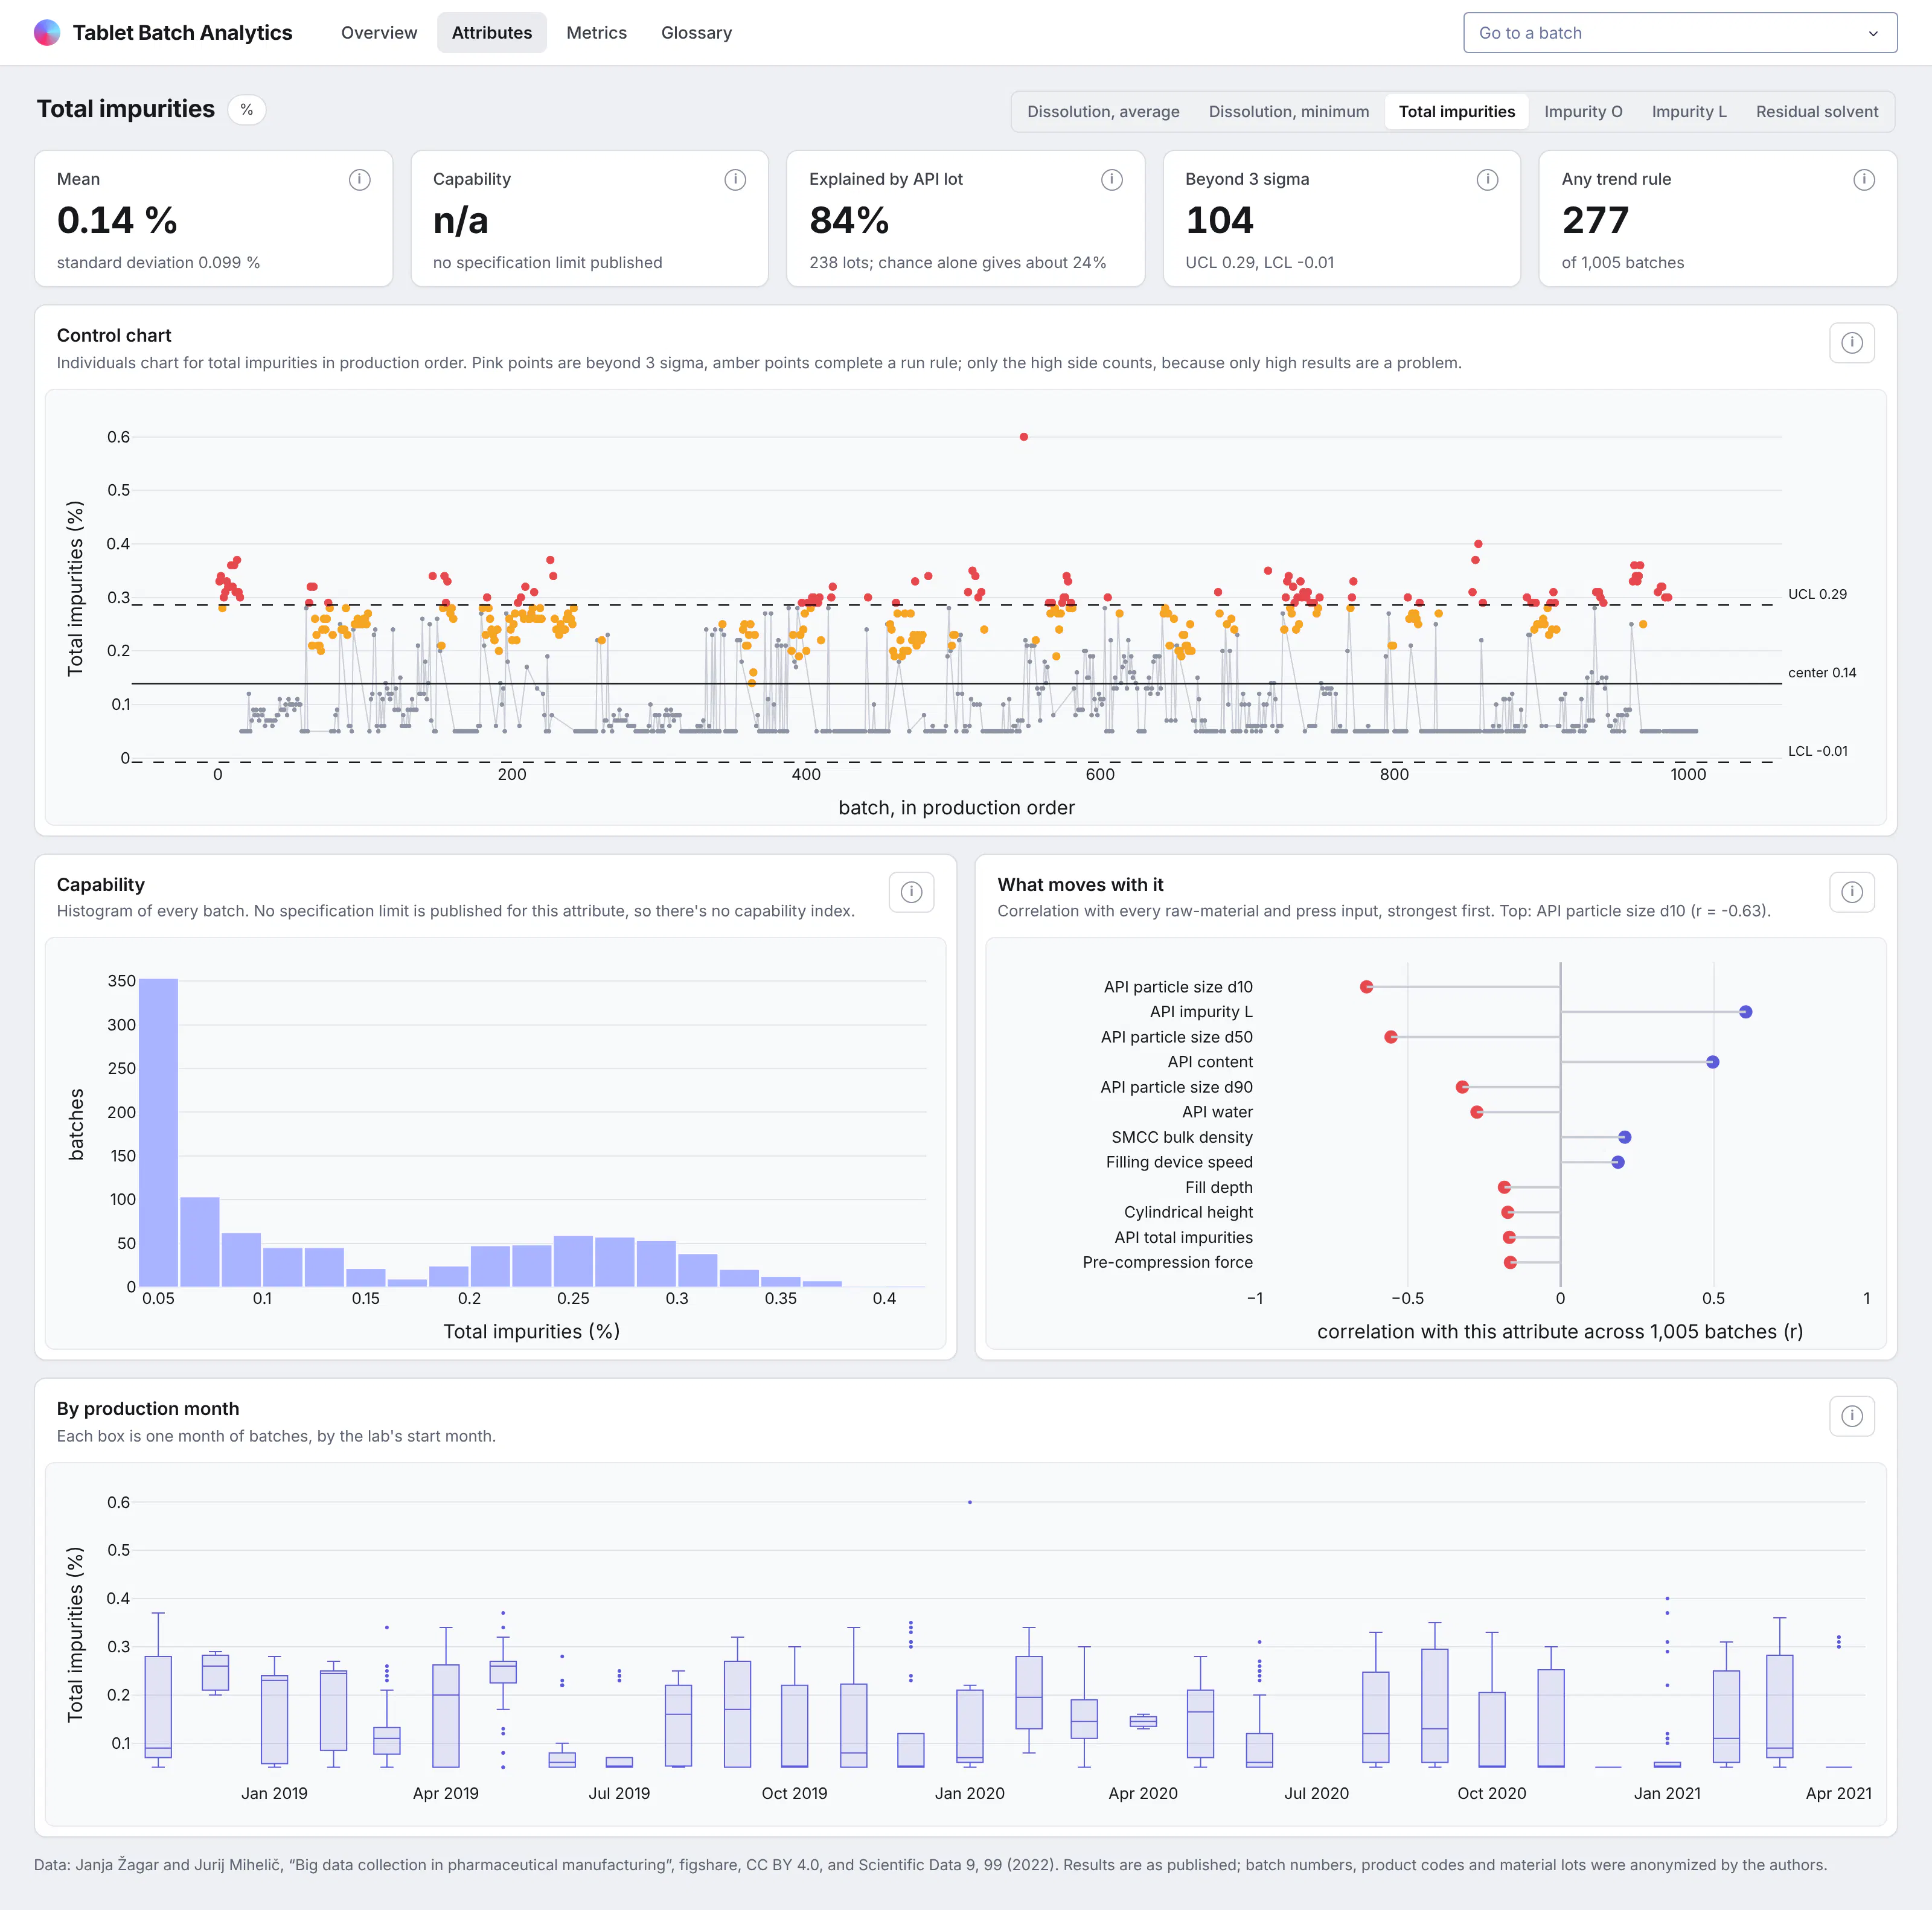
Each quality attribute has its own page with a control chart, a capability histogram with the specification limits, and a box plot for each production month. That makes it easy to tell a one-off from a drift.
A "what moves with it" chart ranks every raw-material test and tablet press setting by its correlation with the attribute. The app also shows how much of the variation lies between API lots, next to the share you'd expect from chance alone.
The dataset only publishes specification limits for dissolution, so the app says so on the page instead of showing a capability index for impurities.
Read the code behind every number
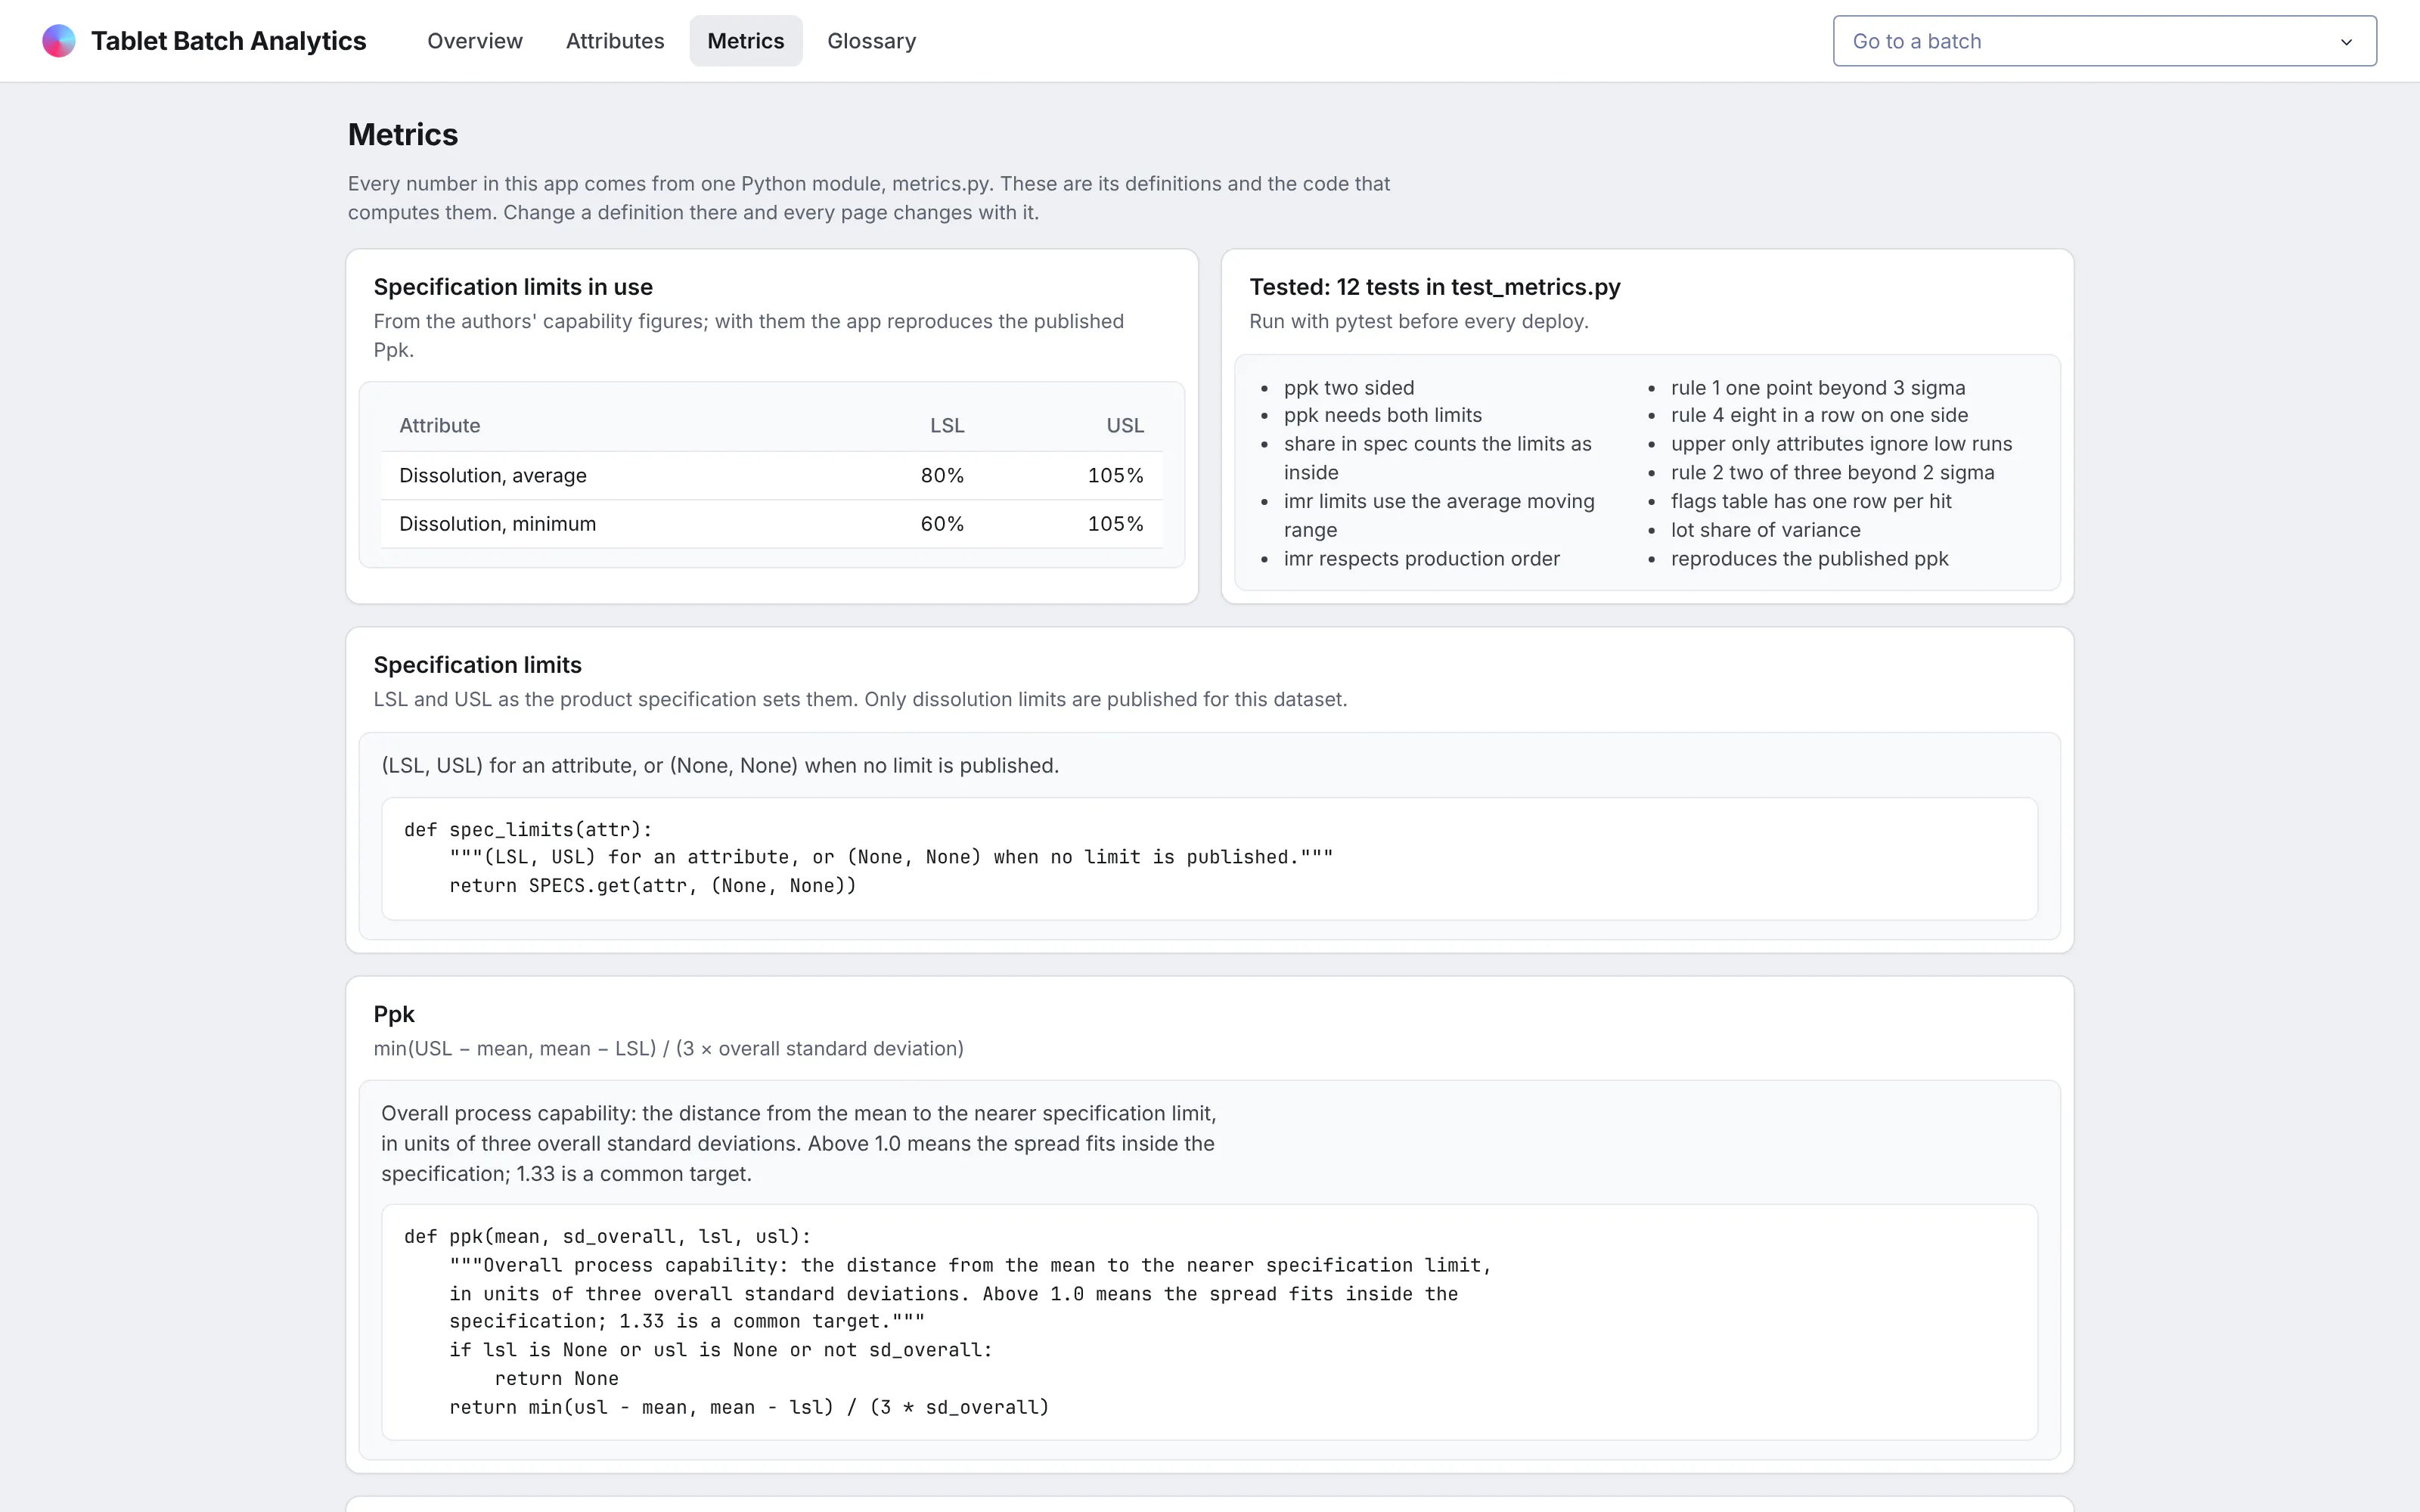
Every number in the app comes from one Python module, metrics.py, which holds the specification limits, the control limits, Ppk and Cpk, and the Western Electric rules. A page can't define its own version of a metric, so a control limit on the overview always matches the one on a batch page.
The Metrics page shows each definition with its formula, its docstring, and the code that computes it. It also lists the tests, including one that reproduces the process capability the dataset's authors published.
Look up a term without leaving the app
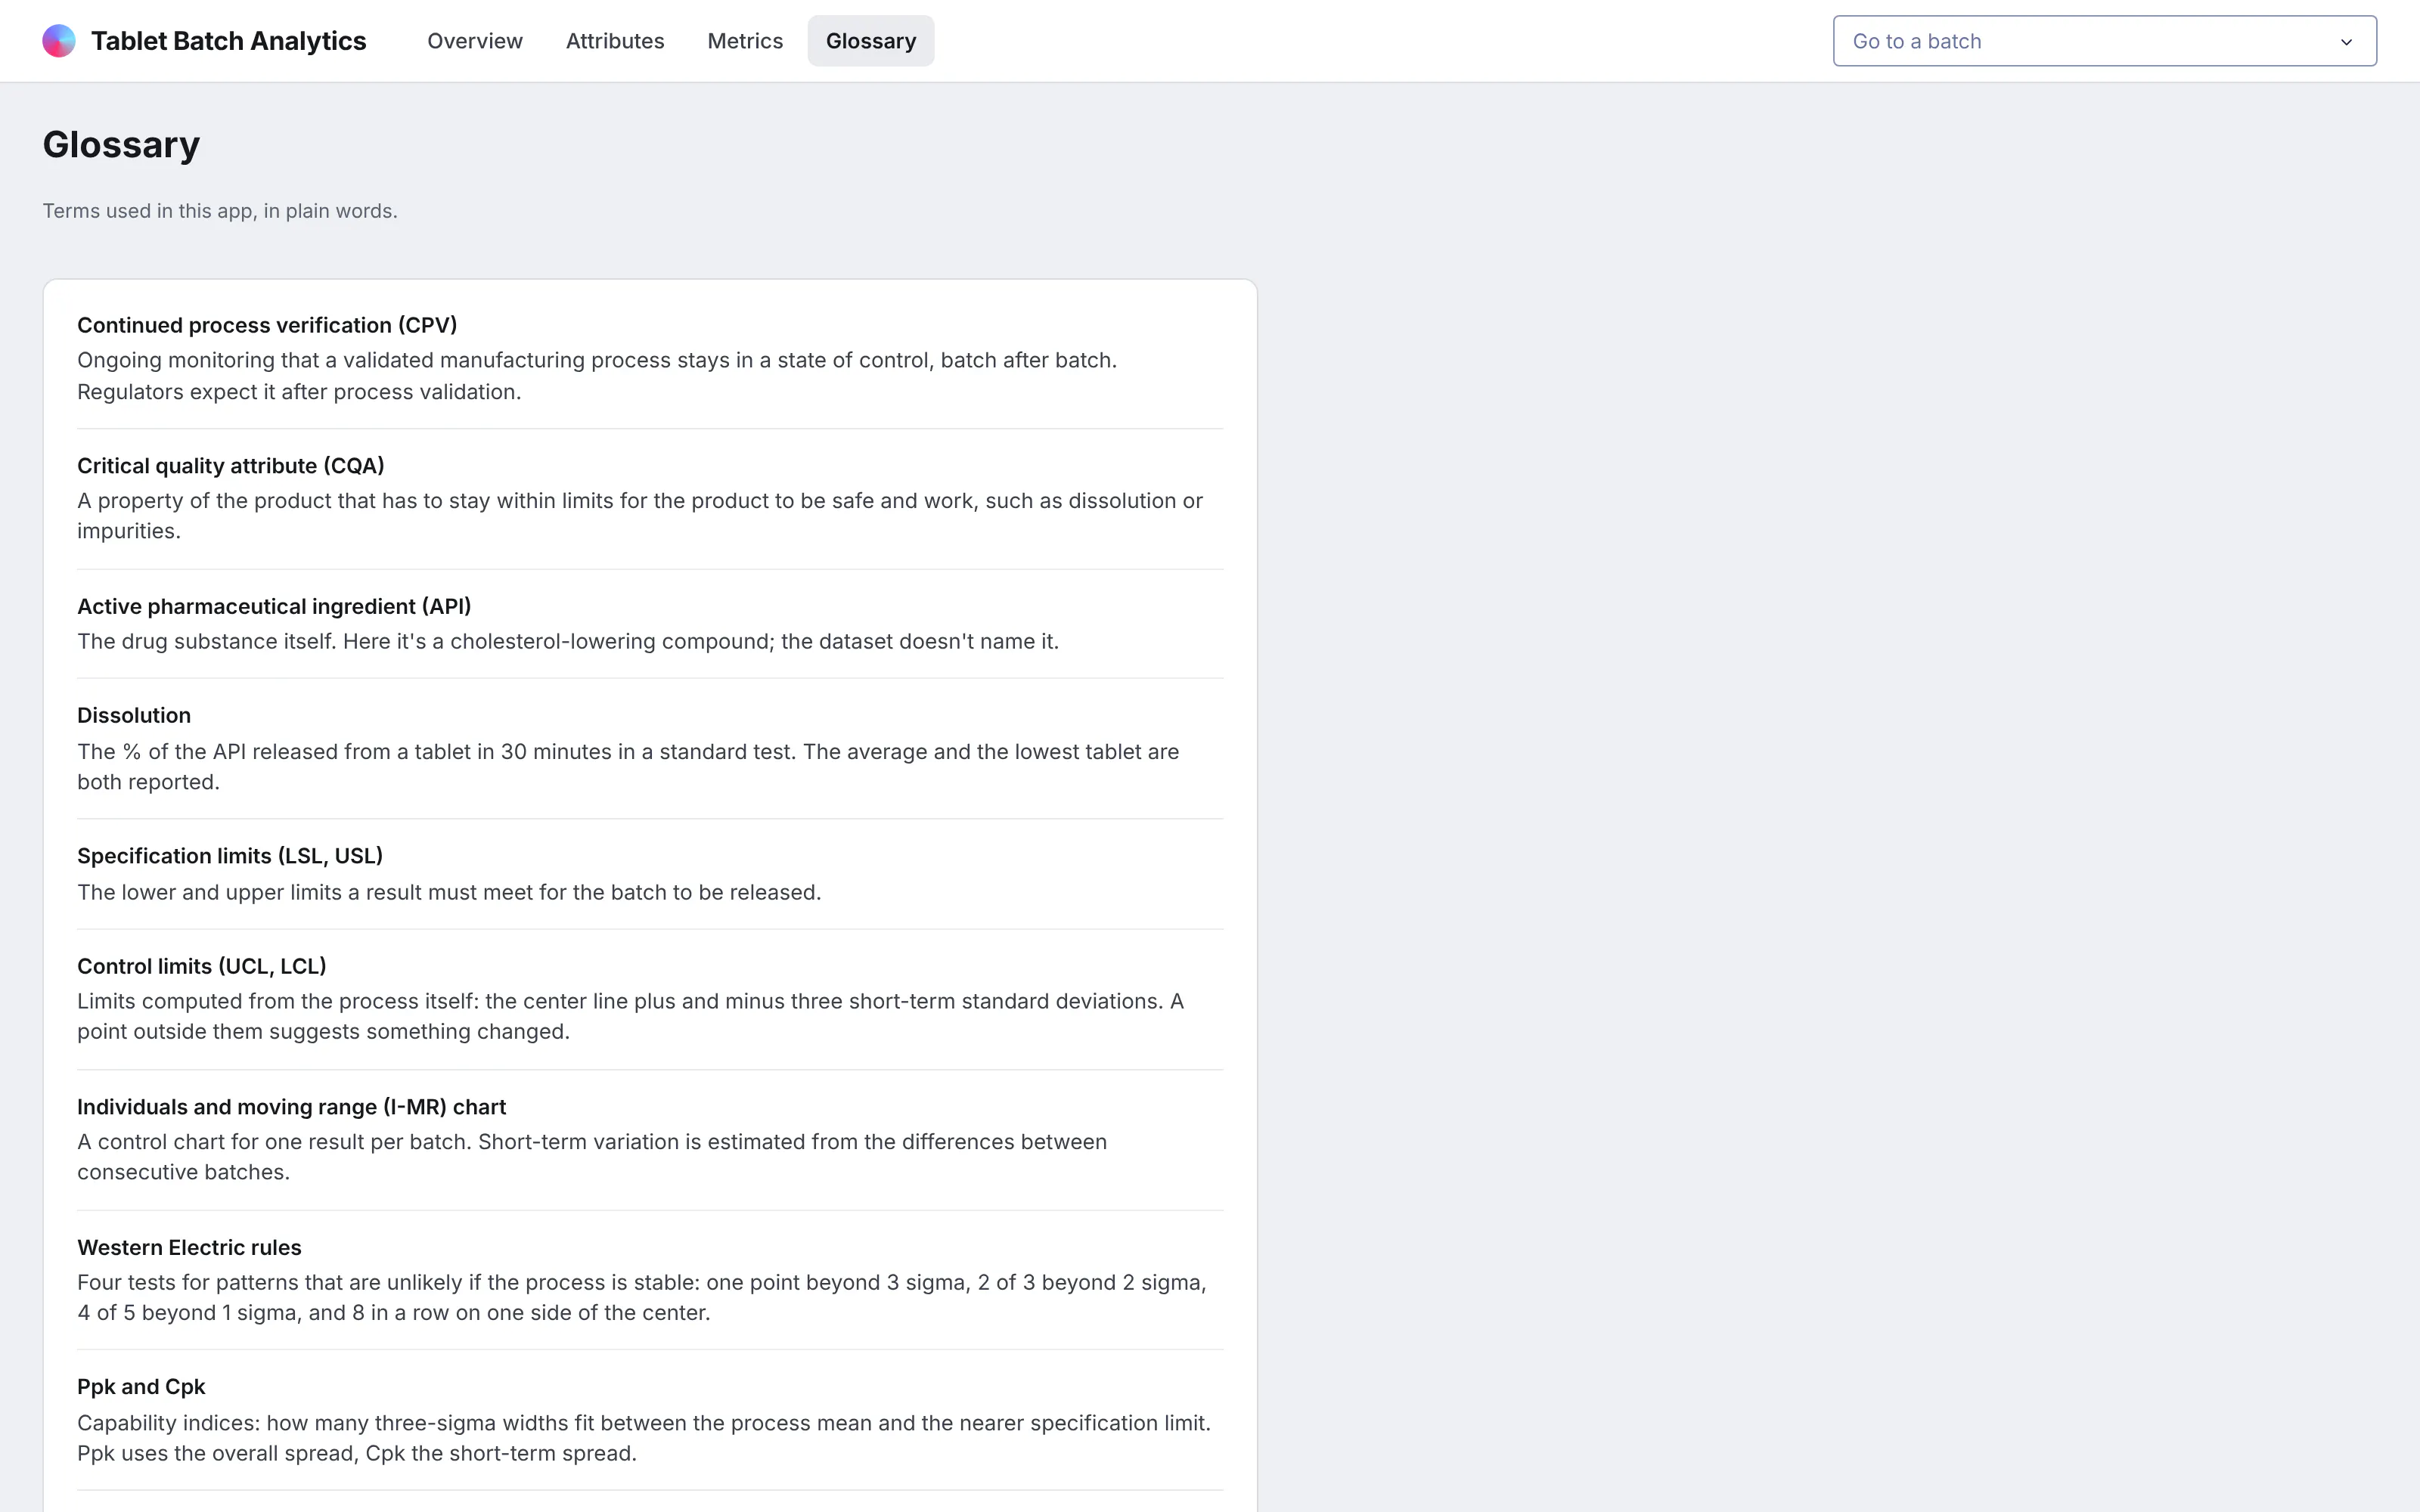
A glossary page defines every term in the app in plain words, from CPV and critical quality attributes to the individuals and moving range (I-MR) chart. It makes the app usable by regulatory or supply chain colleagues without someone having to explain it.
A glossary page is also a natural home for your semantic layer: the functions and formulas behind each metric, written out in plain words next to the code that computes them.
What else could you add?
The prompt is a starting point. These are the kinds of things teams usually ask for next, and each one is a sentence or two more in the prompt:
- Batch records from your manufacturing execution system (MES) and results from your laboratory information management system (LIMS) instead of the public files, refreshed as batches are released
- Specification limits for impurities and residual solvent from your own product specification, so every attribute gets a capability index
- Control limits saved as a fixed baseline for each attribute and reset deliberately, instead of recomputed from every batch
- A periodic CPV summary for each product, built from the same metrics.py, so the report and the app can't disagree
- A way for reviewers to record an assessment of each rule hit, with whatever audit trail and electronic signature controls your quality system requires added to the app and validated under your own procedures
- Multivariate monitoring of the 10-second tablet press data, such as principal component analysis (PCA) across batches
How is this different from Spotfire and other BI tools?
If you're comparing Spotfire alternatives or other BI tools, the main differences come down to five things:
- With AI, apps like this can be built quickly and cheaply by anyone, including the process engineers and scientists who know the data best.
- The apps are backed by code, which you can version control, manage, and update more easily than a fleet of point-and-click dashboards, especially when AI is making the changes.
- The apps can go much further than a traditional BI tool, with multiple pages, write-back to databases, custom simulations, AI chart building inside the app, MCP endpoints, and more.
- You have full control over the app: the look and feel, the controls, filters, and buttons, and every computation. You aren't fighting a tool to get what you want.
- The apps can connect to several data sources at once, and to the other systems your team already uses.
How long did it take to build?
About 20 minutes of agent time. Claude Code (with Claude Opus 5.5) downloaded the public data, checked it, wrote the metrics and their tests, built the app, ran it, took screenshots, and fixed what looked wrong in them, all from one prompt. It started from the design kit we made for an earlier app in this series, a CSS file and a few Python helpers, so the cards and tables already looked the way we wanted.
Before building on the data, it found and fixed batches whose timestamps had the day and month swapped, and it checked that the app's process capability matches the figures the dataset's authors published.
The prompt
Paste this into Claude Code, Codex, Copilot, Cursor, or another coding agent, in an empty folder. Swap in your own data source and the features you need.
Build a Dash app for continued process verification (CPV) of a tablet product, on the open dataset "Big data collection in pharmaceutical manufacturing" (Zagar and Mihelic, figshare, CC BY 4.0). Use DuckDB for every query.
Data
- Download Process.csv, Laboratory.csv and the process time series zip from figshare. Read the tablet press CSVs in one DuckDB query and write Parquet.
- Check the data before building anything: dates (some exports swap day and month), units, and reporting floors. Tell me what you found.
Metrics (the semantic layer)
- Put every metric in metrics.py with docstrings: dissolution specification limits from the paper, I-MR control limits, Ppk and Cpk, the Western Electric rules as DuckDB window functions, and the share of variance between API lots.
- Write pytest tests in test_metrics.py, including one that reproduces the Ppk the paper publishes. Run them.
Pages (each with its own URL, and the back button must work)
- Overview: KPI cards compared with the previous 12 months, a control chart with rule hits (click a point to open the batch), a Pareto of rule hits, a table of every batch, and a parallel coordinates plot of press settings.
- /batch/<id>: tablet press traces, genealogy (material lots and their incoming tests), and strip plots against all batches.
- /attribute/<name>: control chart, capability histogram, a "what moves with it" correlation plot, and a monthly trend.
- /metrics: each definition with its code from metrics.py and the list of tests.
- A glossary page.
Design
- A light gray page with white cards. Each card has a title and a one-sentence description, with the chart or table inset in a slightly tinted panel. Dense tables. Inter everywhere. No chart toolbars.
Run it, screenshot every page at 1600x1000, and fix anything that overflows, looks empty or doesn't match the numbers before you stop.
How do I run it on Dash Enterprise or Plotly Cloud?
Dash Enterprise runs Dash apps inside your own infrastructure, behind your firewall and even air-gapped, with single sign-on and access control for each app. For manufacturing data that's usually where it has to live.
This app needs nothing special. It's a Dash app with a requirements.txt, and your coding agent can deploy it through the Dash Enterprise or Plotly Cloud command line.
Keep the Parquet files on a persistent filesystem so the app doesn't rebuild them after a restart. Point the app at it with an environment variable such as DATA_DIR=/data.
Run the tests before every deploy, so a change to a metric can't reach users without passing them.
If you'd rather not run any infrastructure, Plotly Cloud hosts the same app for you. We tested this one there.
Tips and tricks
These are things we like doing when we build apps like this one.
- Put every metric in one module. Plain Python functions like the ones in metrics.py can become your semantic layer without another product to buy, and the agent keeps them consistent because there's only one place to change.
- Show the code in the app. A Metrics page built with Python's inspect.getsource answers "how is this computed?" without anyone opening a repository.
- Test against a published number. Reproducing the authors' process capability told us the specification limits and the calculation were right.
- Ask the agent what it found in the data. It found the swapped dates and the impurity reporting floor on its own because the prompt asked it to check first.
- Give batches and lots their own pages. Genealogy is much easier to follow when every lot links to the batches made from it.
- Show the chance level next to a statistic. A share of variance between lots means little until you see what chance alone would give with the same number of lots and batches.
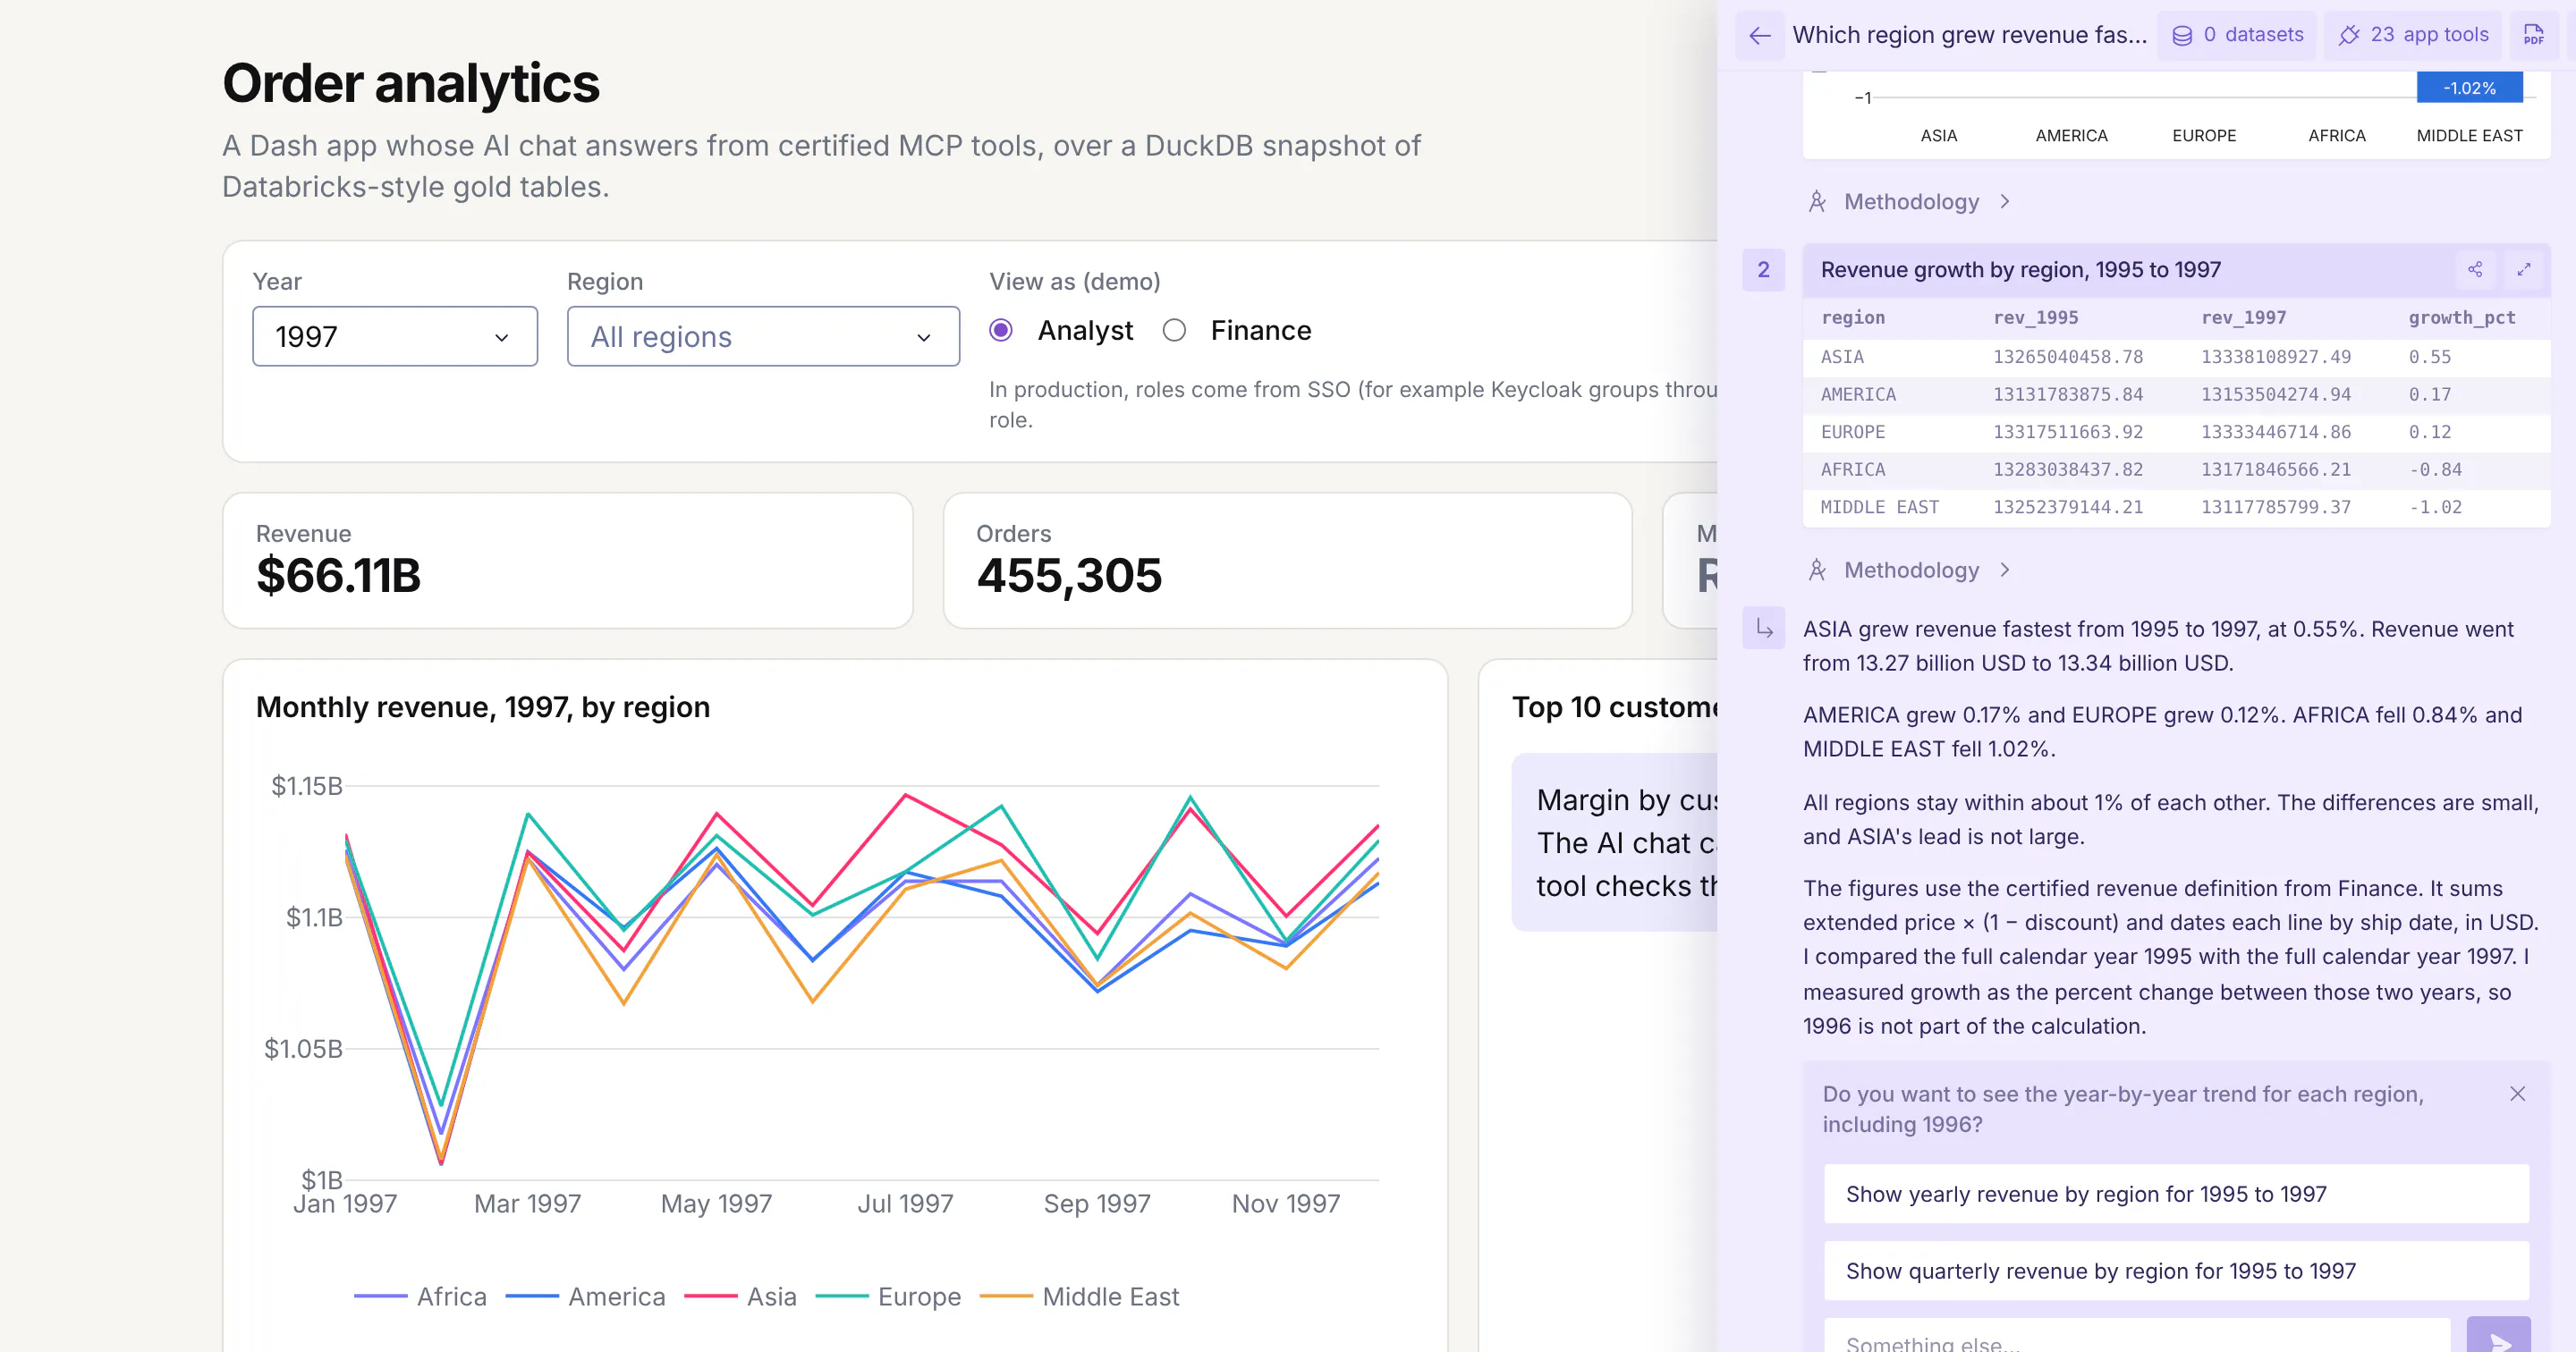
- Wrap your Python functions in @mcp_enabled. Turn on enable_mcp=True in the Dash(...) call and mark the functions with @mcp_enabled, and chat agents like Claude, ChatGPT, or Copilot can call them over MCP and get the same numbers the app's pages show.
- Switch on Plotly Studio Embedded. The same tools power Plotly Studio Embedded, an AI chat inside the app that answers questions with charts and tables built from your functions. It's available now on Plotly Cloud (in beta) and is planned for Dash Enterprise in Q4 2026.
FAQ
See what Dash Enterprise and Plotly Cloud can do for your team
Our customers in pharma, energy, finance, and manufacturing are building apps like this one with coding agents and running them on Dash Enterprise behind their firewall or on Plotly Cloud. Request a demo and we'll show you how it works for your team.