
Chris Parmer
November 20, 2026
Maintenance work order and asset management app
A data app example built with Dash and an AI coding agent in 30 minutes
TL;DR
- Building data apps with AI coding agents in Python and managing them on Dash Enterprise or Plotly Cloud is the modern alternative to BI. At Plotly, many of our customers are migrating away from point-and-click tools like Spotfire, Tableau, and Power BI toward code-backed tools powered by AI. This example showcases the types of apps that you can create.
- This app covers maintenance operations: the work order backlog, how fast work gets done, which equipment keeps failing, and where the labor goes. It reads from a SQL database, here loaded with NYC Parks' public maintenance system records as a stand-in for your own. A coding agent built it from one prompt in about 30 minutes.
- You can go from the whole operation to a single site or asset by clicking, and every page has its own link you can send to a colleague.
- The same metrics are exposed as MCP tools, so an AI agent such as Claude, ChatGPT, or Copilot can ask the app about the backlog and get the numbers the pages show.
- The full prompt is below, so you can build the same kind of app on your own maintenance system and run it on Dash Enterprise behind your firewall or have it hosted for you on Plotly Cloud.
Walkthrough
Maintenance managers, planners, and reliability engineers ask the same questions every week: is the backlog growing, what's oldest, which assets keep breaking, and where the crews' hours go. This app answers each one on its own page, with the work order system's own records underneath.
The data here comes from NYC Parks' Asset Management Parks System (AMPS), which the city publishes on NYC Open Data. It has the same shape as most computerized maintenance management systems (CMMS): work orders, labor bookings, and an asset register, so the app works the same way on your own.
See whether work is keeping up
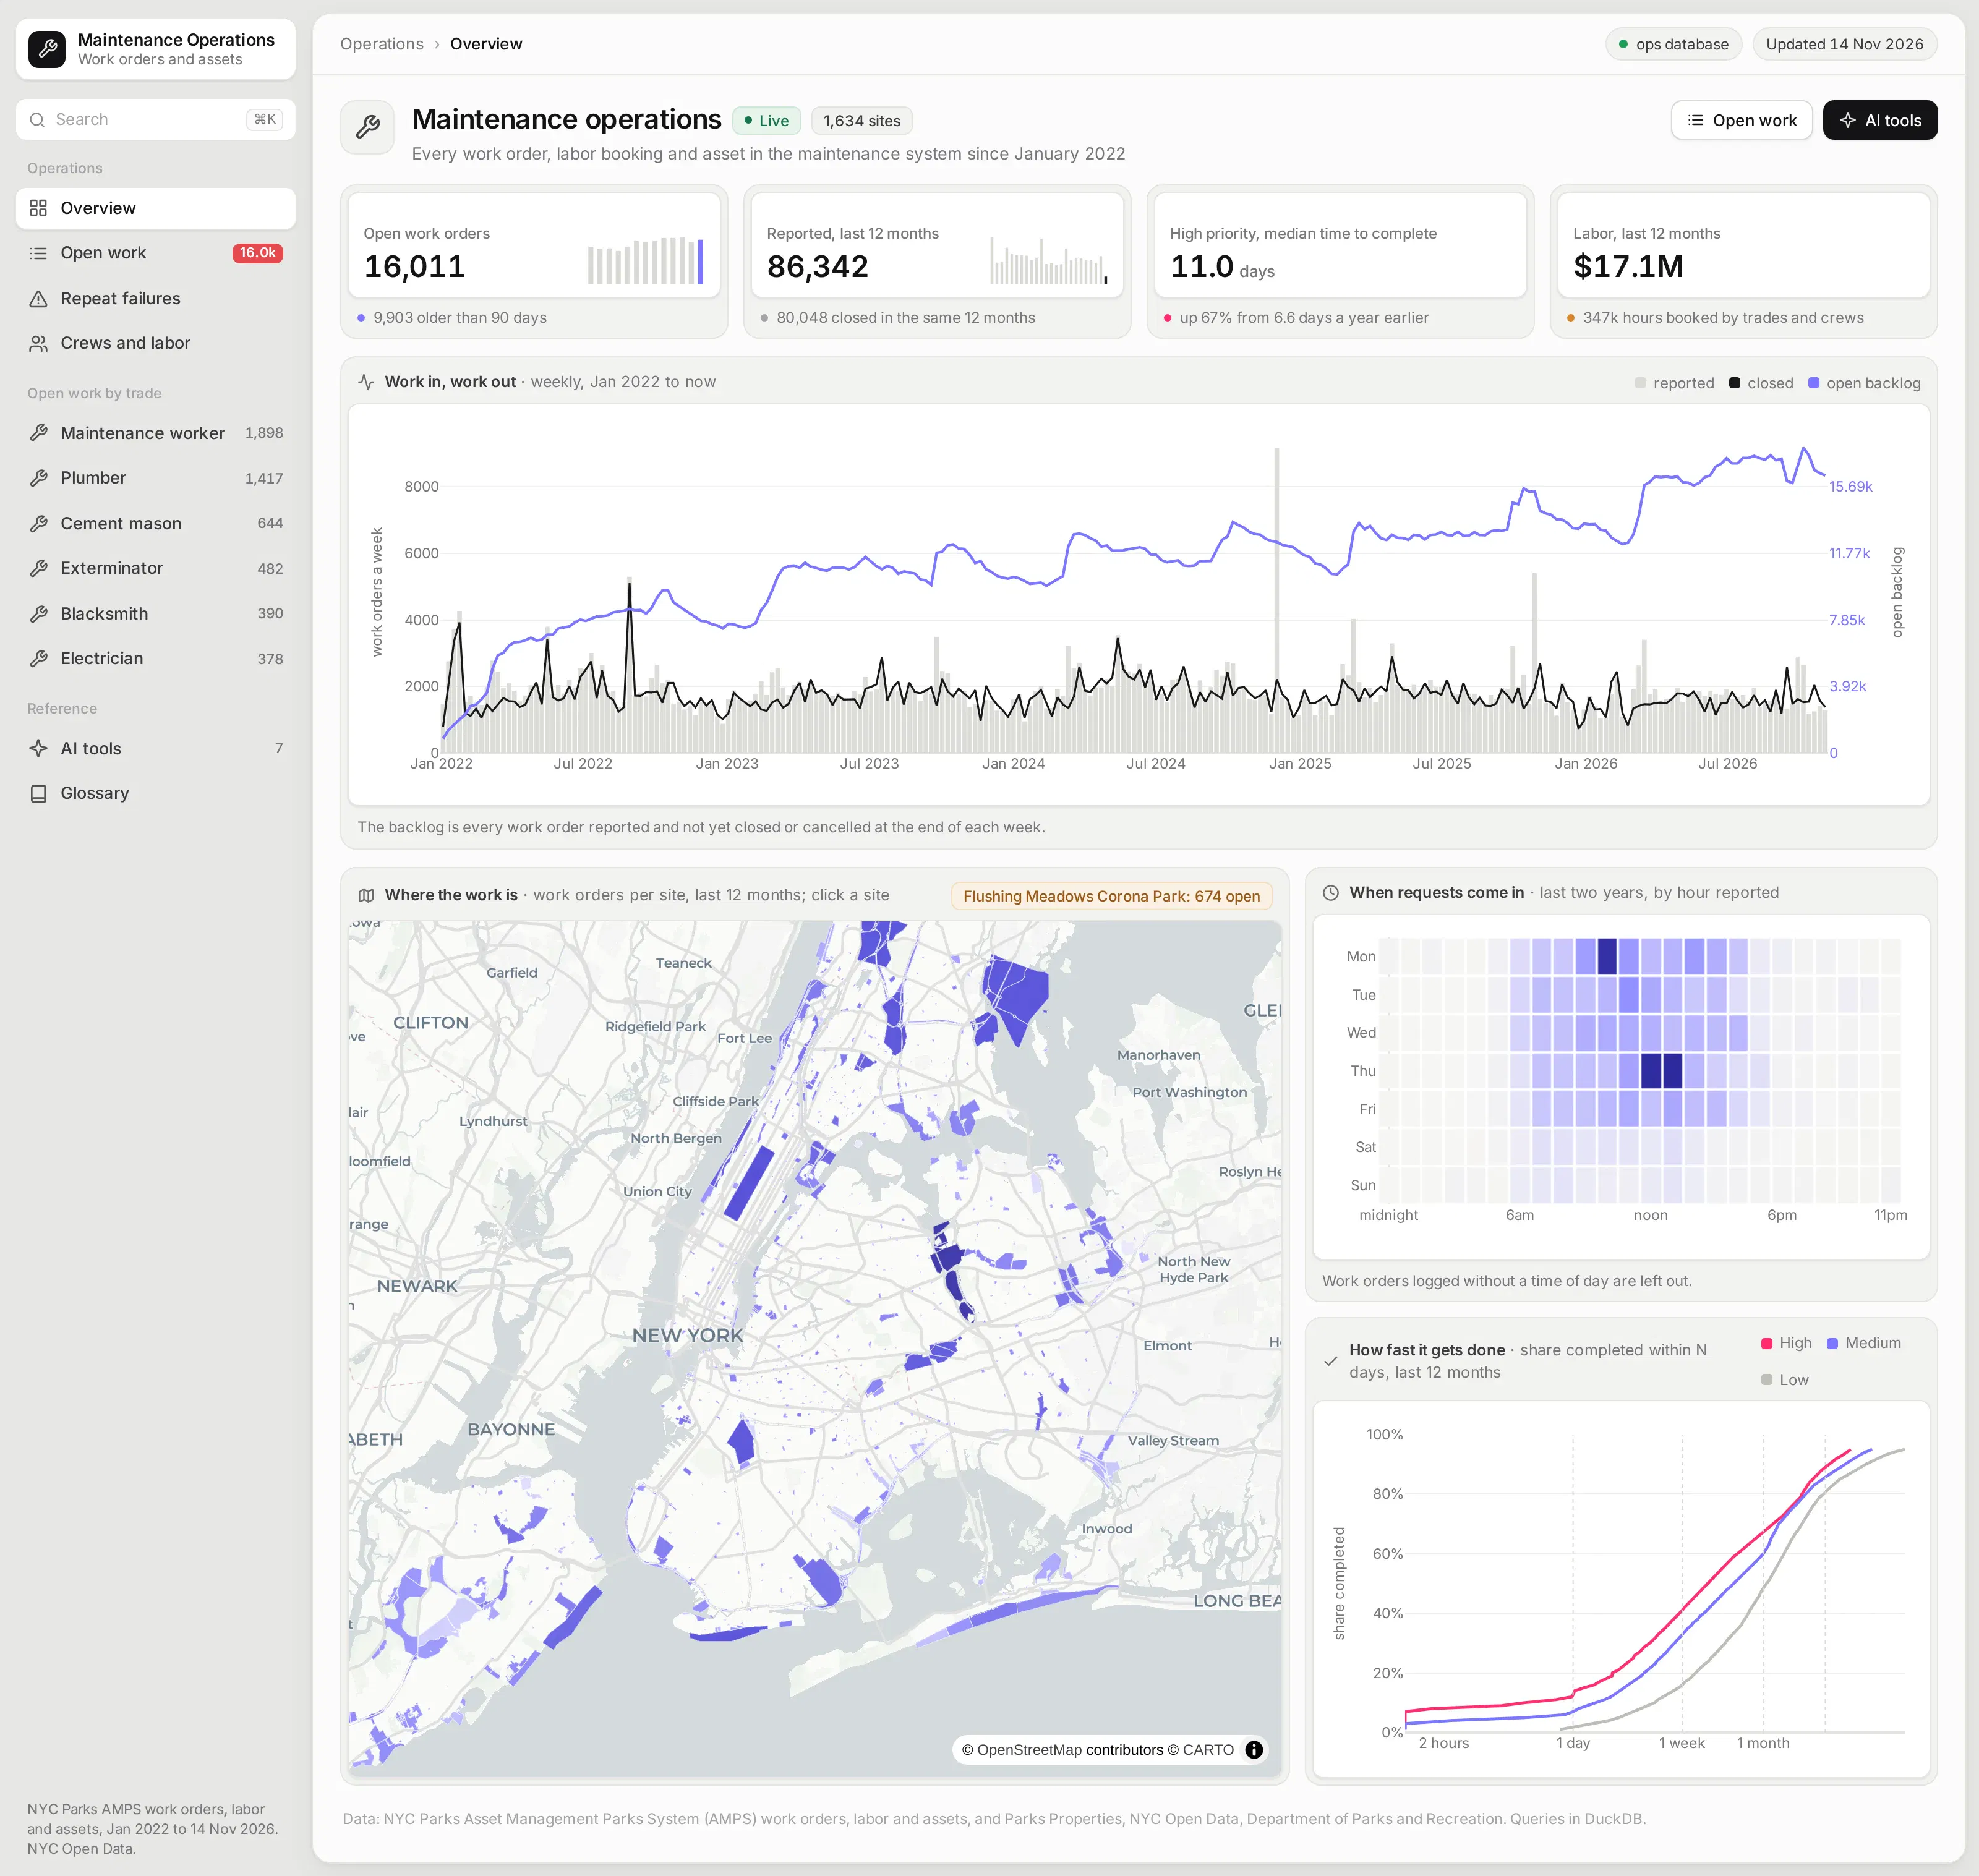
The overview starts with the four numbers a maintenance manager watches: open work, work coming in, how fast high-priority work gets done, and labor cost. Each one has a small trend line, and the high-priority time is compared with the year before.
Below them, a weekly chart puts work reported next to work closed, with the open backlog on a second axis. When the closed line sits under the reported line week after week, the backlog line shows it climbing.
A map shades every site by its work orders, and clicking a site opens its own page with its work by month and busiest assets. Completion curves show what share of high, medium, and low priority work is done within a day, a week, or a month.
Work through the open backlog
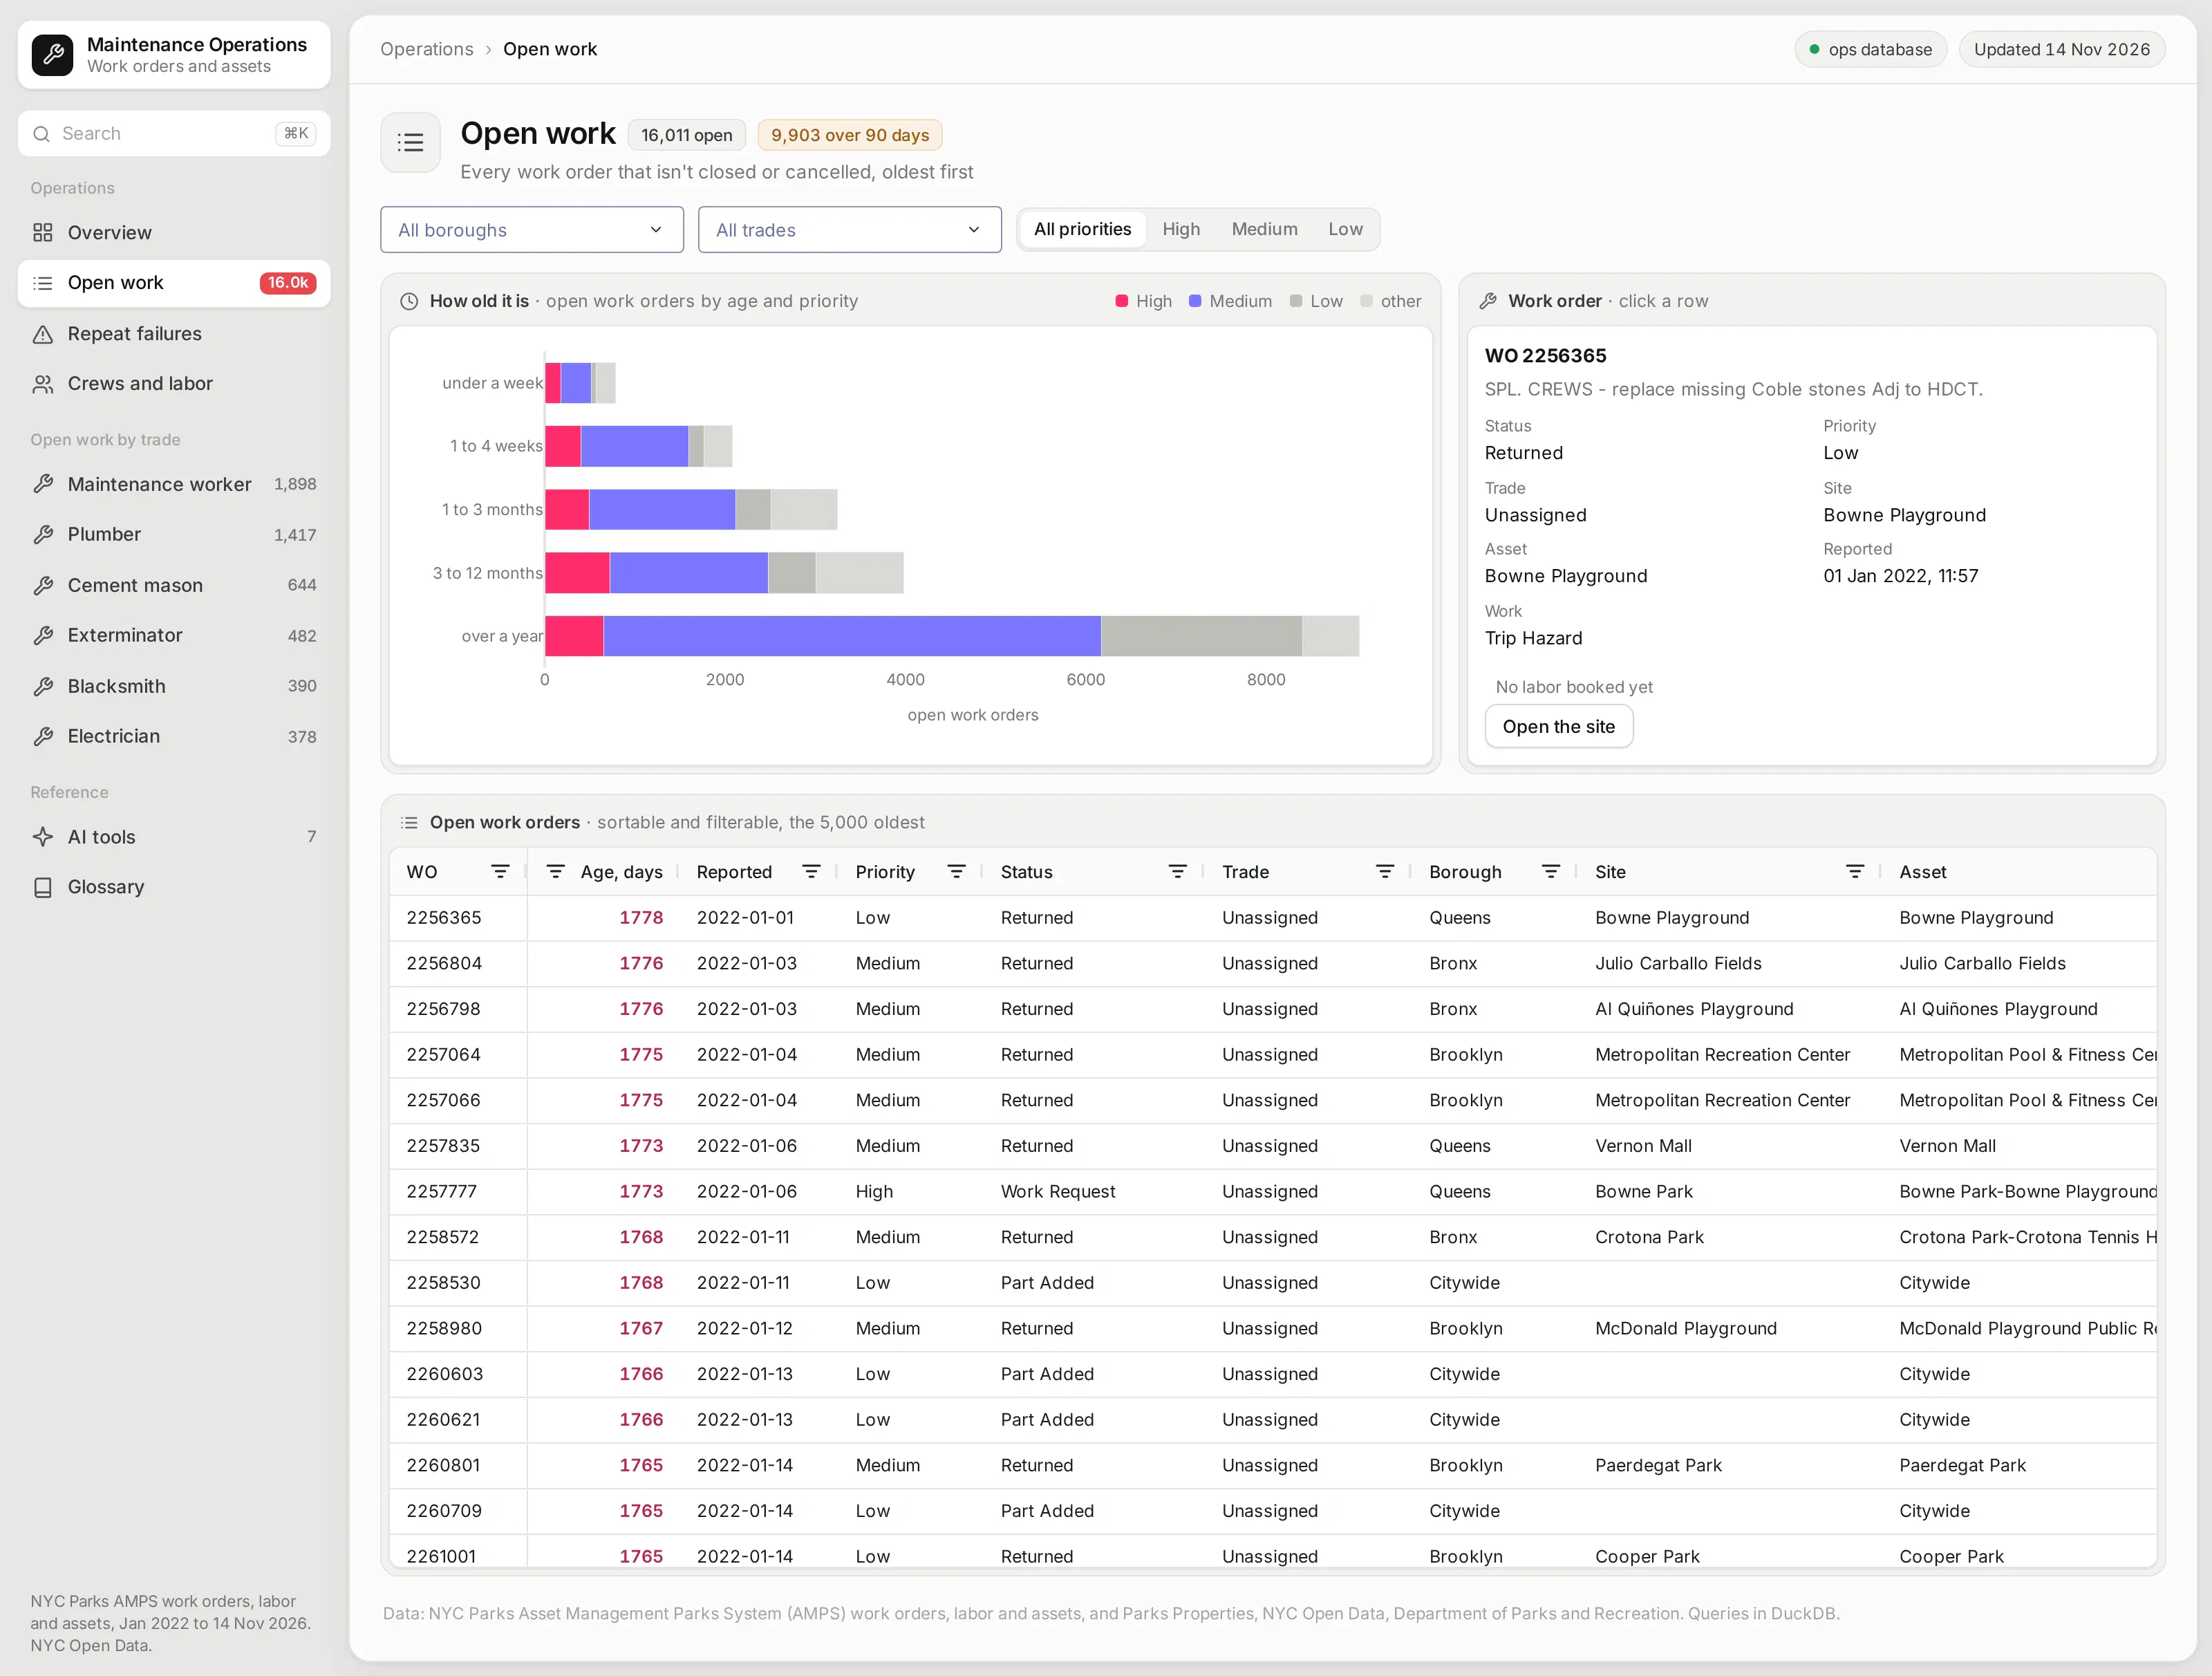
The open work page lists every work order that isn't closed or cancelled, oldest first, with its age, priority, status, trade, site, and asset. You can filter by borough, trade, and priority, and the aging chart above the table updates with the filters.
Clicking a row shows the work order's details and every labor booking against it, with a link to its site. It's the page a planner would use to pick what to schedule next.
Find the equipment that keeps failing
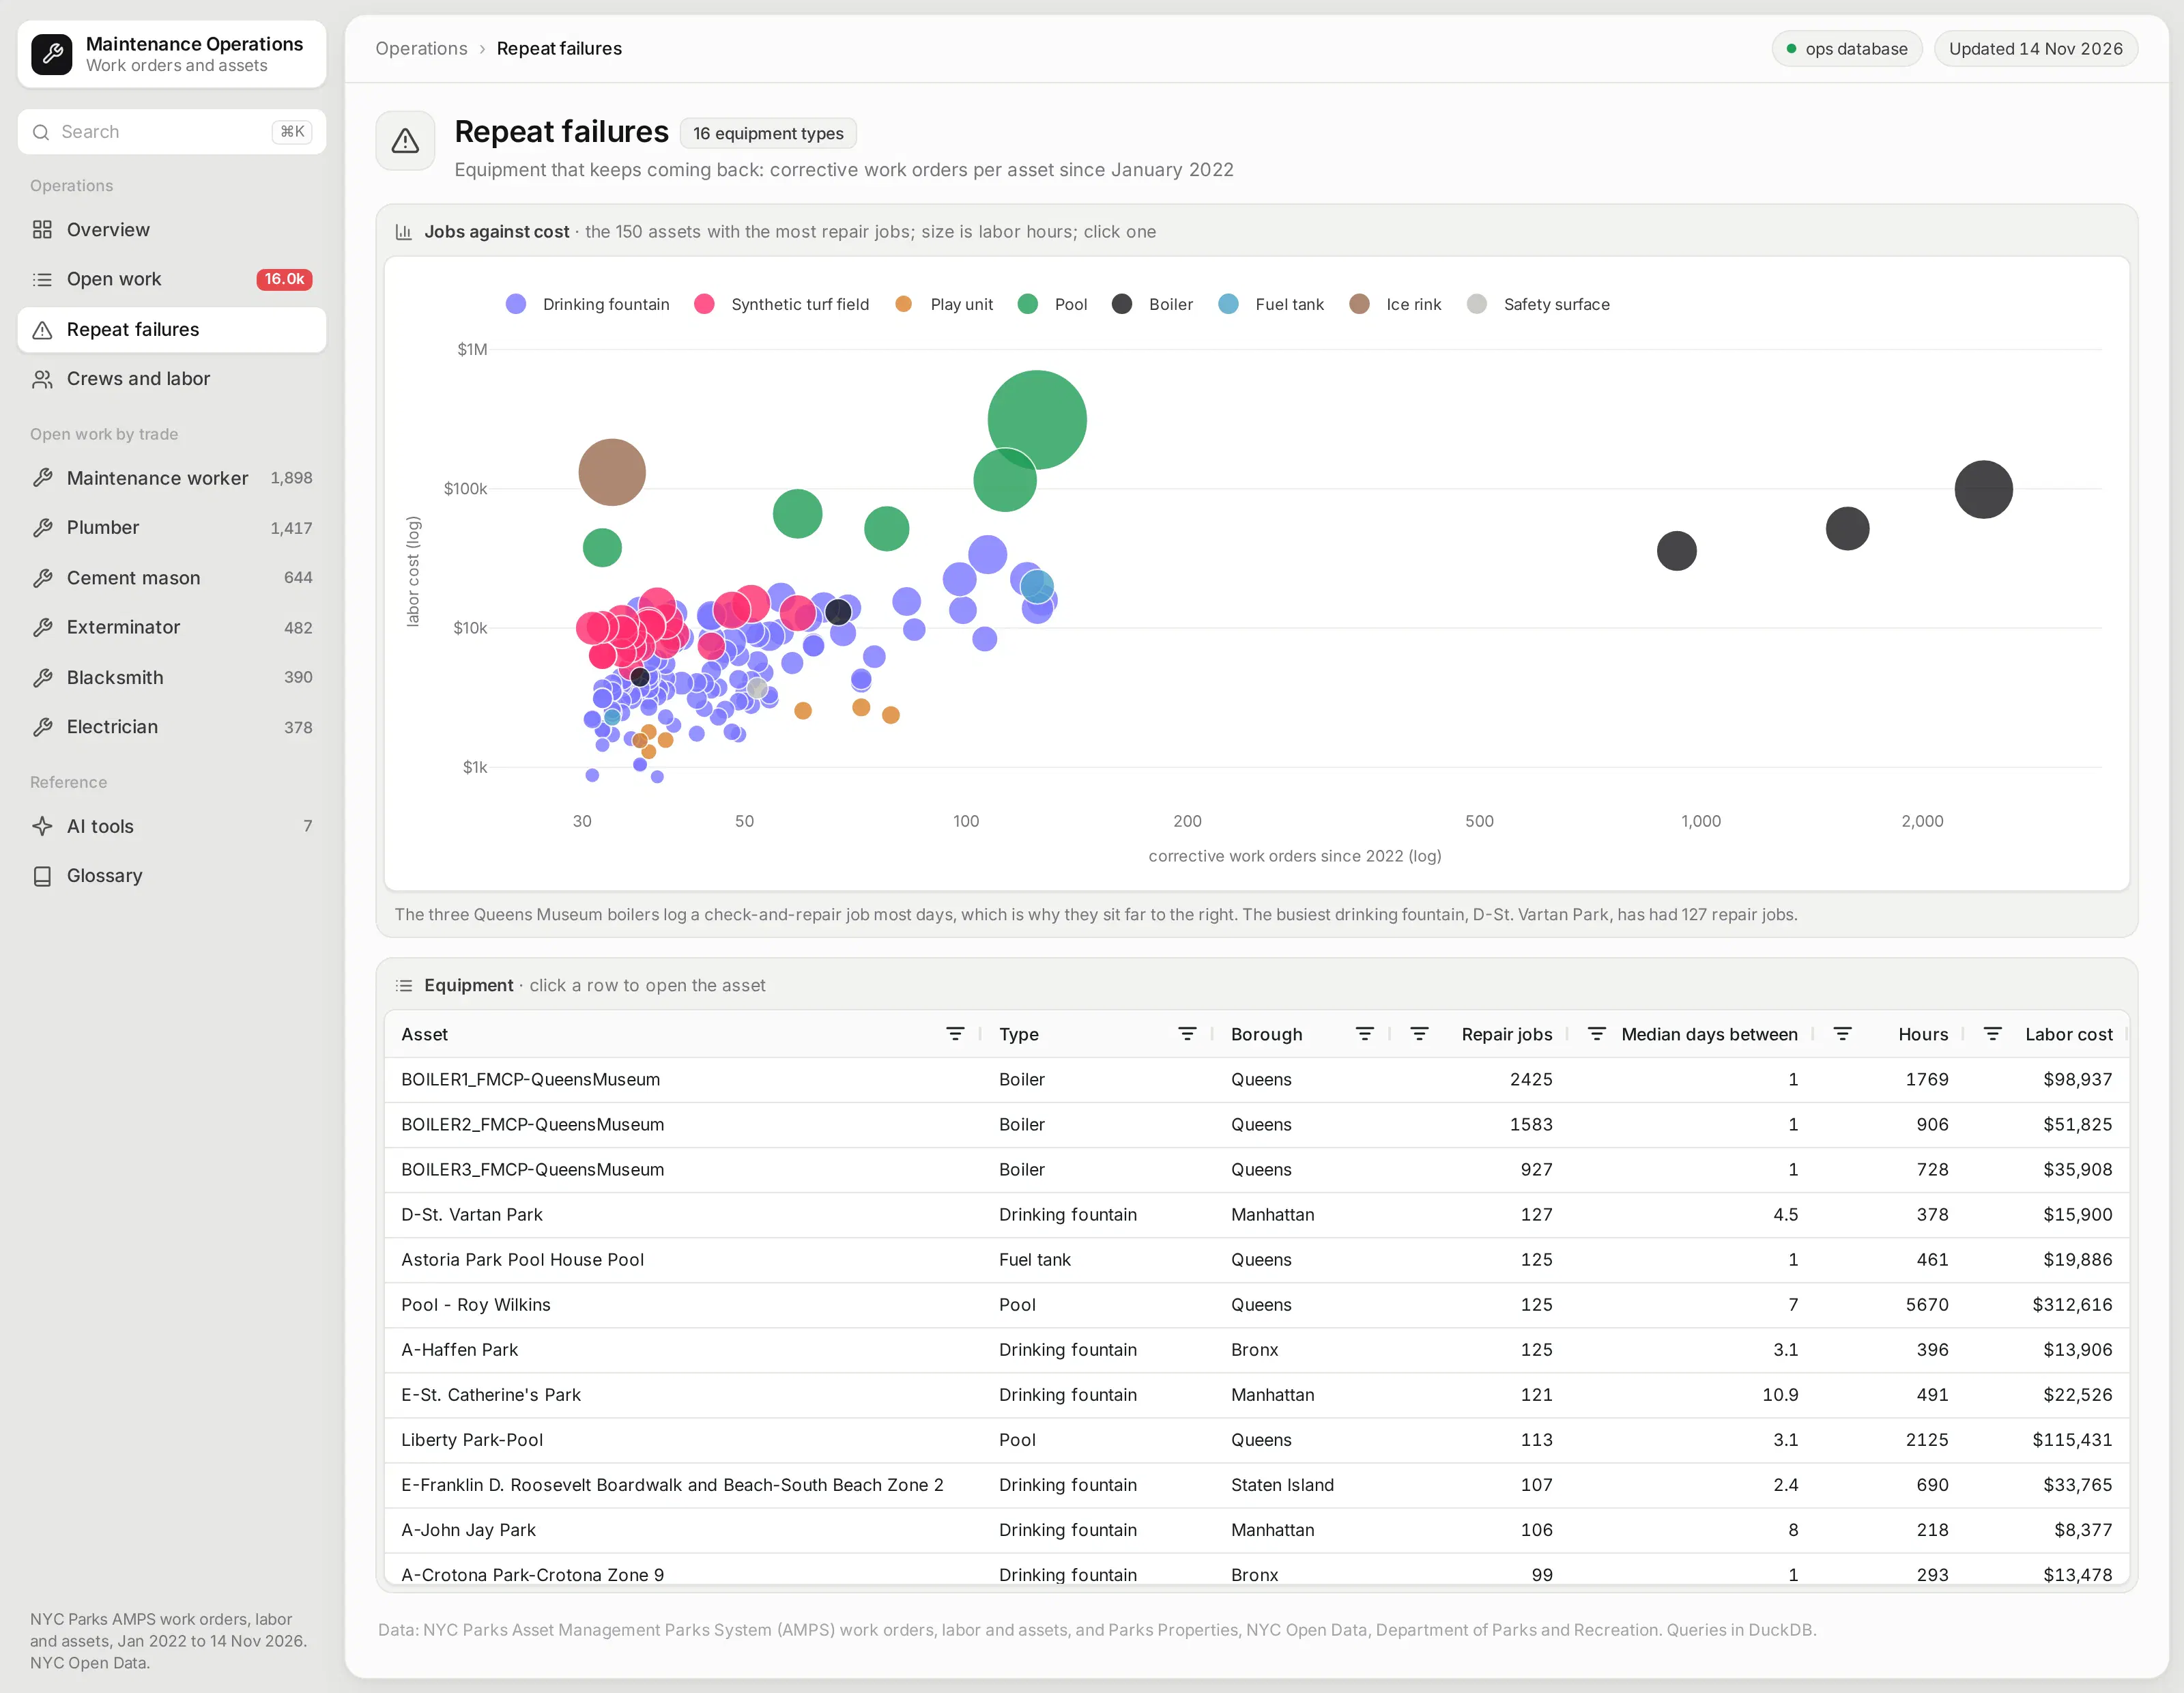
Repeat failures are where reliability work pays off, so this page plots every piece of equipment by its repair jobs against the labor they cost. Drinking fountains, play units, boilers, pools, and turf fields each get their own color.
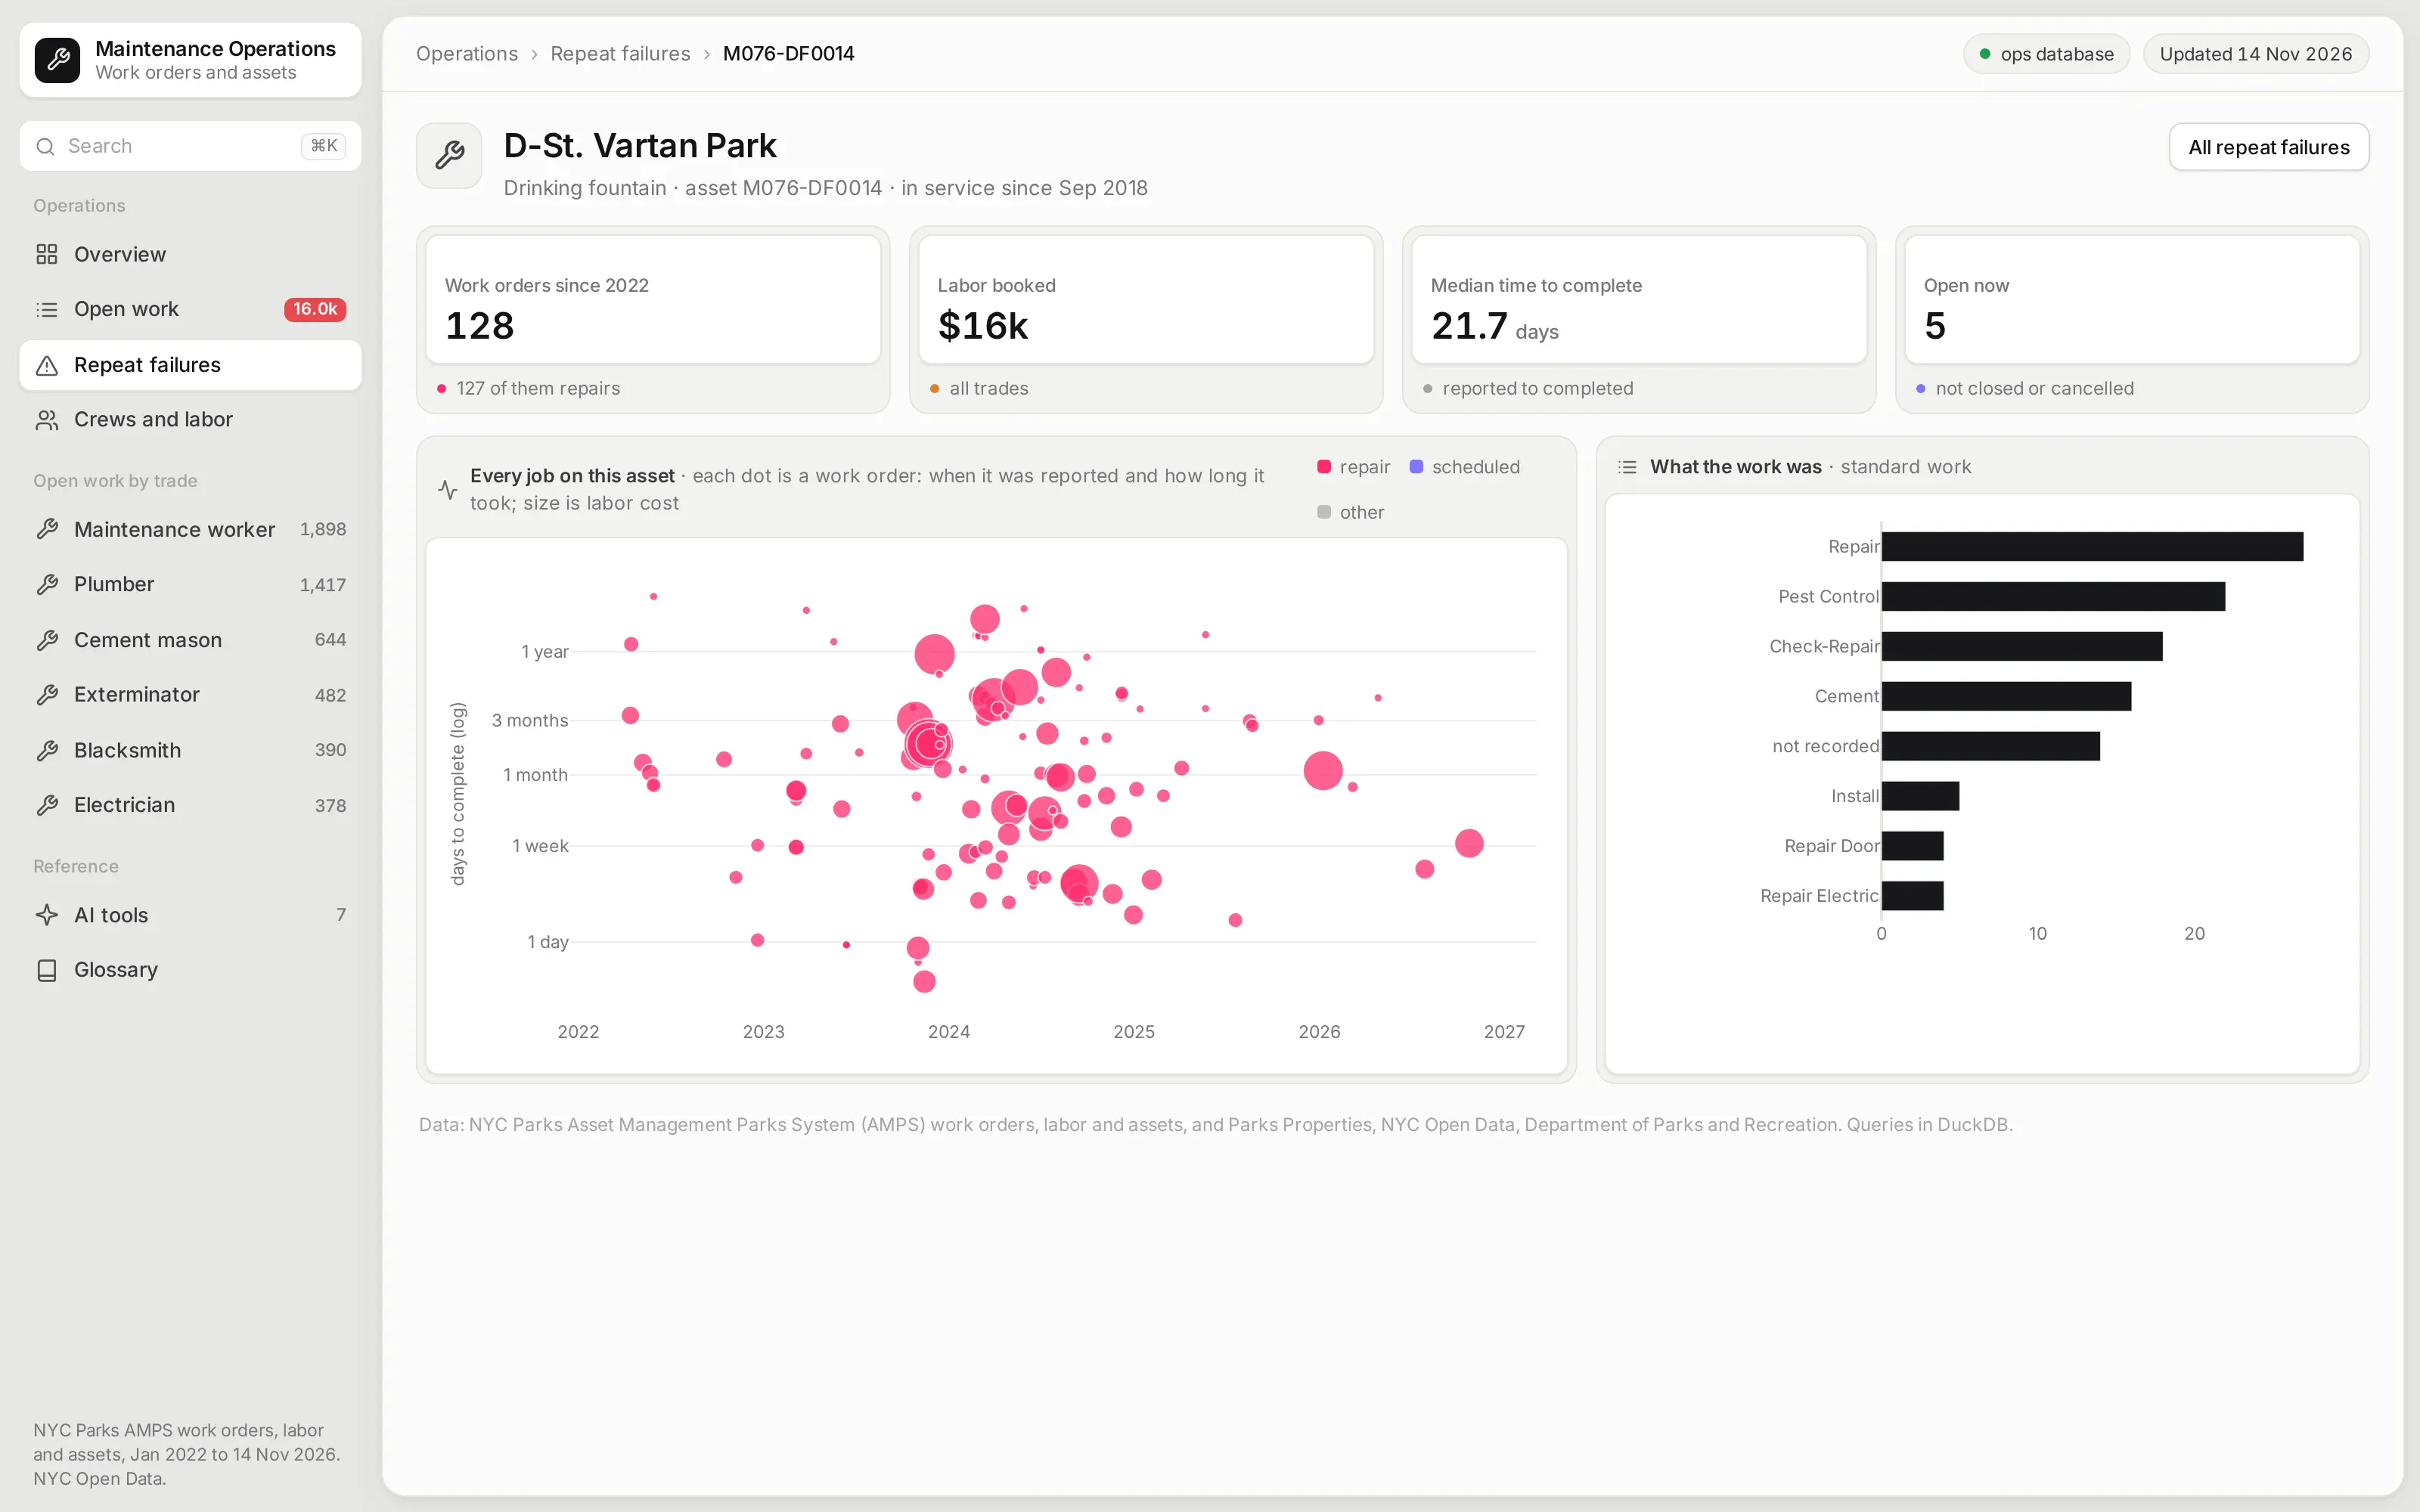
Clicking a point or a row opens that asset's page. There, each work order is a dot on a timeline, placed by when it was reported and how long it took, with the kind of work done next to it.
See where the crews' hours go
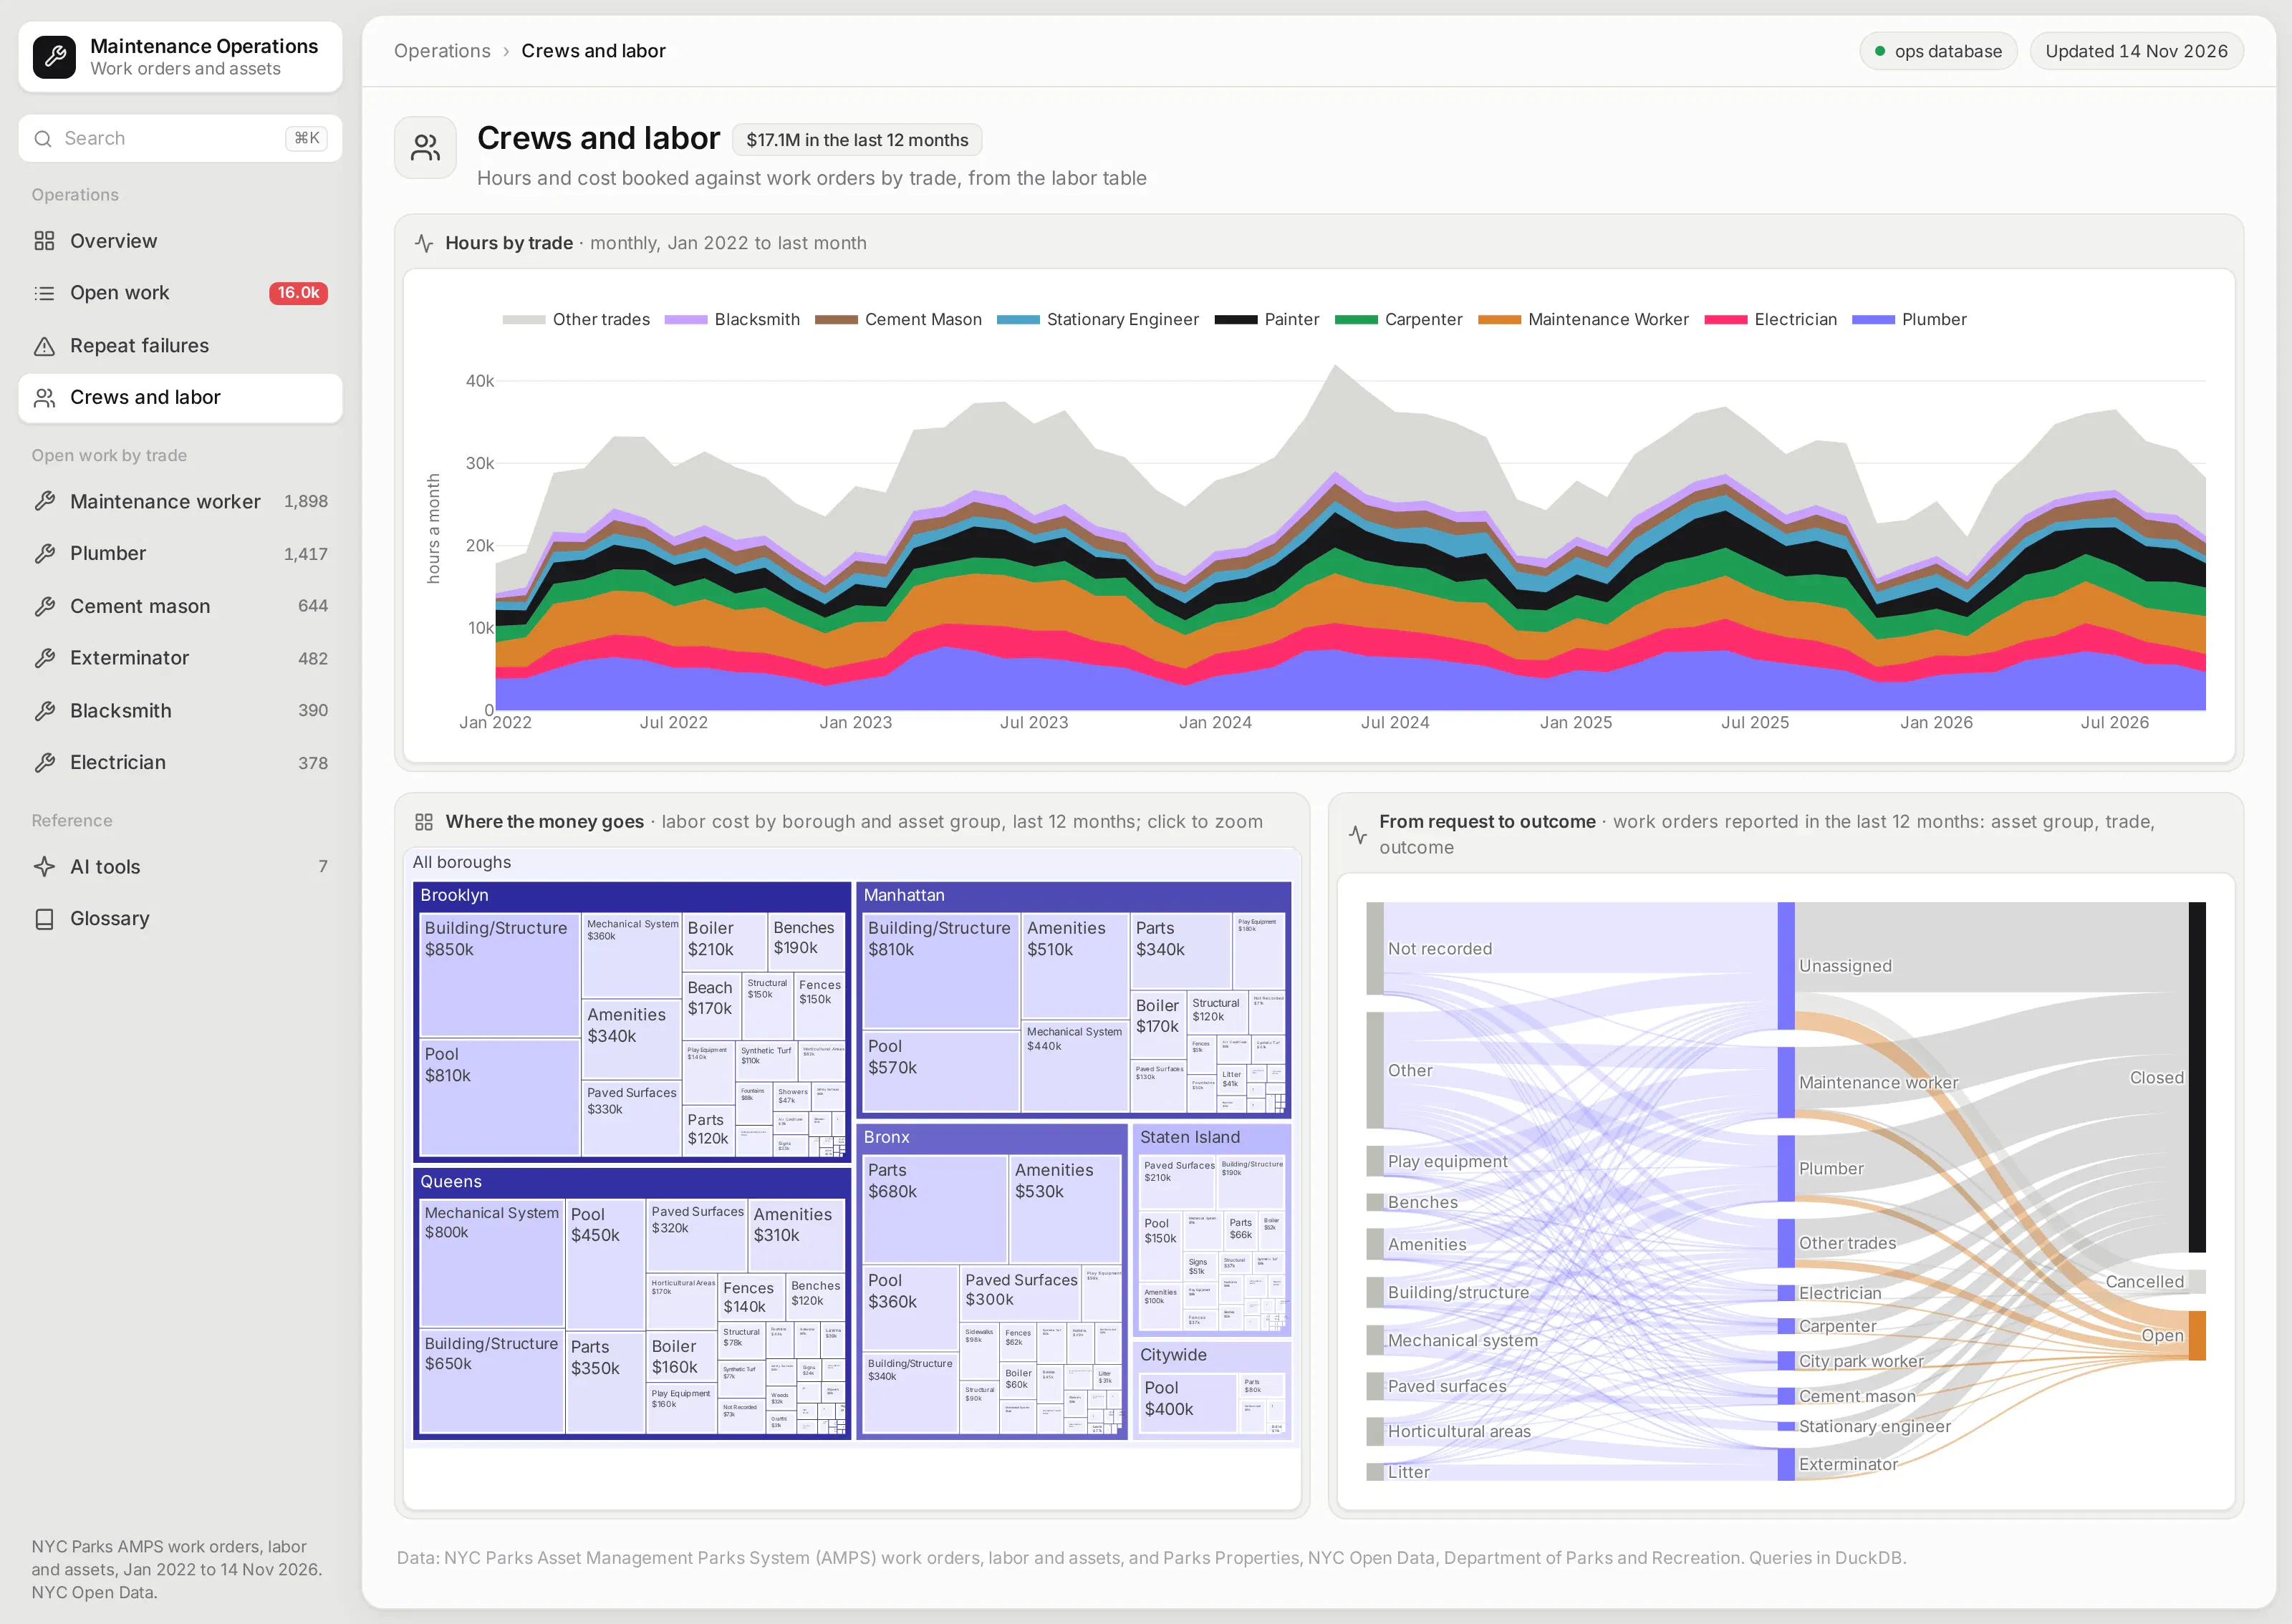
The crews page shows labor hours by trade over time, which makes seasonal peaks and staffing changes easy to see. A treemap breaks the last year's labor cost down by borough and asset group, and you can click into it.
A Sankey diagram follows a year of work orders from the kind of asset, to the trade that took them, to whether they closed, stayed open, or were cancelled. It shows at a glance which trades are carrying the open work.
Ask the app from an AI agent
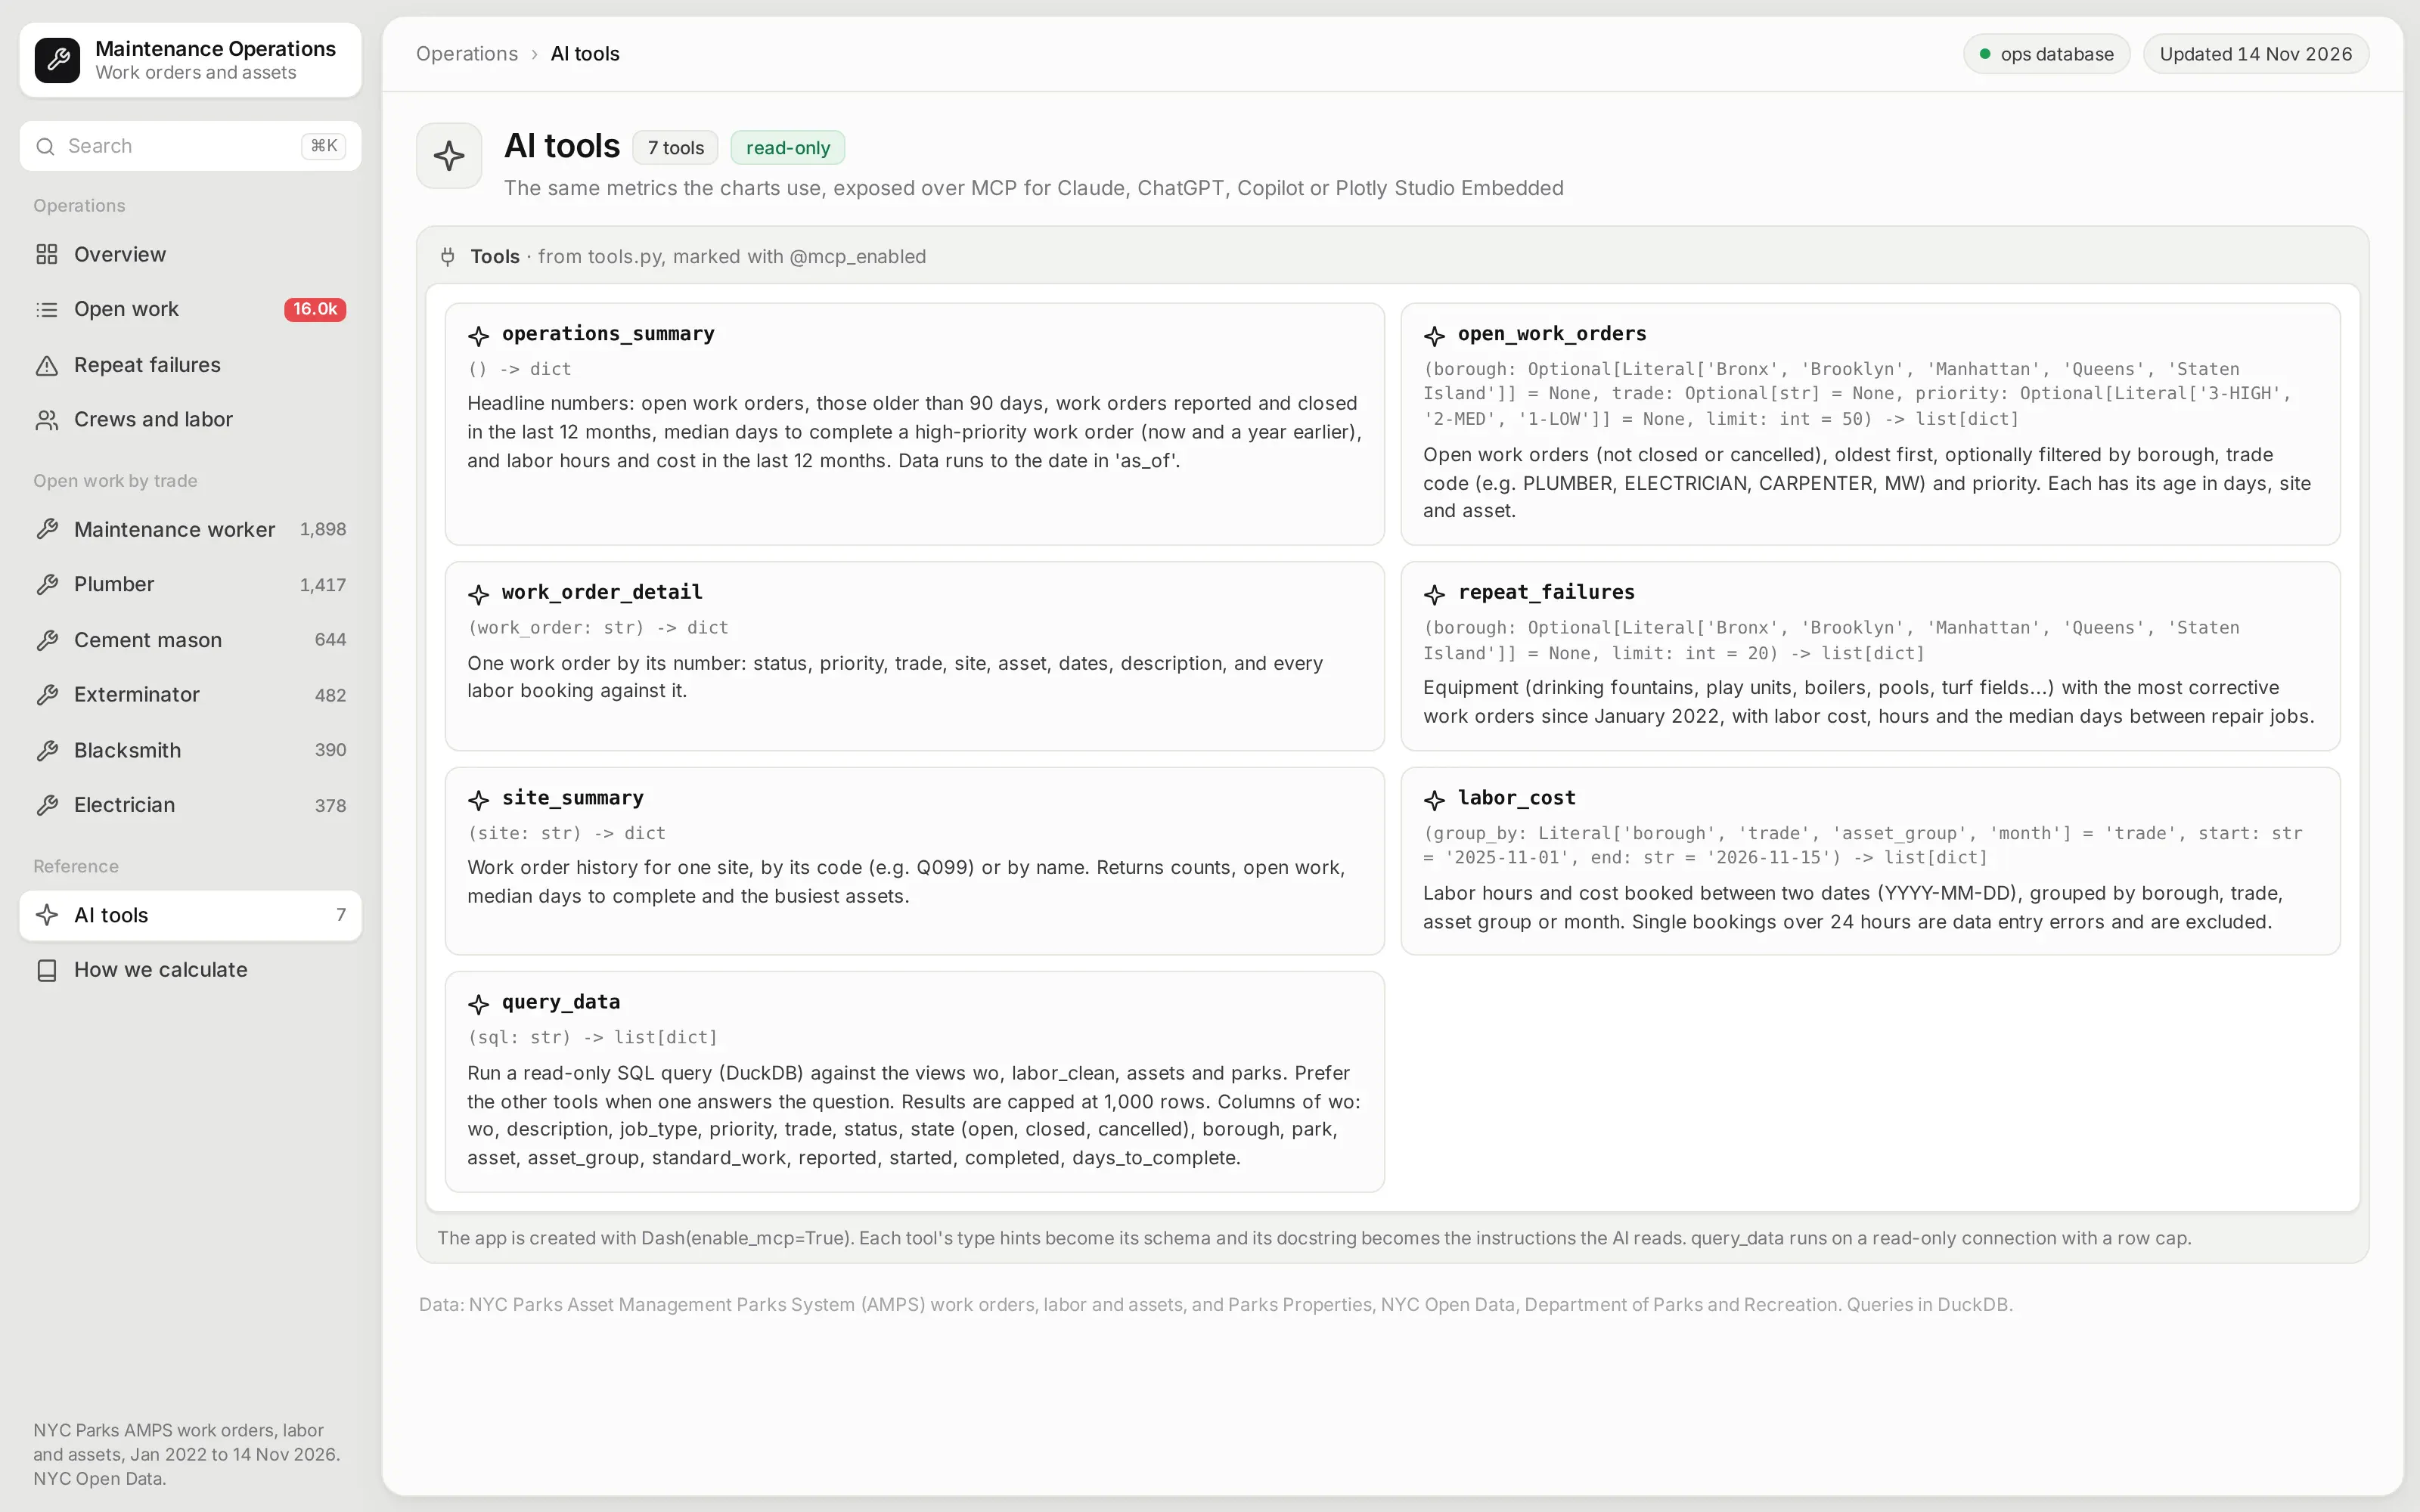
The app is also an MCP server. Seven of its Python functions are marked with @mcp_enabled, so an AI agent connected to the app can ask for the backlog in a borough, a site's history, or the equipment with the most repairs, and get the same numbers the pages show.
Each tool's type hints become its schema, and its docstring becomes the instructions the agent reads:
from dash.mcp import mcp_enabled@mcp_enabled(expose_docstring=True)def repeat_failures(borough: Optional[Borough] = None, limit: int = 20) -> list[dict]:"""Equipment (drinking fountains, play units, boilers, pools, turf fields...) with the most correctivework orders since January 2022, with labor cost, hours and the median days between repair jobs."""return _records(ops.repeat_assets(min(limit, 150), borough), limit)
For questions the tools don't cover, a query_data tool runs read-only SQL on the same views, with a row cap. Its docstring tells the agent to prefer the other tools when one fits.
Ask it inside the app with Plotly Studio Embedded
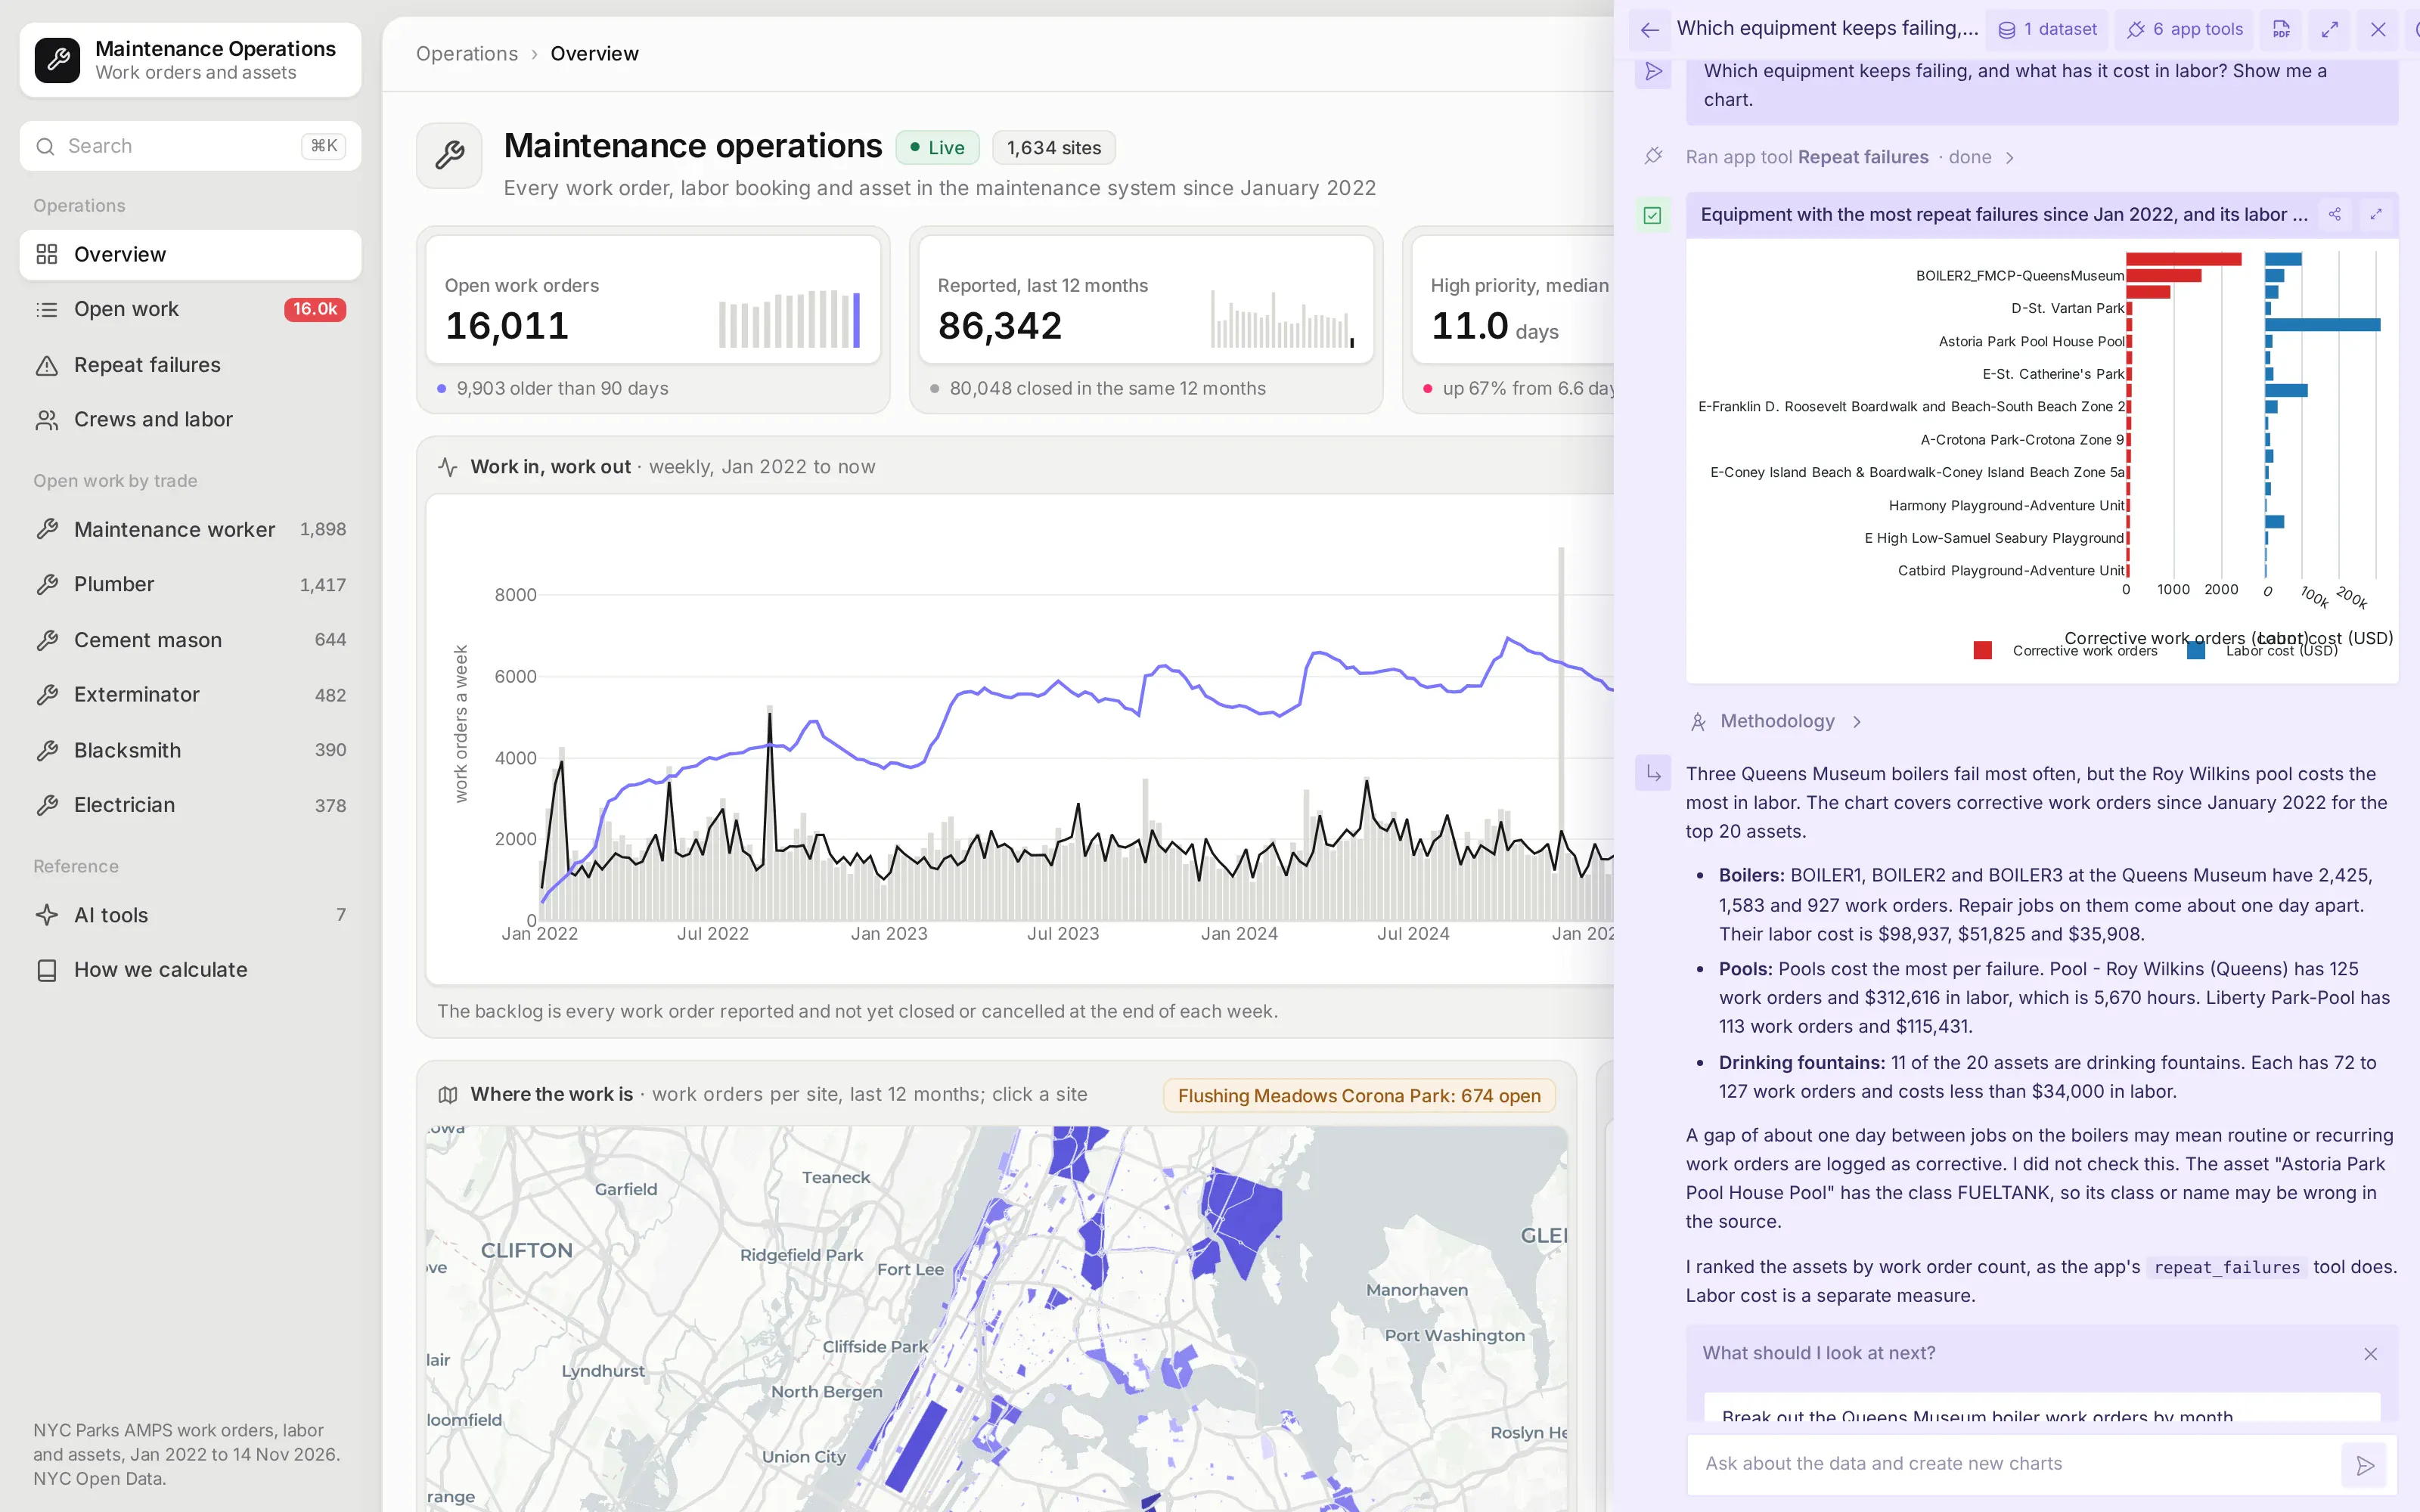
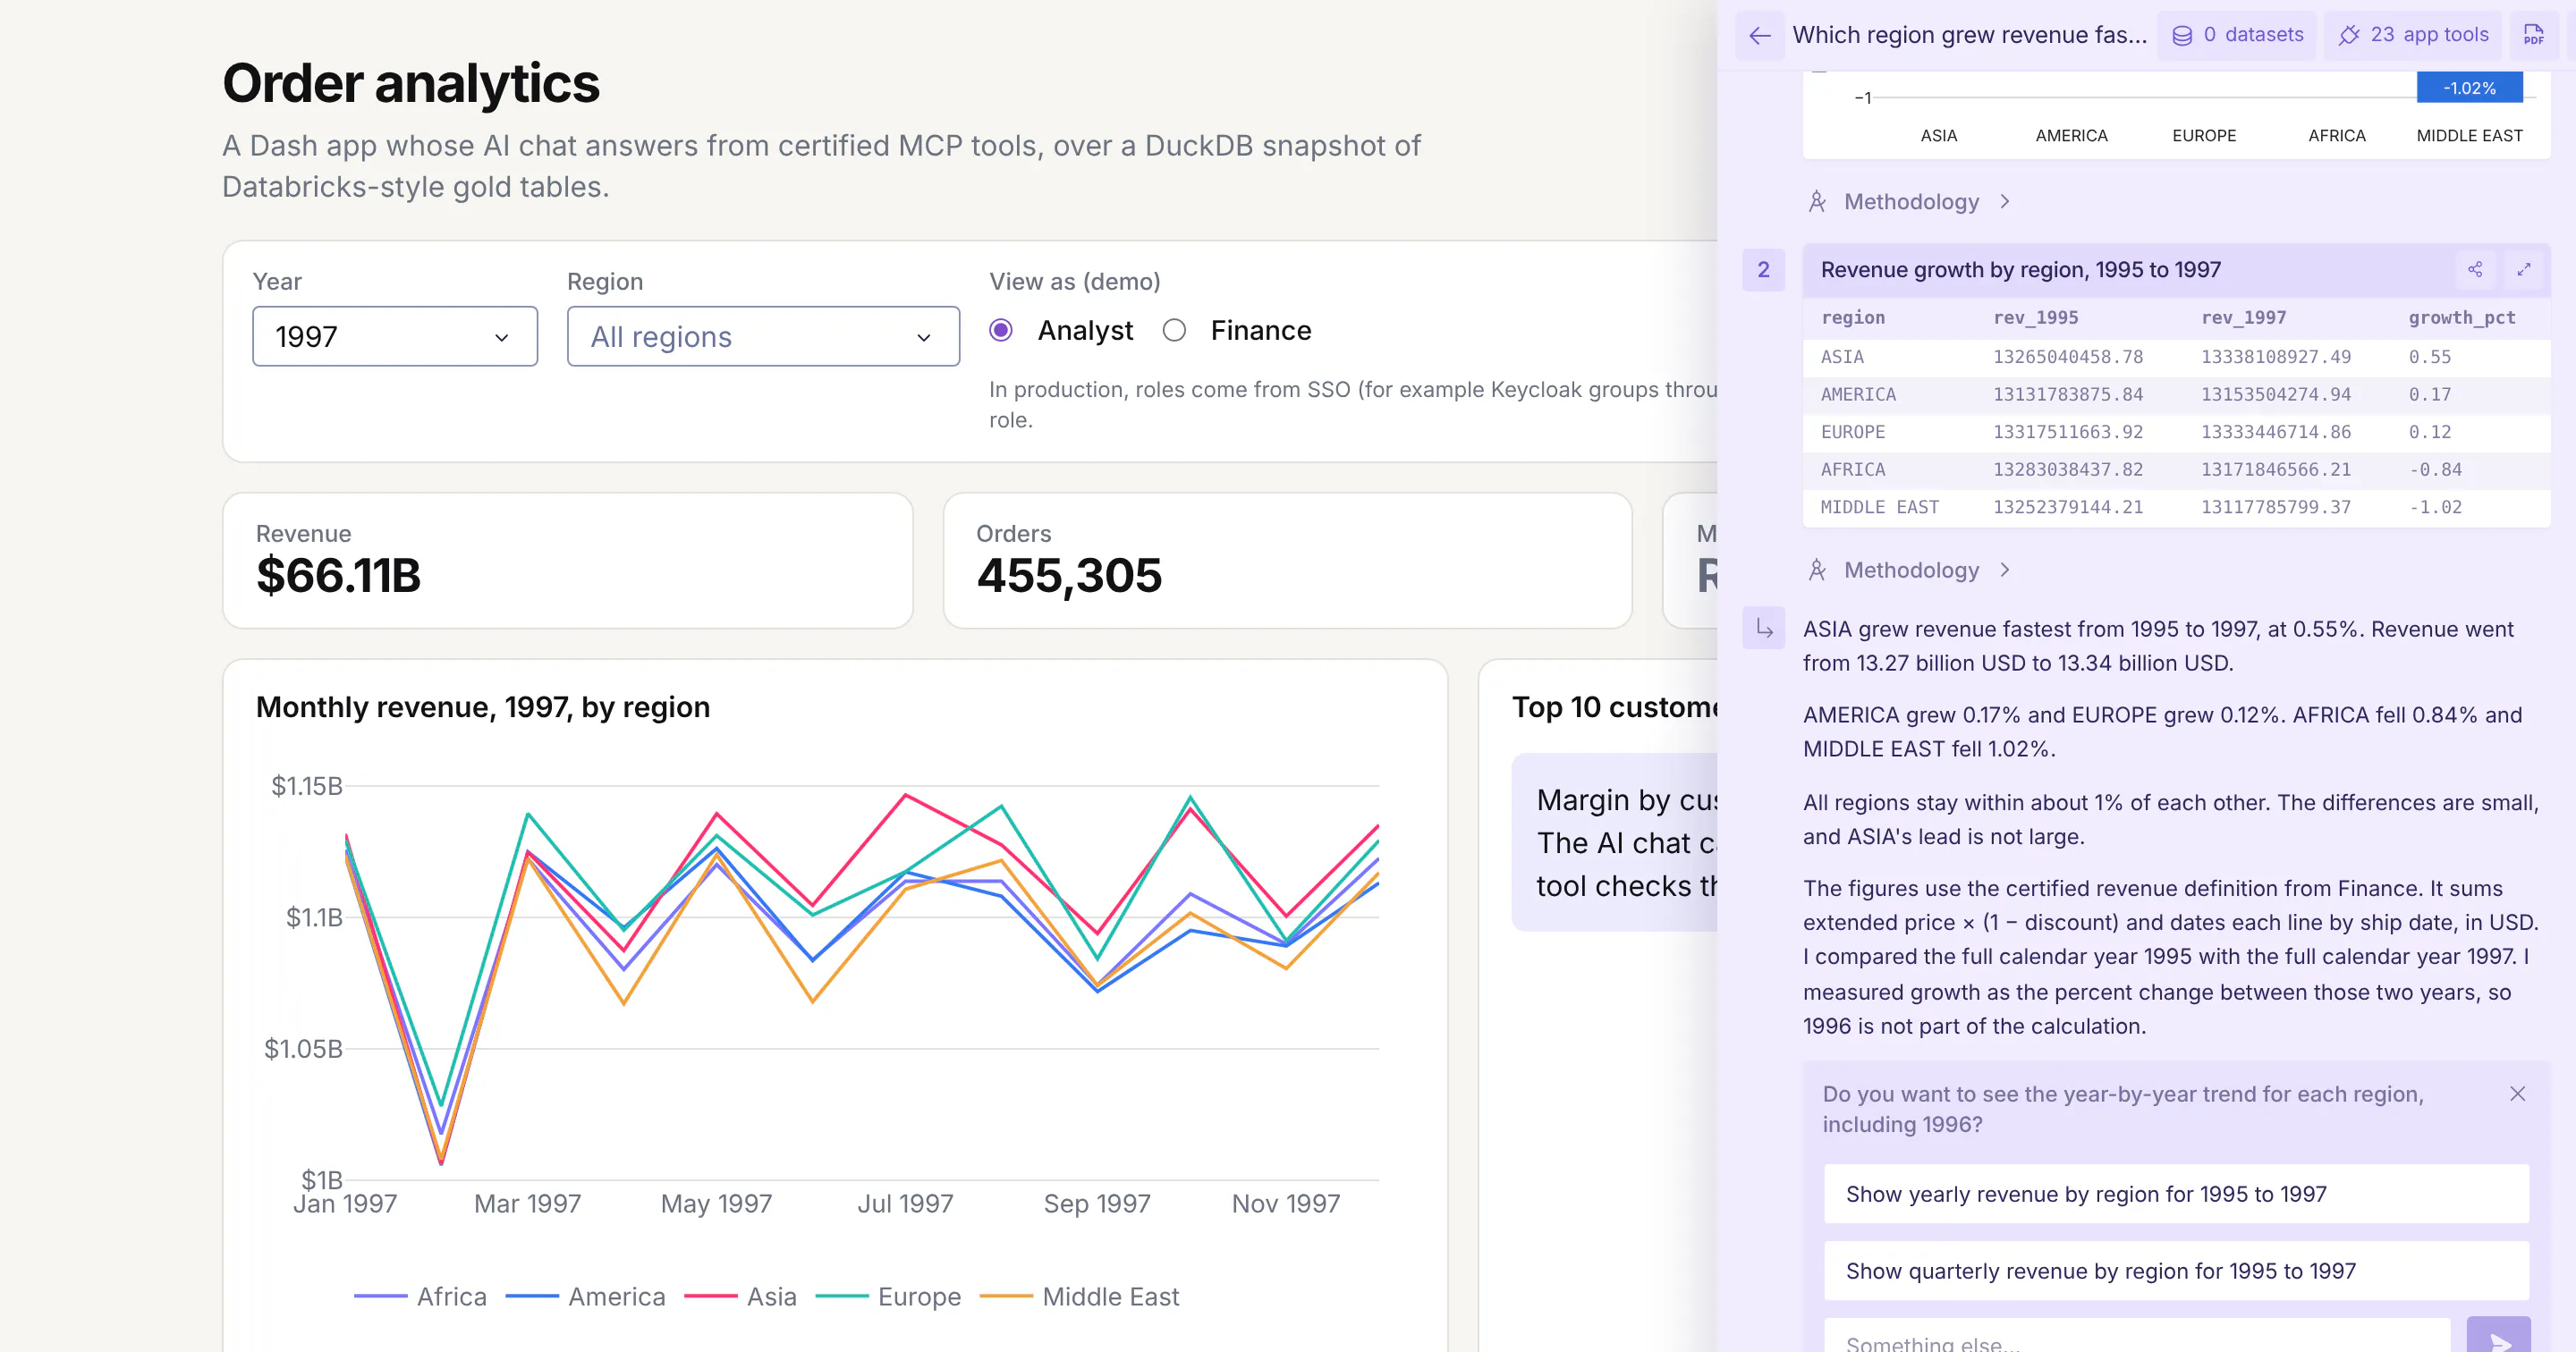
On Plotly Cloud you can switch on Plotly Studio Embedded, a chat panel that sits on top of the app and calls the same tools. Asked which equipment keeps failing, and what it has cost in labor, it ran the app's repeat_failures tool and drew the chart from what the tool returned, so its numbers match the app's own pages.
Studio Embedded is available on Plotly Cloud now and comes to Dash Enterprise in Q4 2026. Every answer has a Methodology link that shows the tool calls and code behind it.
See how every number is defined
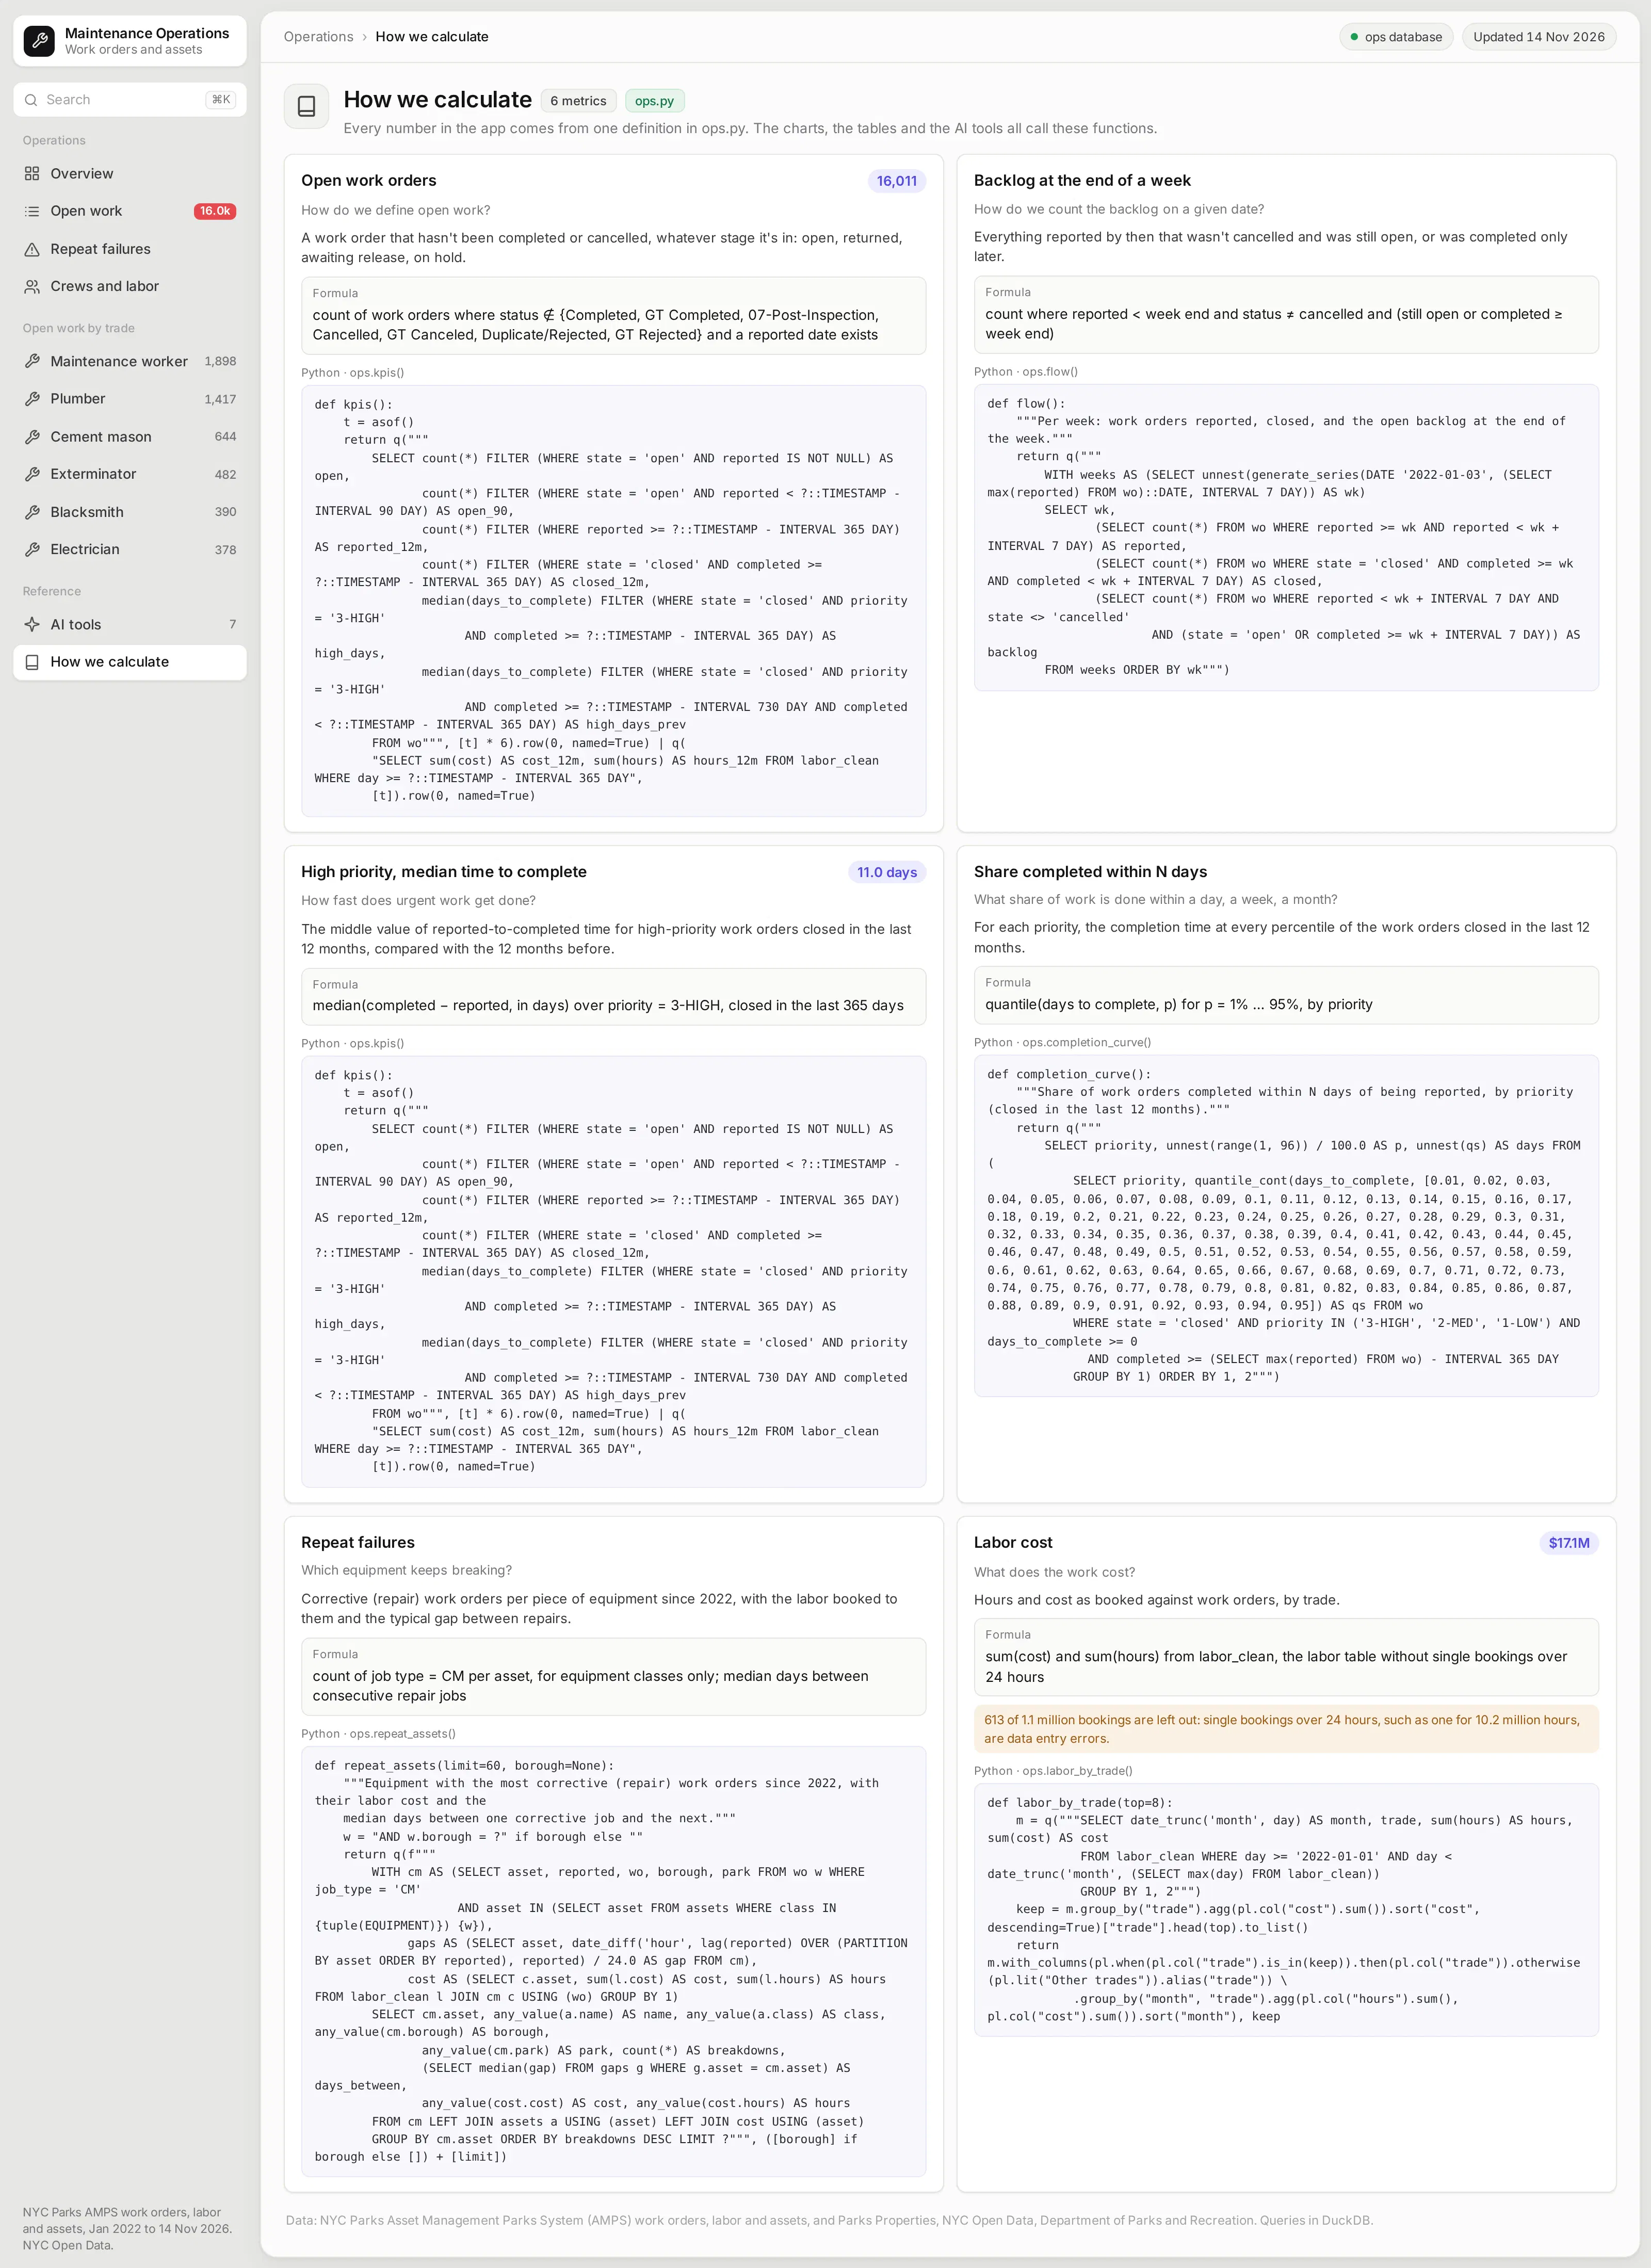
What counts as open, how the backlog is measured, and which labor bookings are left out are choices that people argue about in meetings. This page writes each one down once: the question, the definition in plain words, the formula, and the Python function that computes it.
Those functions are the app's semantic layer. The charts, the tables, and the AI tools all call the same ones, so a number means the same thing wherever it shows up.
What else could you add?
The prompt is a starting point. These are the kinds of things teams usually ask for next, and each one is a sentence or two more in the prompt:
- Read straight from your CMMS, such as Maximo, SAP PM, or Infor EAM, or from the warehouse it feeds
- Write back: let a planner set a priority or assign a crew from the open work page
- Add service level targets by priority and flag the work orders about to miss them
- Forecast next month's backlog from the reported and closed trends
- Add an MCP tool that drafts a work order, so an agent can file one for a person to approve
How is this different from Spotfire and other BI tools?
If you're comparing Spotfire alternatives or other BI tools, the main differences come down to five things:
- With AI, apps like this can be built quickly and cheaply by anyone, including the maintenance planners and reliability engineers who know the data best.
- The apps are backed by code, which you can version control, manage, and update more easily than a fleet of point-and-click dashboards, especially when AI is making the changes.
- The apps can go much further than a traditional BI tool, with multiple pages, write-back to databases, custom simulations, AI chart building inside the app, MCP endpoints, and more.
- You have full control over the app: the look and feel, the controls, filters, and buttons, and every computation. You aren't fighting a tool to get what you want.
- The apps can connect to several data sources at once, and to the other systems your team already uses.
How long did it take to build?
About 30 minutes of agent time, much of it spent downloading the data. Claude Code (with Claude Opus 5.5) loaded the tables into a database, checked them, built the app and its MCP tools, ran it, took screenshots, and fixed what looked wrong in them, all from one prompt.
The data check caught a real problem. A handful of labor bookings were data entry errors, including one that booked more than ten million hours to a single job, so the agent left out any single booking over 24 hours, 613 of 1.1 million, and said so on the "How we calculate" page.
The prompt
Paste this into Claude Code, Codex, Copilot, Cursor, or another coding agent, in an empty folder. Swap in your own data source and the features you need.
Build a Dash app for maintenance operations on the work orders, labor bookings, and assets in our internal database, using DuckDB for every query.
Data
- Read the work order, labor, and asset tables and the site boundaries from the operations database (for this example, NYC Parks' AMPS work orders, labor, and assets and the Parks Properties boundaries from NYC Open Data, loaded into a DuckDB file).
- Define open, backlog, days to complete, and corrective work in one Python module, and use it for every page.
- Check the labor table for impossible bookings before you build anything on it, and tell me what you find.
Pages (each with its own URL, and the back button must work)
- Overview: KPI cards for open work, work reported in the last 12 months, the median days to complete high-priority work against the year before, and labor cost, each with a sparkline. Weekly reported and closed work with the open backlog. A map of sites shaded by work orders, where clicking a site opens it. A heatmap of when requests come in. Completion curves by priority.
- Open work: filters for borough, trade, and priority, an aging chart, and a table of open work orders where clicking a row shows its details and labor.
- Repeat failures: equipment plotted by corrective work orders against labor cost, and a table. Each asset gets a page with a timeline of every job.
- Crews and labor: hours by trade over time, a treemap of labor cost, and a Sankey from asset group to trade to outcome.
- /site/<id>: the site's outline on a map, work by month, and its busiest assets.
- A "How we calculate" page that shows each metric's definition, formula, and the Python function behind it.
AI
- Create the app with enable_mcp=True and expose the main metrics as @mcp_enabled tools, plus a read-only SQL tool with a row cap. Add a page that lists the tools.
Design
- A gray page with a white app panel and an inset sidebar. Each card is a light surface with its title on top and the chart or table inset in a white panel. Dense tables. Inter everywhere. No chart toolbars.
Run it, screenshot every page at 1600x1000, and fix anything that overflows, looks empty or doesn't match the numbers before you stop.
How do I run it on Dash Enterprise or Plotly Cloud?
Dash Enterprise runs Dash apps inside your own infrastructure, behind your firewall and even air-gapped, with single sign-on and access control for each app. That matters here, because a maintenance system is internal data.
This app needs nothing special. It's a Dash app with a requirements.txt, and your coding agent can deploy it through the Dash Enterprise or Plotly Cloud command line.
Point the app at your database with an environment variable. This example reads a DuckDB file named by OPS_DB, and swapping in a connection to your own warehouse changes one function.
If you'd rather not run any infrastructure, Plotly Cloud hosts the same app for you. We tested this one there.
Tips and tricks
These are things we like doing when we build apps like this one.
- Ask for a page per thing. A page for each site and each asset, with its own URL, makes the app feel like a website rather than a report, and lets people share exactly what they're looking at.
- Make the agent check the data first. Asking it to look for impossible values before building charts is what caught the ten-million-hour labor booking.
- Write the definitions down once. What counts as open, or as a repair, is a choice. Put it in one module and show it on a metrics page, so the pages, the tools, and the people all agree.
- Have the agent look at its own screenshots. Asking it to fix anything that overflows or looks empty catches most layout problems before you see them.
- Let plain Python functions be your semantic layer. The backlog, completion times, and repeat failures are short functions over SQL in one module, and you can read them, test them, and change them, and so can the agent. Plain Python functions like these can become your semantic layer, one definition that every page, test, and agent uses.
- Wrap your Python functions in @mcp_enabled. Turn on enable_mcp=True in the Dash(...) call and mark the functions with @mcp_enabled, and chat agents like Claude, ChatGPT, or Copilot can call them over MCP and get the same numbers the app's pages show.
- Switch on Plotly Studio Embedded. The same tools power Plotly Studio Embedded, an AI chat inside the app that answers questions with charts and tables built from your functions. It's available now on Plotly Cloud (in beta) and is planned for Dash Enterprise in Q4 2026.
FAQ
See what Dash Enterprise and Plotly Cloud can do for your team
Our customers in energy, pharma, finance, and manufacturing are building apps like this one with coding agents and running them on Dash Enterprise behind their firewall or on Plotly Cloud. Request a demo and we'll show you how it works for your team.