
Chris Parmer
November 20, 2026
Battery electrode line quality and calendering process app
A data app example built with Dash and an AI coding agent in 10 minutes
TL;DR
- Building data apps with AI coding agents in Python and managing them on Dash Enterprise or Plotly Cloud is the modern alternative to BI. At Plotly, many of our customers are migrating away from point-and-click tools like Spotfire, Tableau, and Power BI toward code-backed tools powered by AI. This example showcases the types of apps that you can create.
- This app follows a battery cathode from coating and drying through calendering to tested coin cells, using public data from a real pilot line at WMG, University of Warwick. A coding agent built it from one prompt in about 10 minutes.
- It shows which calendering settings keep a thick electrode working at high current, and it lets you open any setting to see its three cells' raw discharge curves.
- A process model is fit in Python while you watch. Tick cells to leave them out and it refits, with an honest check of how well it predicts cells it hasn't seen.
- The full prompt is below, so you can build the same kind of app on your own line data and run it on Dash Enterprise behind your firewall or have it hosted for you on Plotly Cloud.
Walkthrough
The app follows how a process engineer looks at an electrode line: which settings work, why, and what the raw data says. The data comes from an experiment on WMG's pilot line: NMC622 cathodes coated at two loadings, calendered at three roll temperatures to three densities, and built into 54 half coin cells. It's a pilot line, not a production line, but the questions are the same ones a cell plant asks.
See every cell discharge at 5C
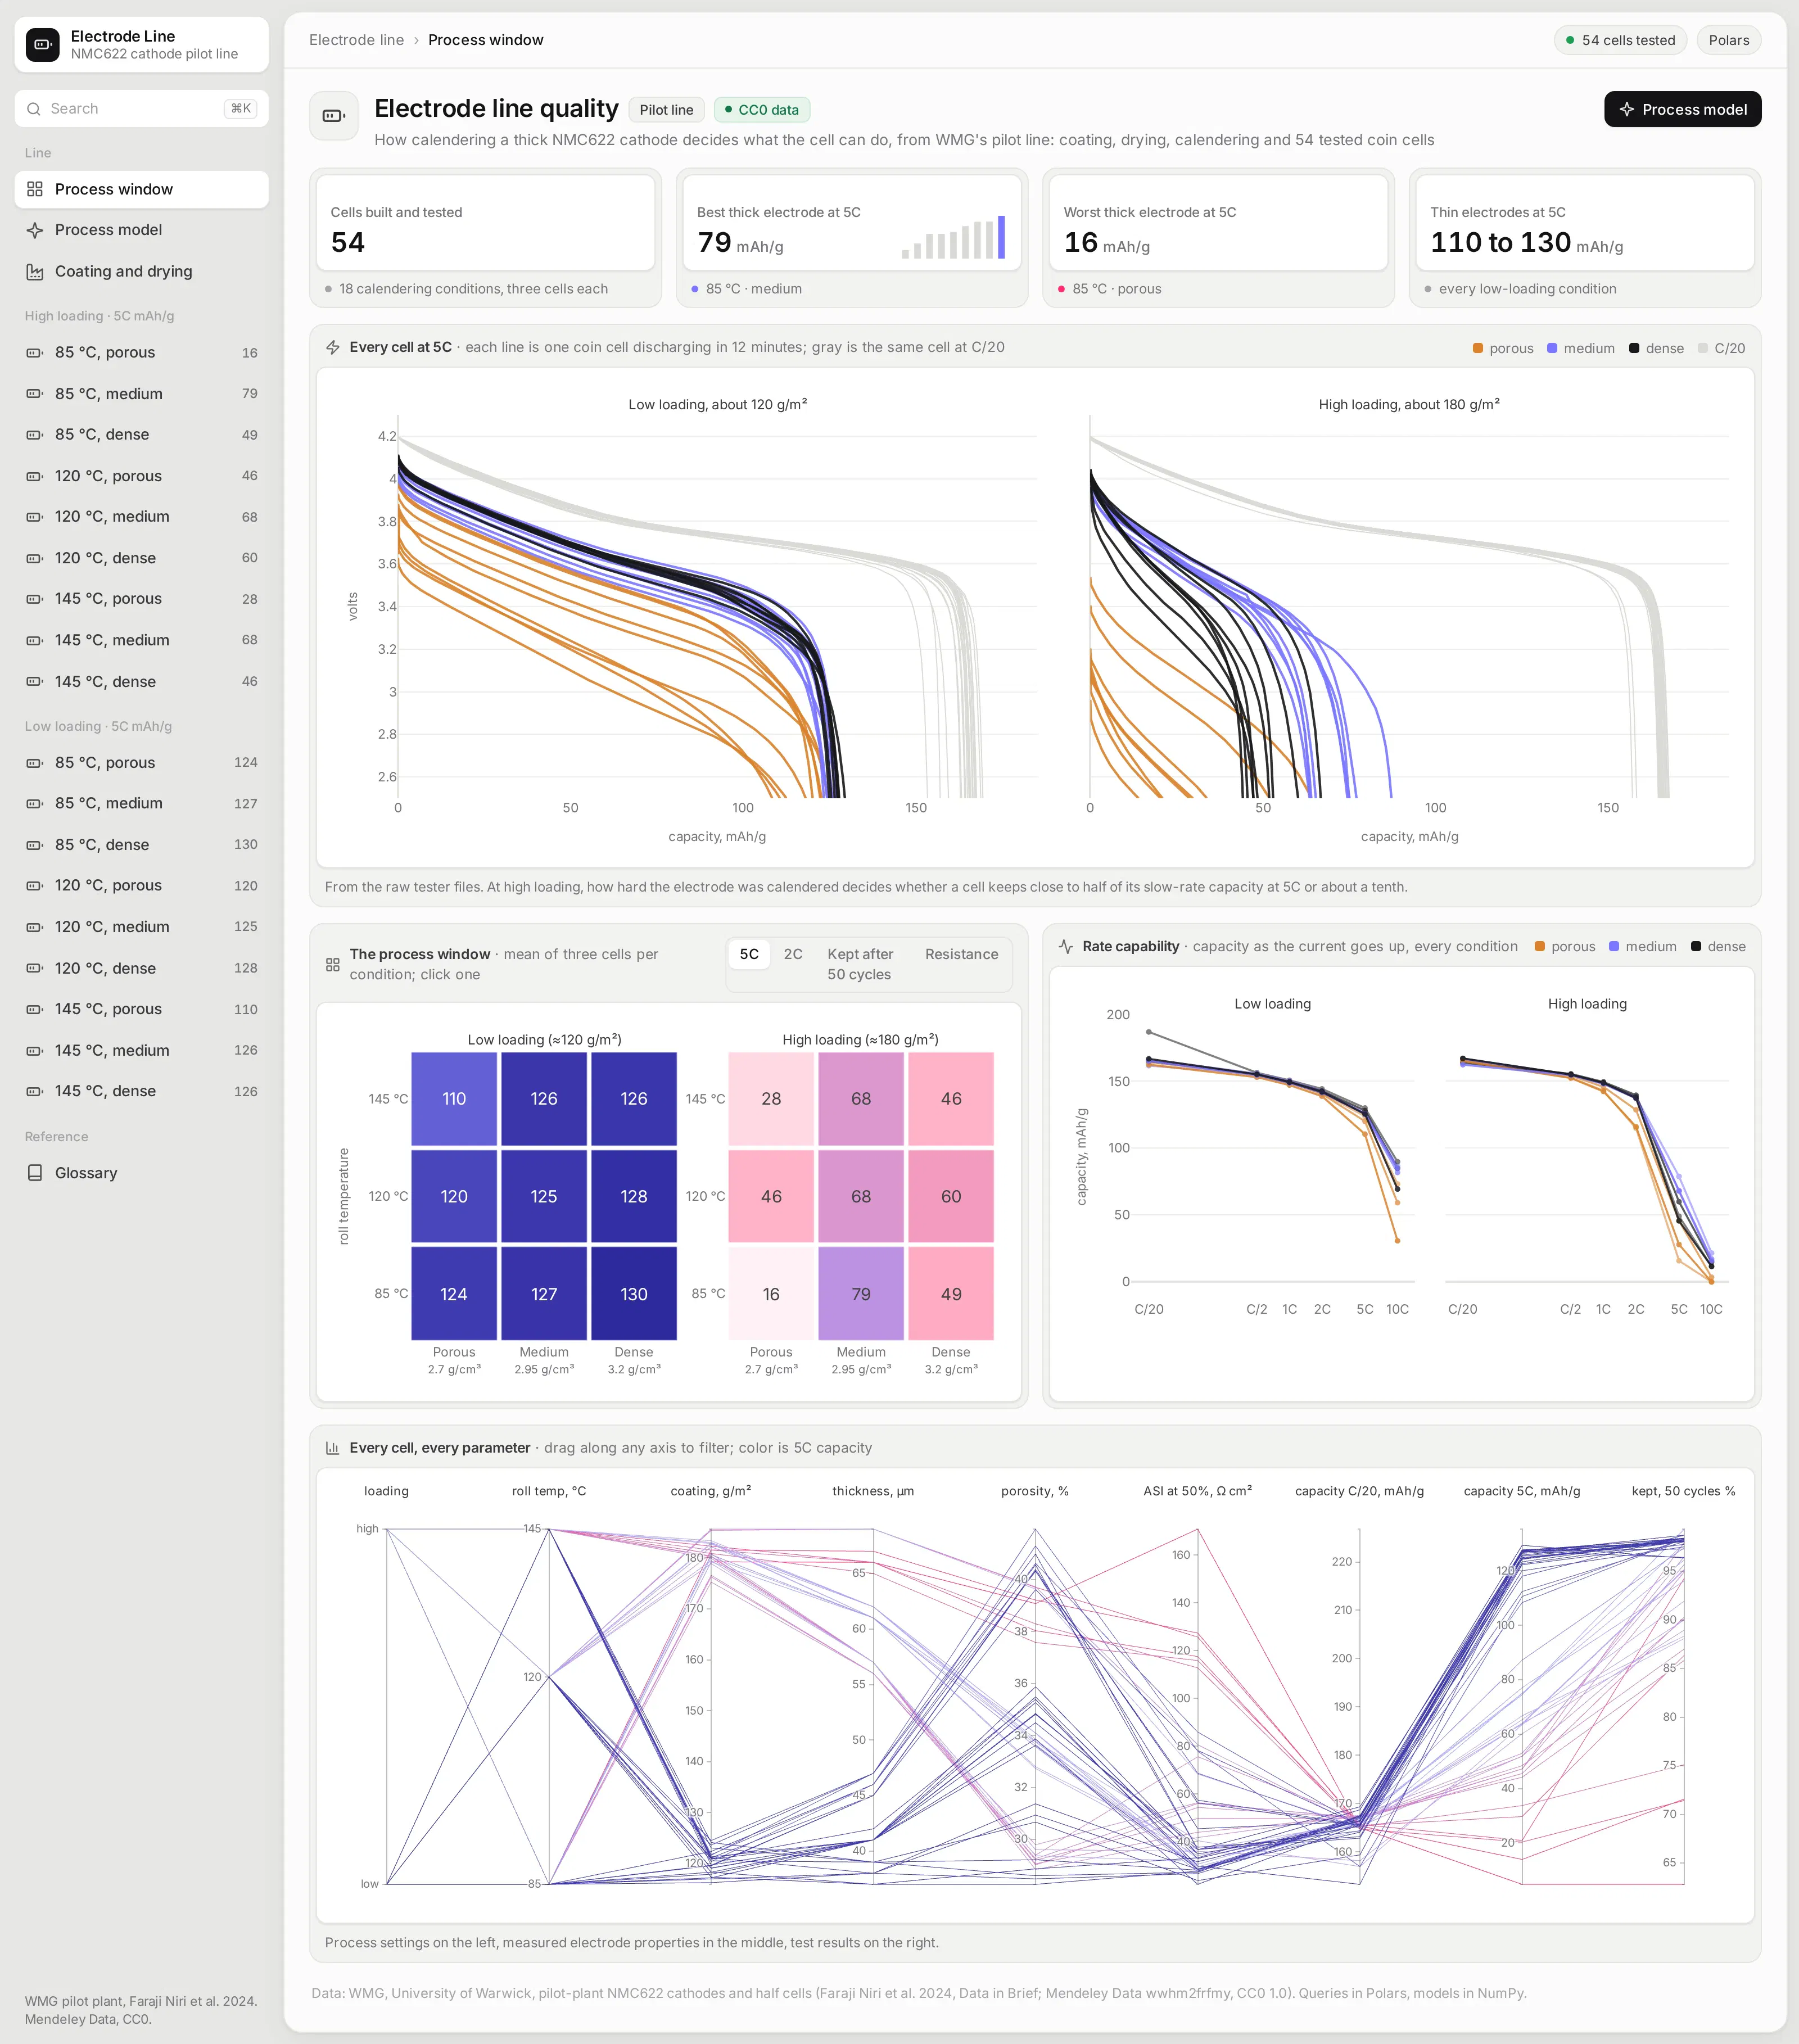
The overview opens with every coin cell's discharge at 5C, drawn over the same cell's slow C/20 discharge, straight from the raw tester files. Thin electrodes barely care how they were calendered, while thick ones keep close to half their capacity at 5C when calendered to medium density and about a tenth when left porous.
Below it, two heatmaps put all 18 calendering conditions side by side, one per coating loading. A control switches the metric between capacity at 2C and 5C, capacity kept after 50 cycles, and resistance, and clicking a square opens that condition.
Compare how every condition holds up as the current rises
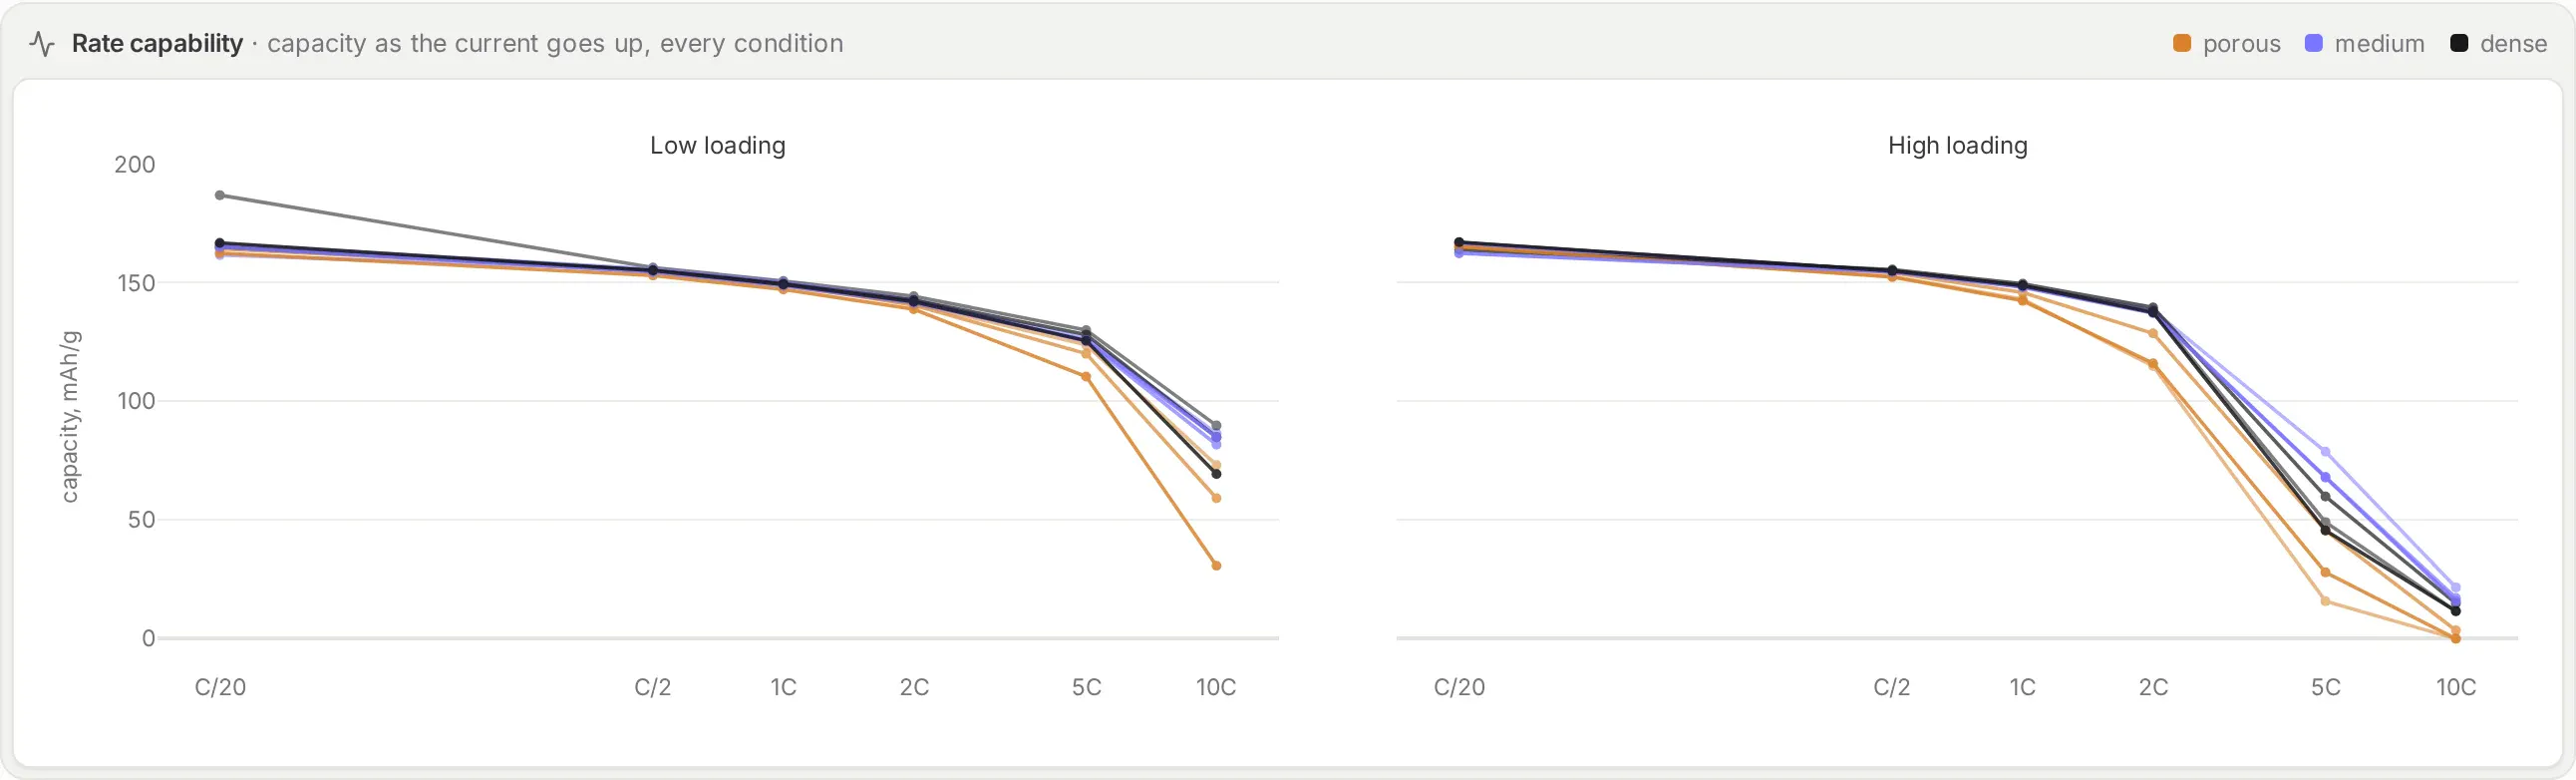
Rate capability curves show capacity from a 20-hour discharge down to a 6-minute one. At low current, every electrode delivers about the same. The thick ones split apart above 2C, which is where the calendering choice starts to matter.
Filter every cell on every parameter
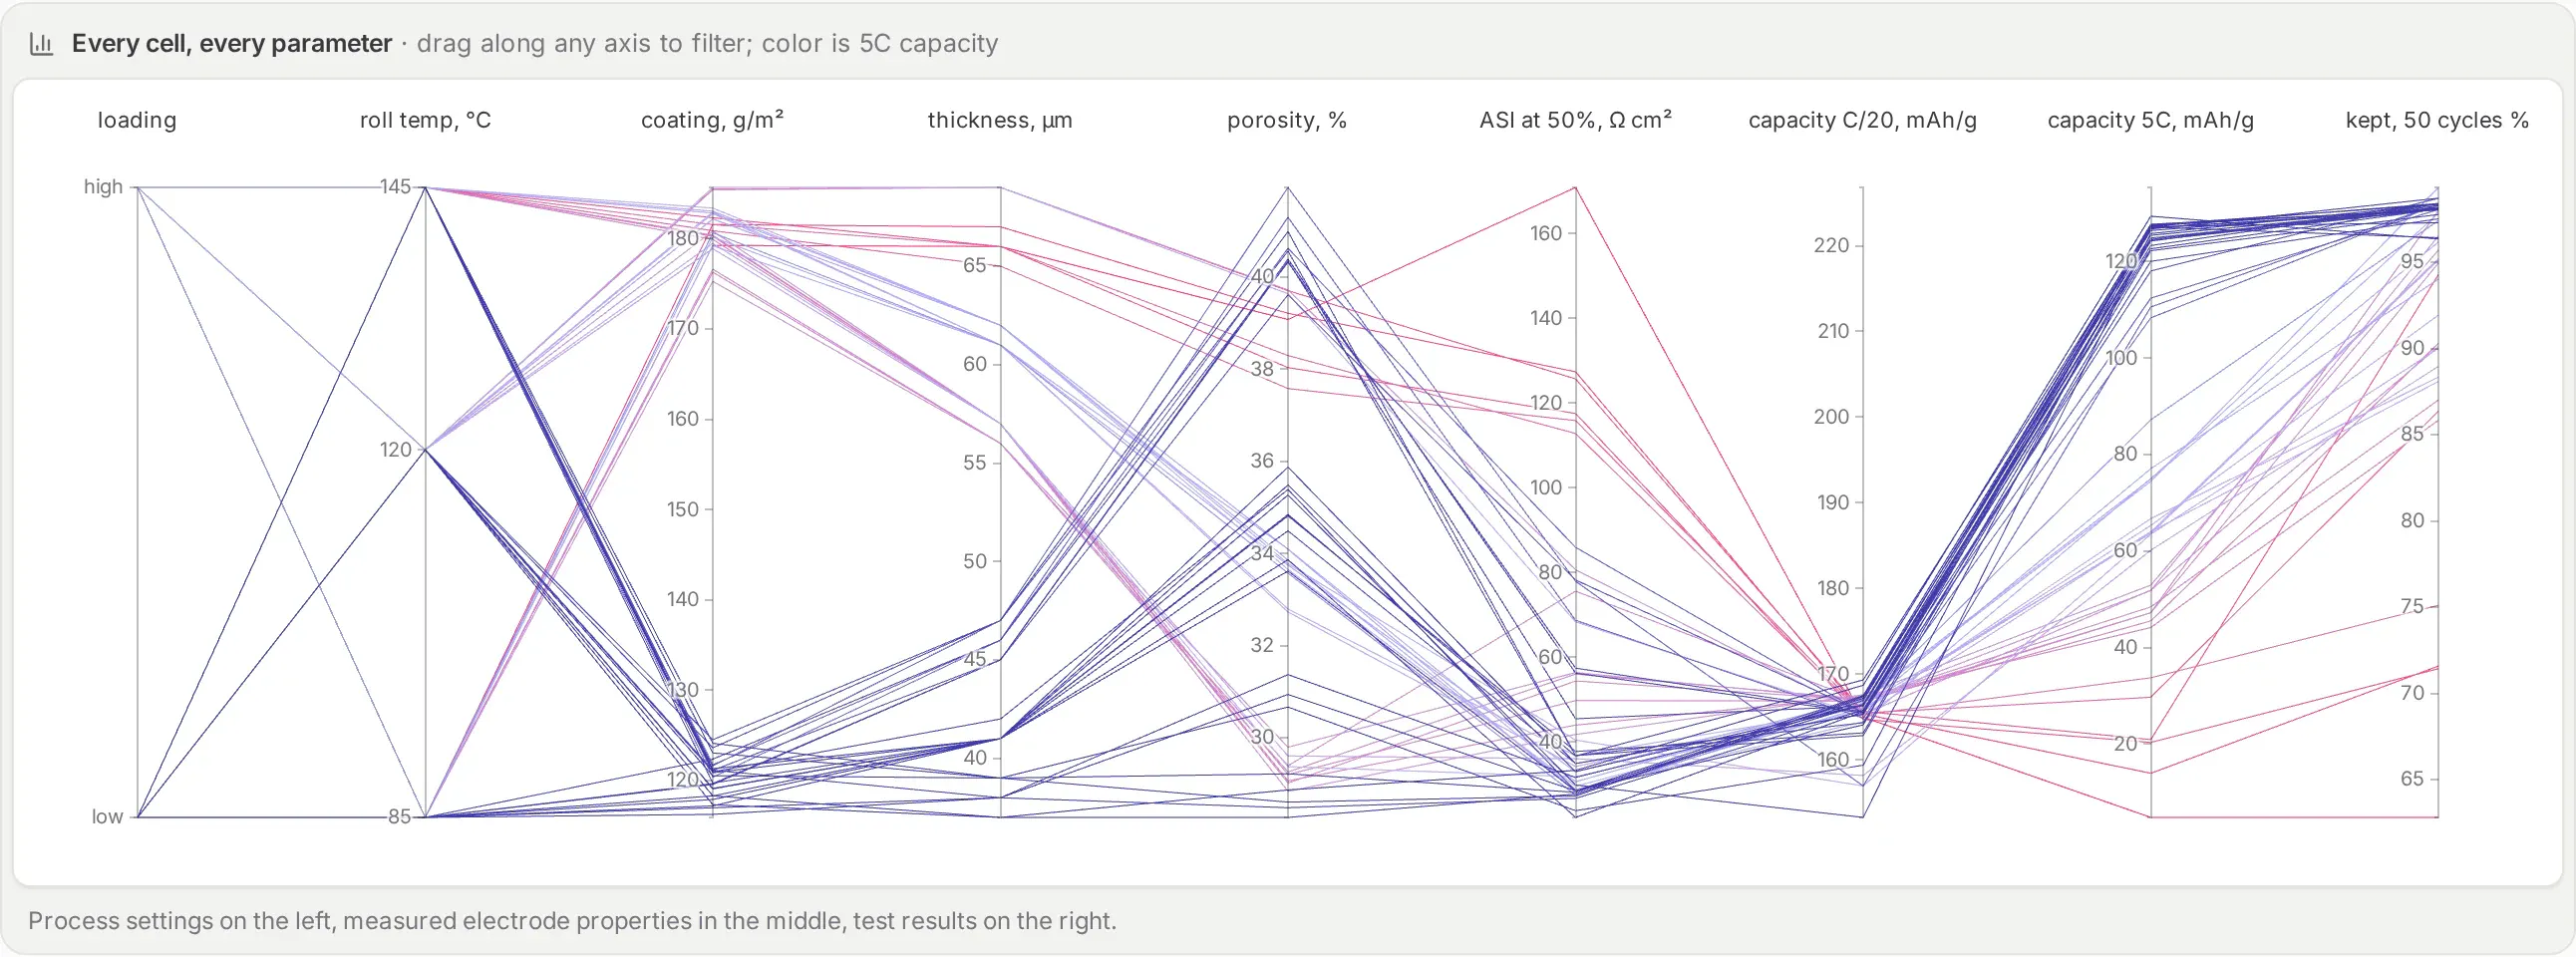
The parallel coordinates chart draws each of the 54 cells as one line, from process settings on the left to test results on the right. Drag along any axis to filter, for example to only the cells with poor 5C capacity, and the settings they share stand out.
Fit a process model and watch it refit
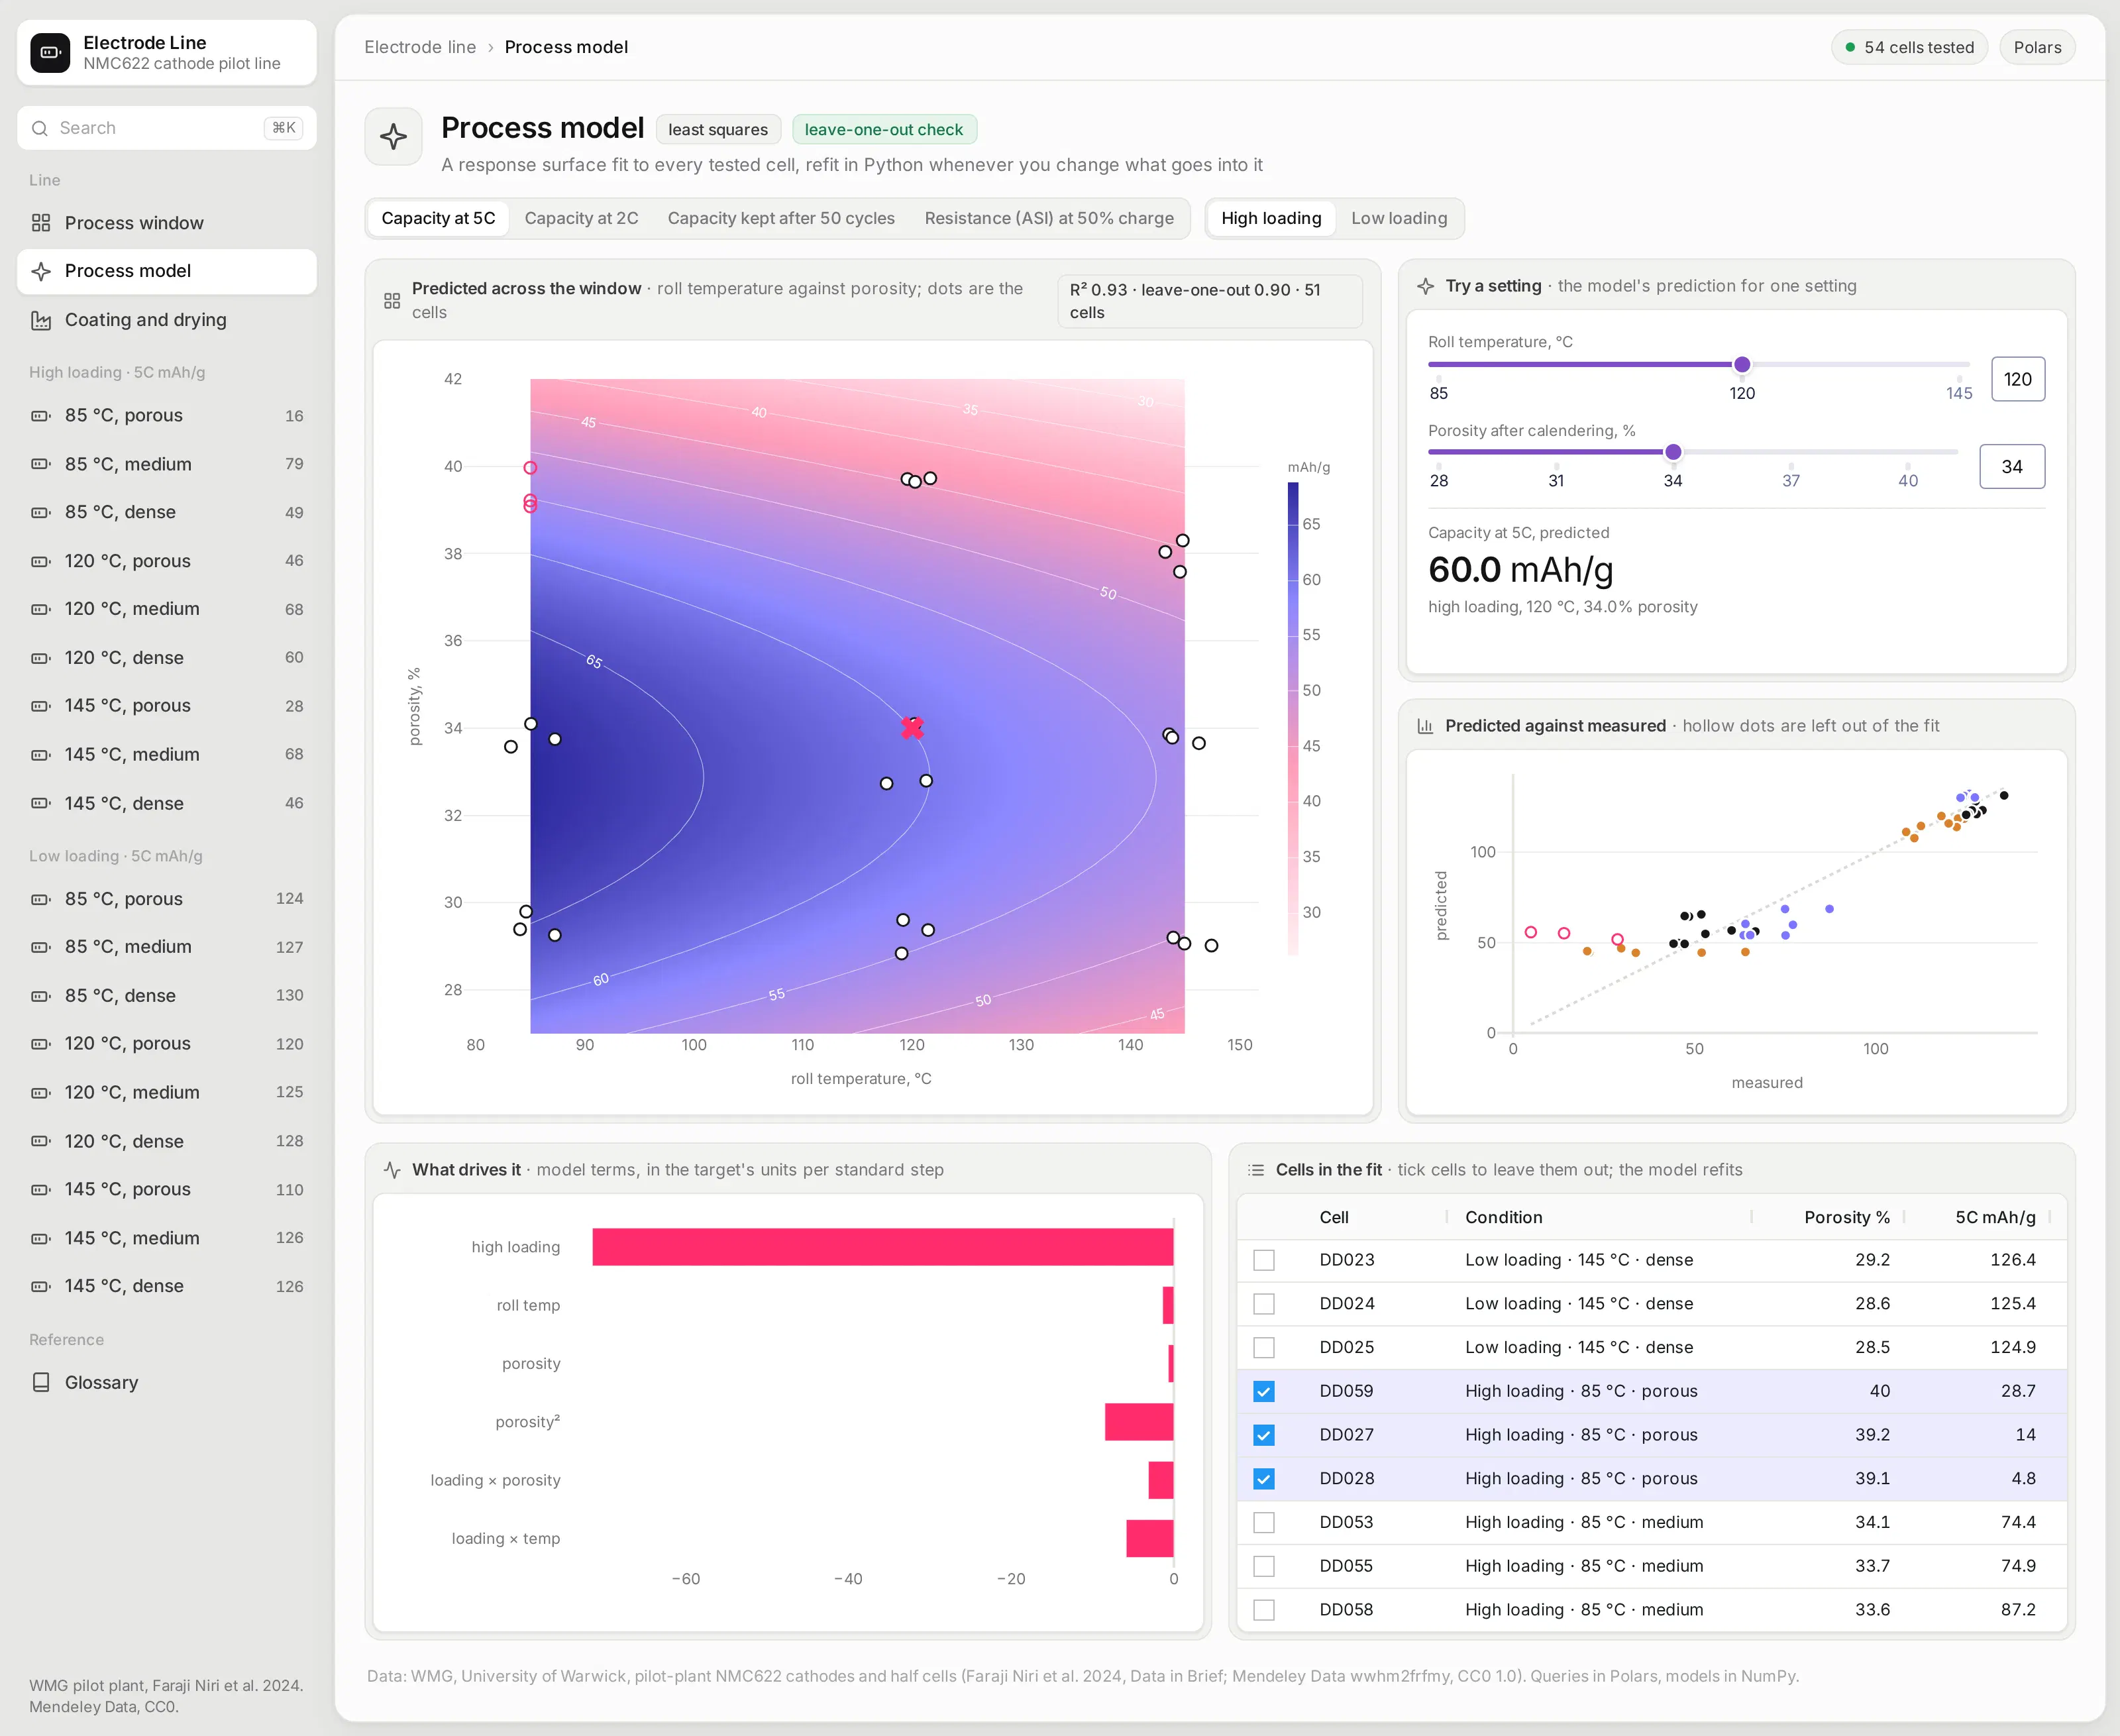
The model page fits a response surface with ordinary least squares in NumPy: capacity as a function of loading, roll temperature, and porosity, with curvature in porosity. Sliders give a prediction for any setting, and the surface shows where the best region is.
Tick cells in the table to leave them out, and the model refits on the spot. Every fit reports a leave-one-out R², how well it predicts each cell it didn't see. For 5C capacity it holds up well. For capacity kept after 50 cycles it's weak, and the app says so rather than hiding it.
Open one condition and its raw test data
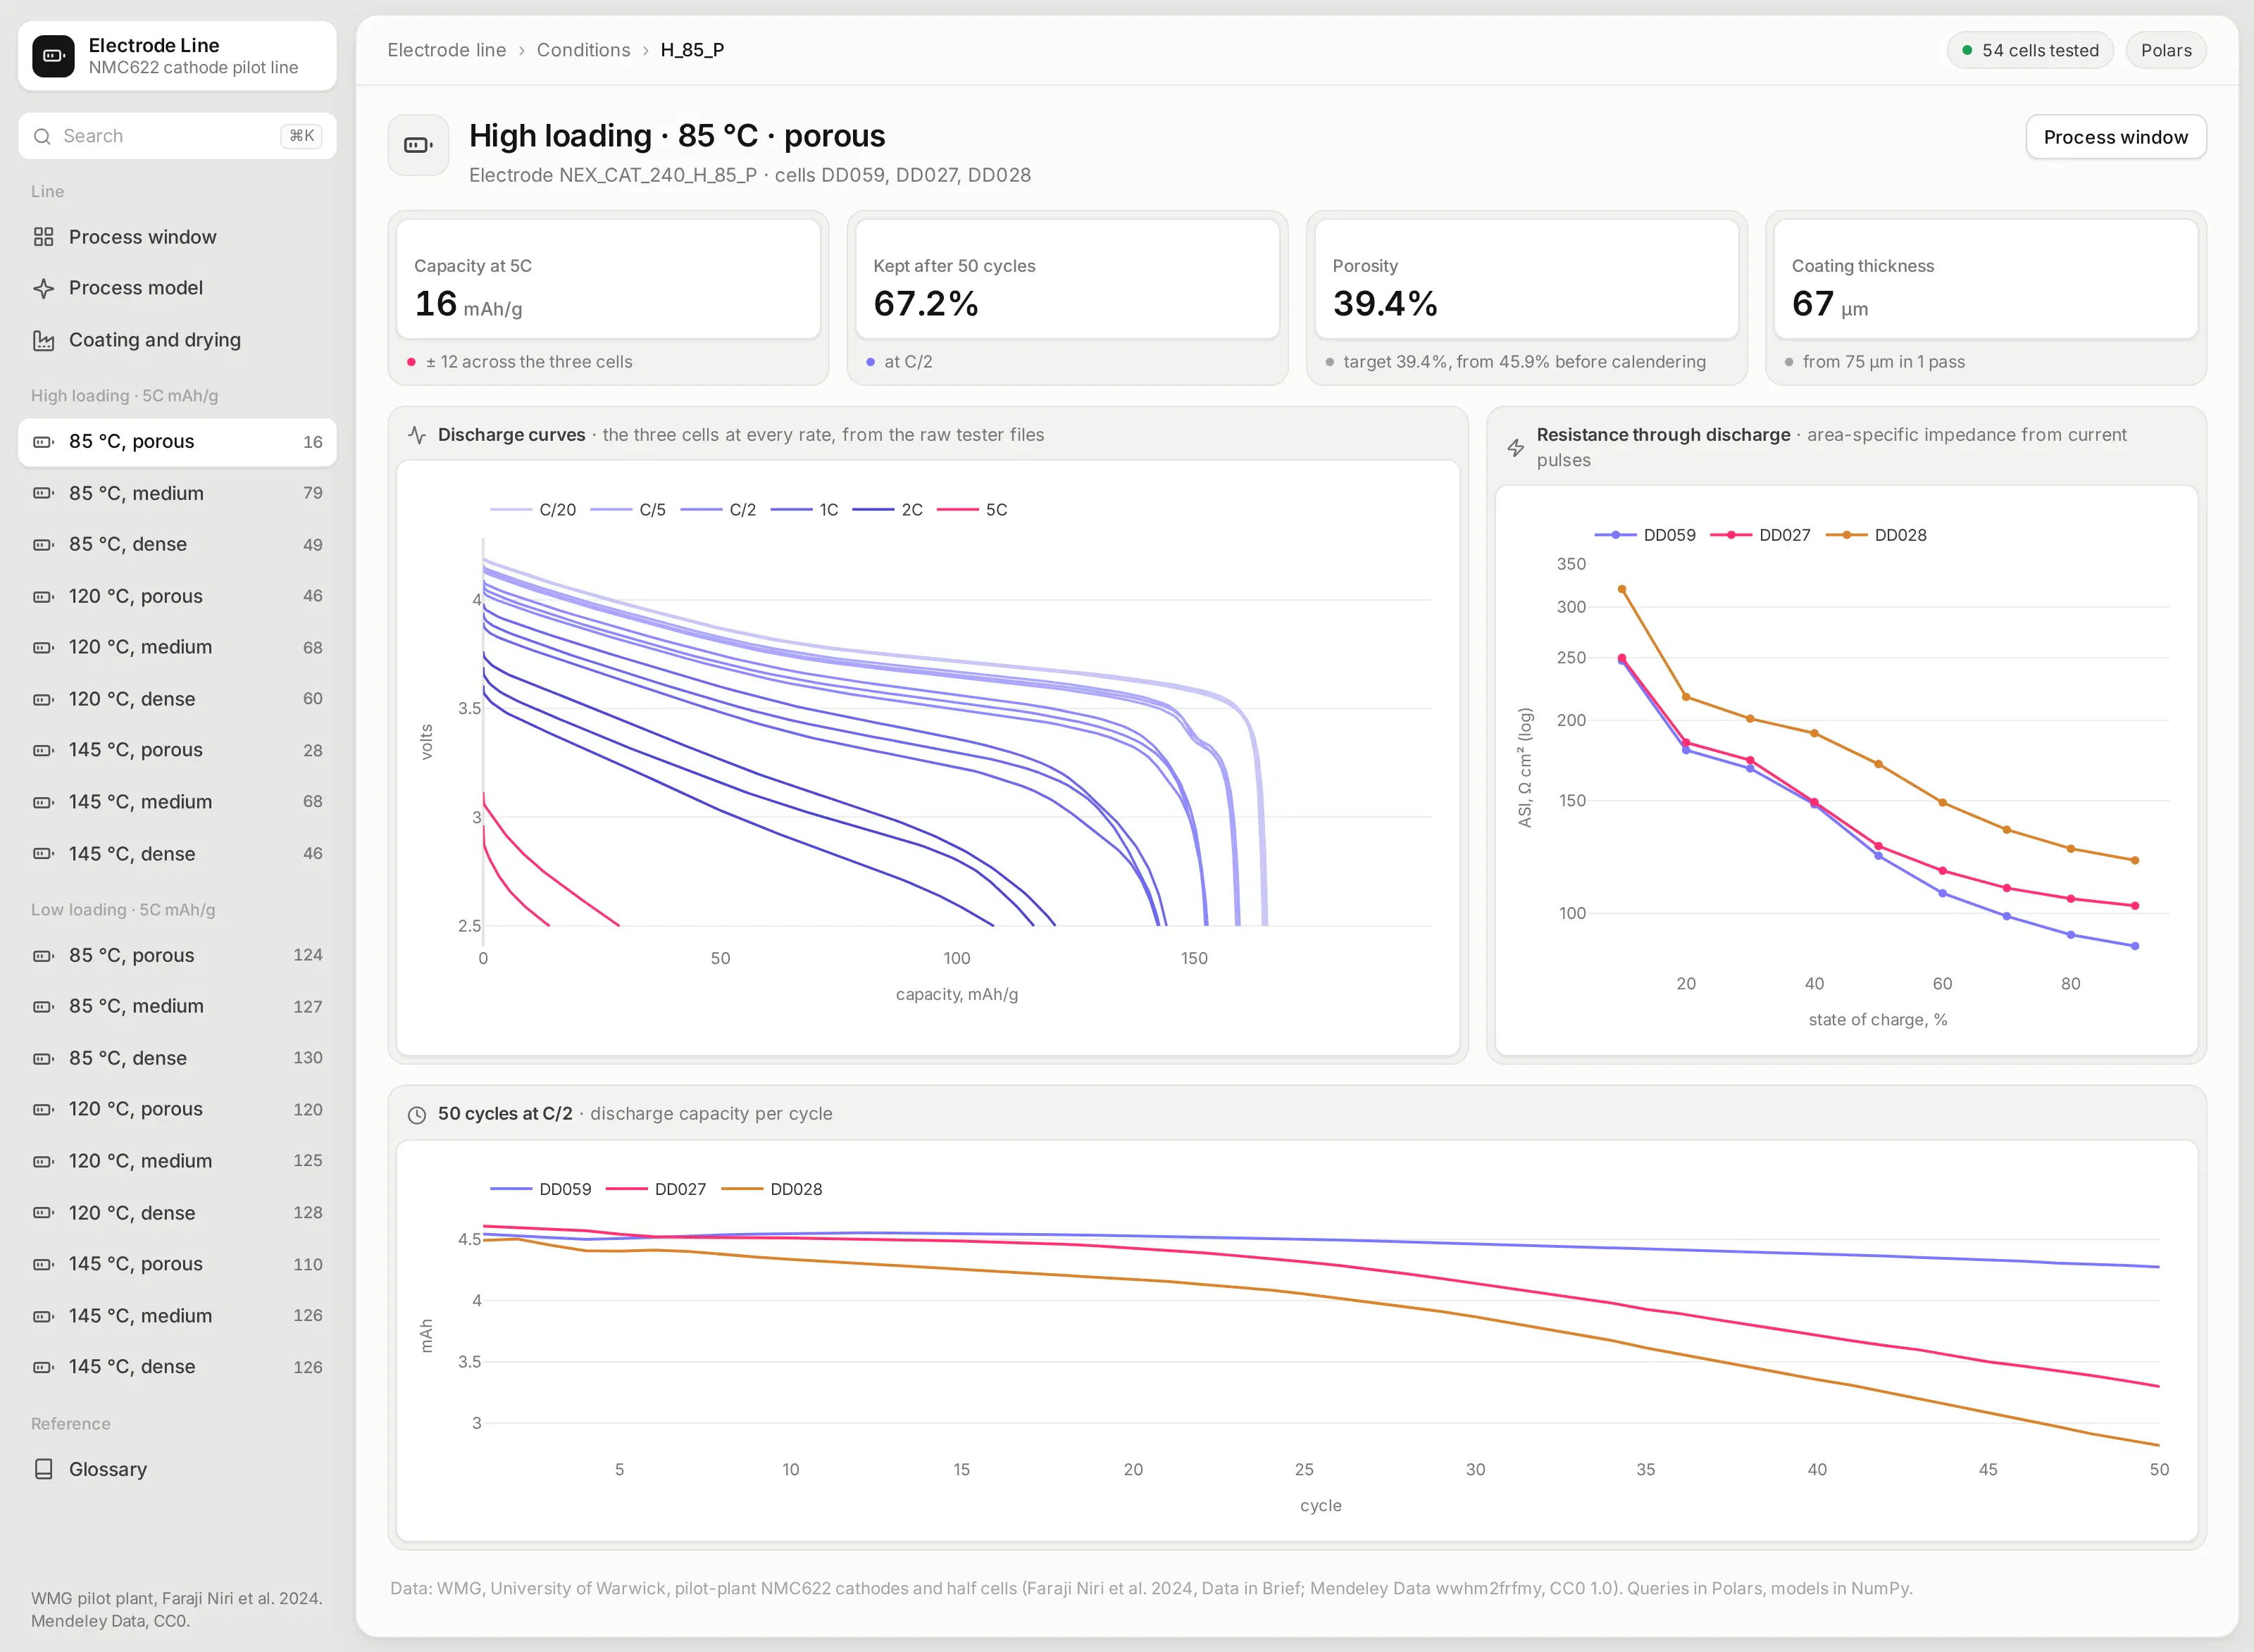
Each condition has its own page with its three cells. Discharge curves at every rate come straight from the raw tester files, so you can see where the porous thick electrode runs out of voltage at 5C.
Next to them are resistance at each state of charge and 50 cycles of capacity. A medium-density electrode at the same loading is one click away in the sidebar for comparison.
Check the coating line's own logs
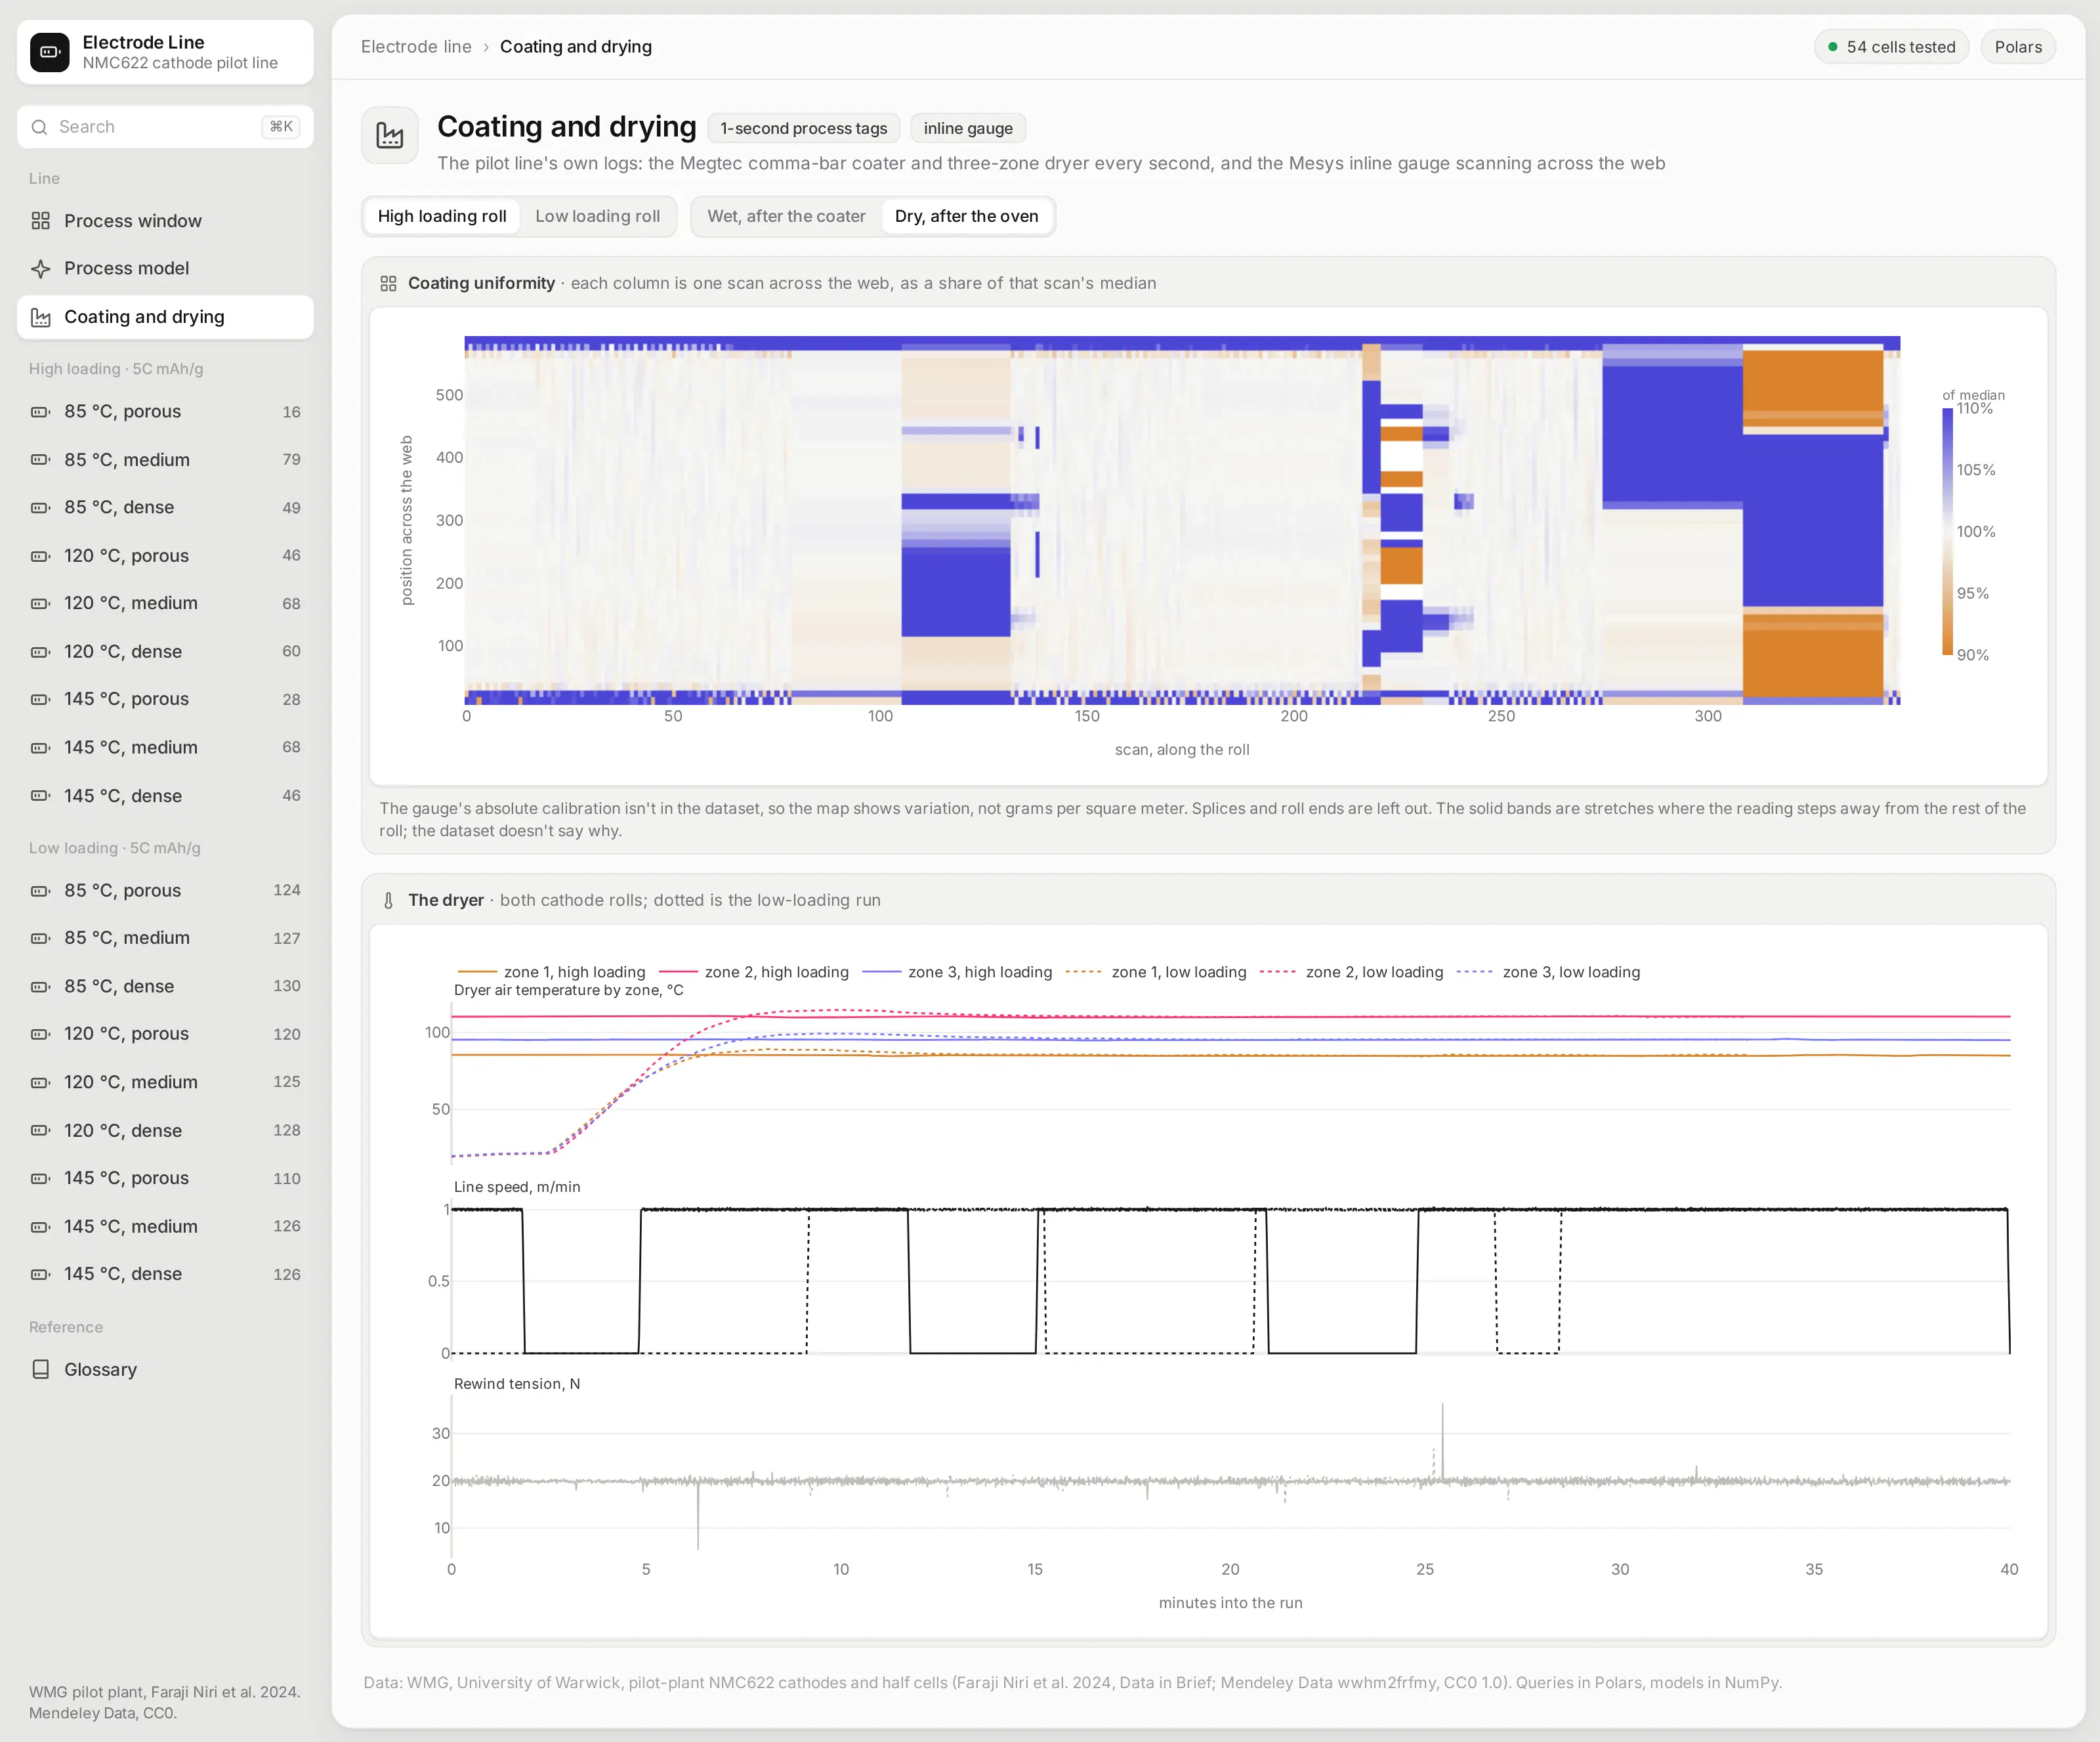
The pilot line logged its coater and three-zone dryer every second, and an inline gauge scanned across the coated web. The app shows the gauge's scans as a uniformity map and the dryer's zone temperatures, line speed, and tension over each run.
Ask the app from an AI agent
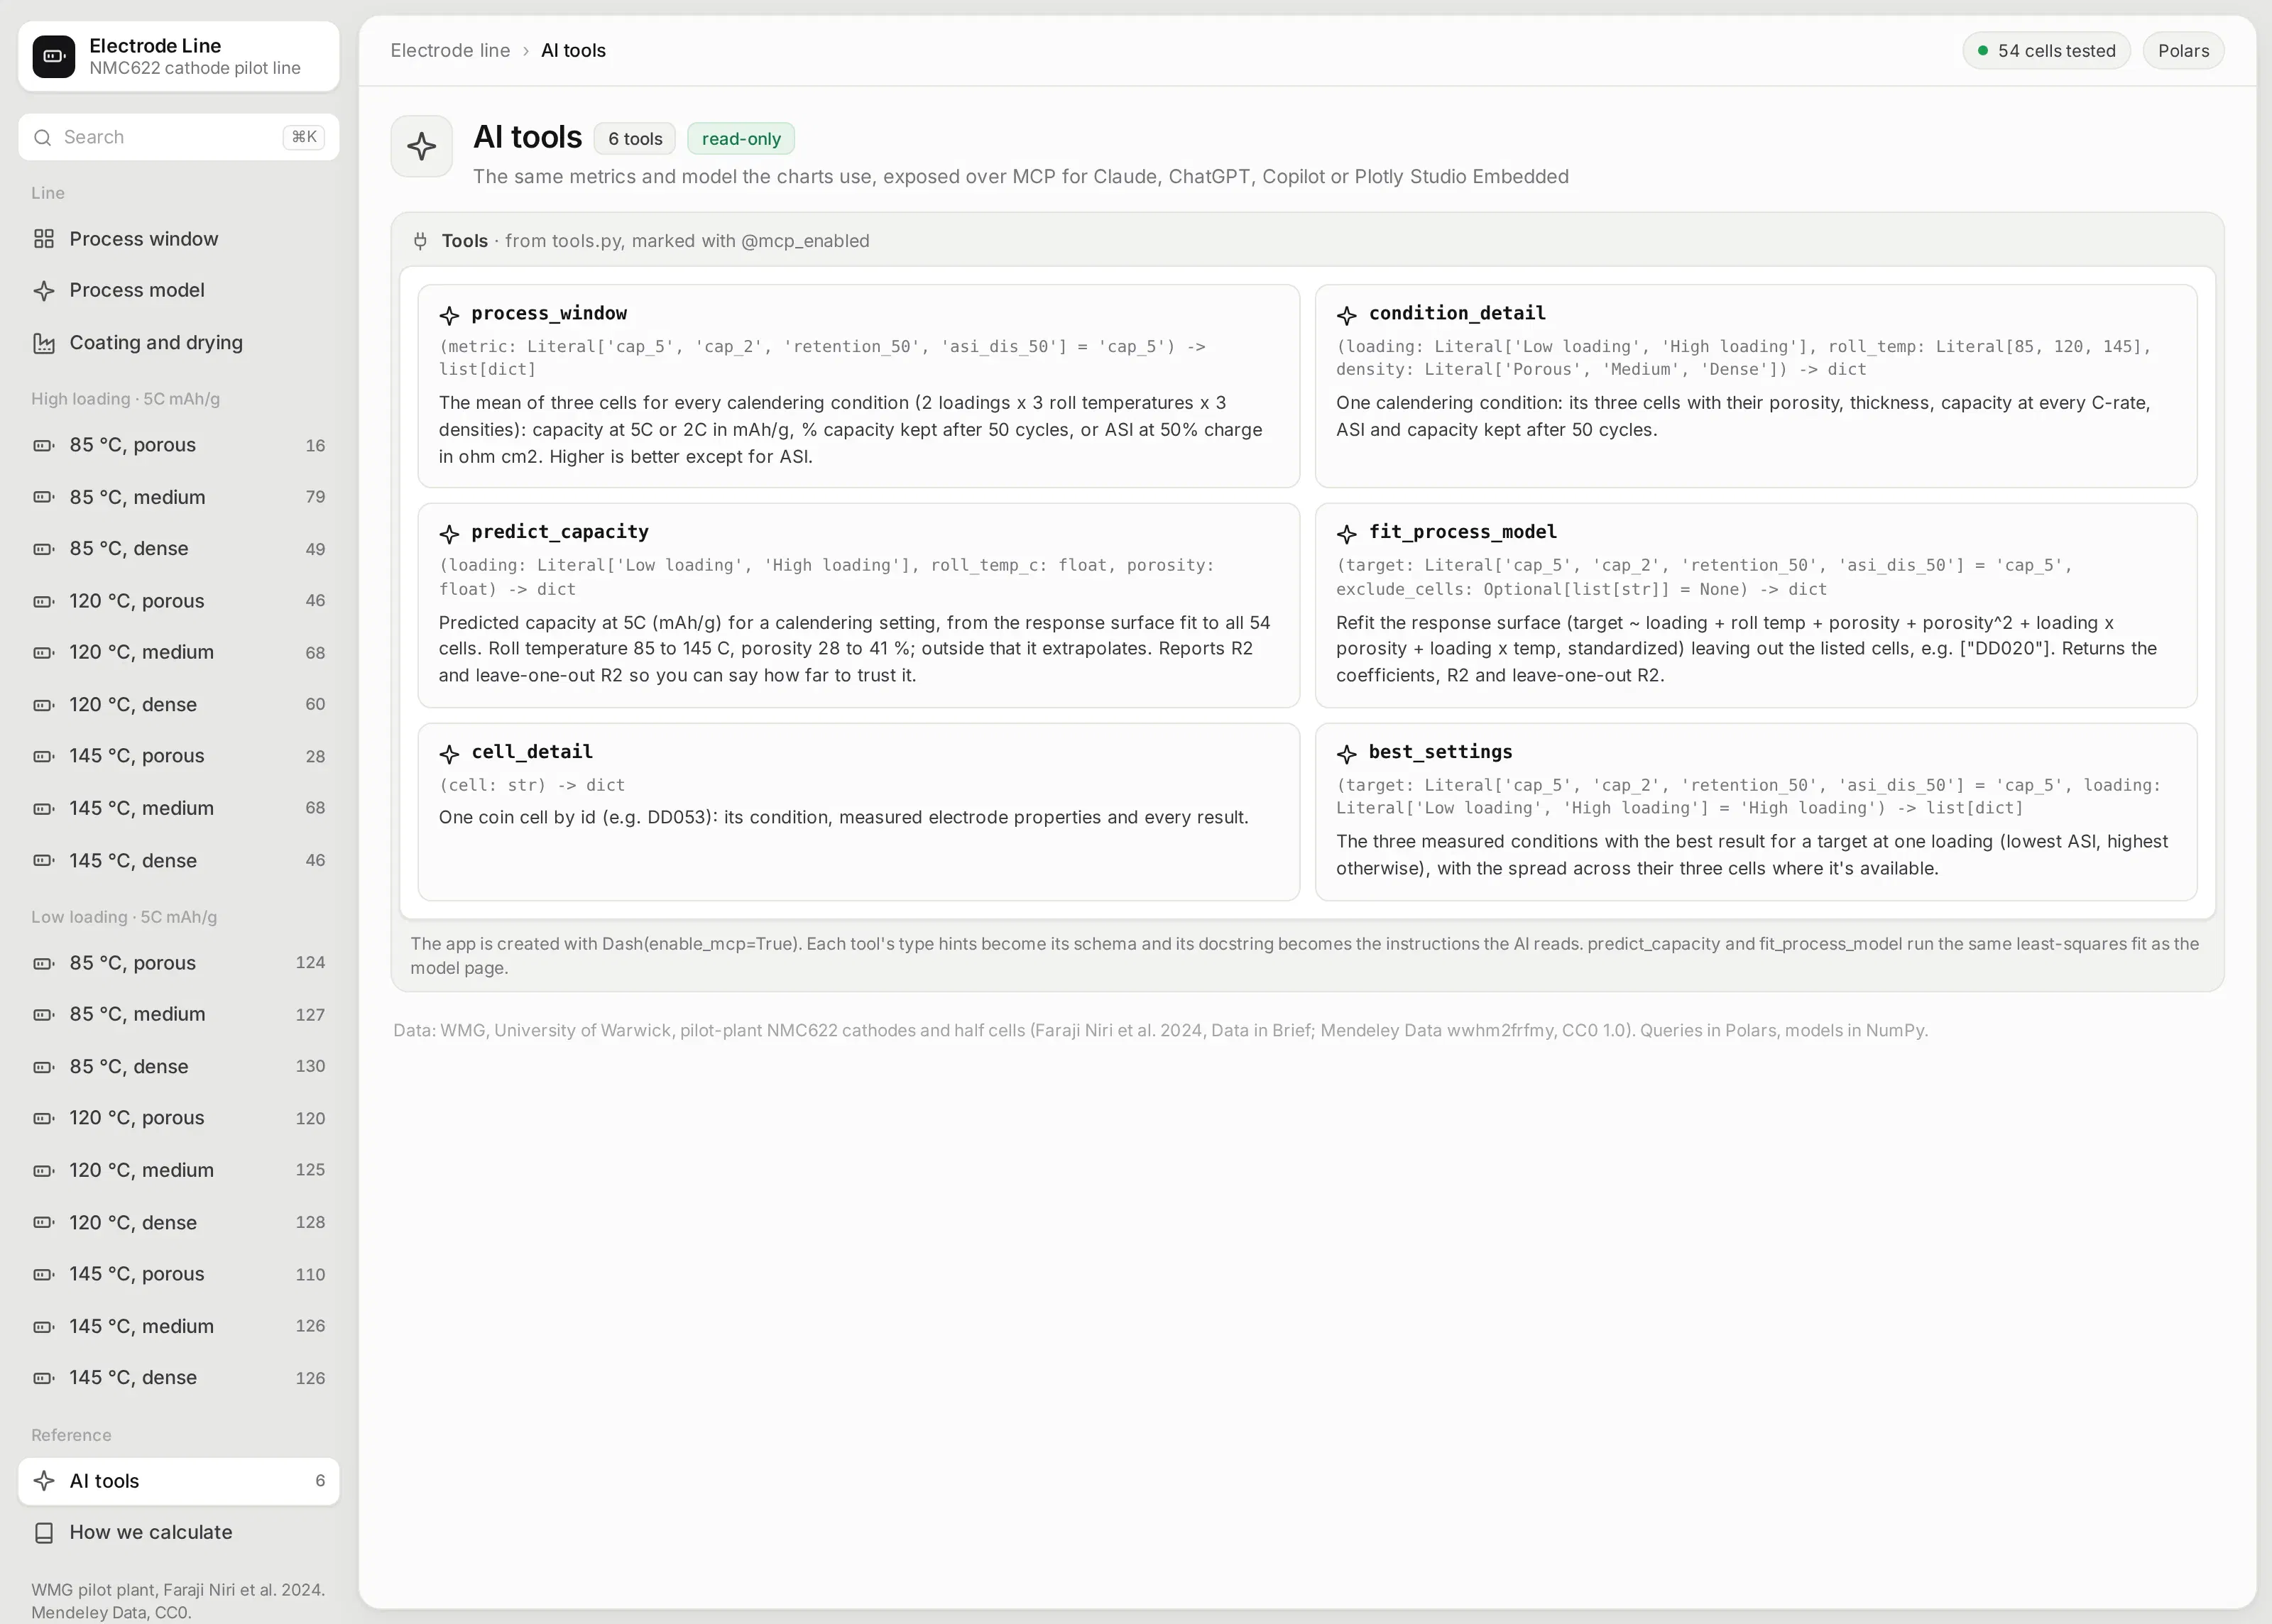
The app is also an MCP server. Six of its Python functions are marked with @mcp_enabled, so an AI agent connected to the app can ask for the best calendering settings at high loading, look up one cell, or get a capacity prediction for a setting nobody tested, and get the same numbers and model the pages use. Each tool's type hints become its schema, and its docstring becomes the instructions the agent reads:
@mcp_enabled(expose_docstring=True)def predict_capacity(loading: Loading, roll_temp_c: float, porosity: float) -> dict:"""Predicted capacity at 5C (mAh/g) for a calendering setting, from the response surface fit to all54 cells. Reports R2 and leave-one-out R2 so you can say how far to trust it."""m = B.fit("cap_5")return {"predicted_mah_g": round(B.predict(m, loading, roll_temp_c, porosity), 1),"r2": round(m["r2"], 3), "loo_r2": round(m["loo_r2"], 3)}
Ask it inside the app with Plotly Studio Embedded
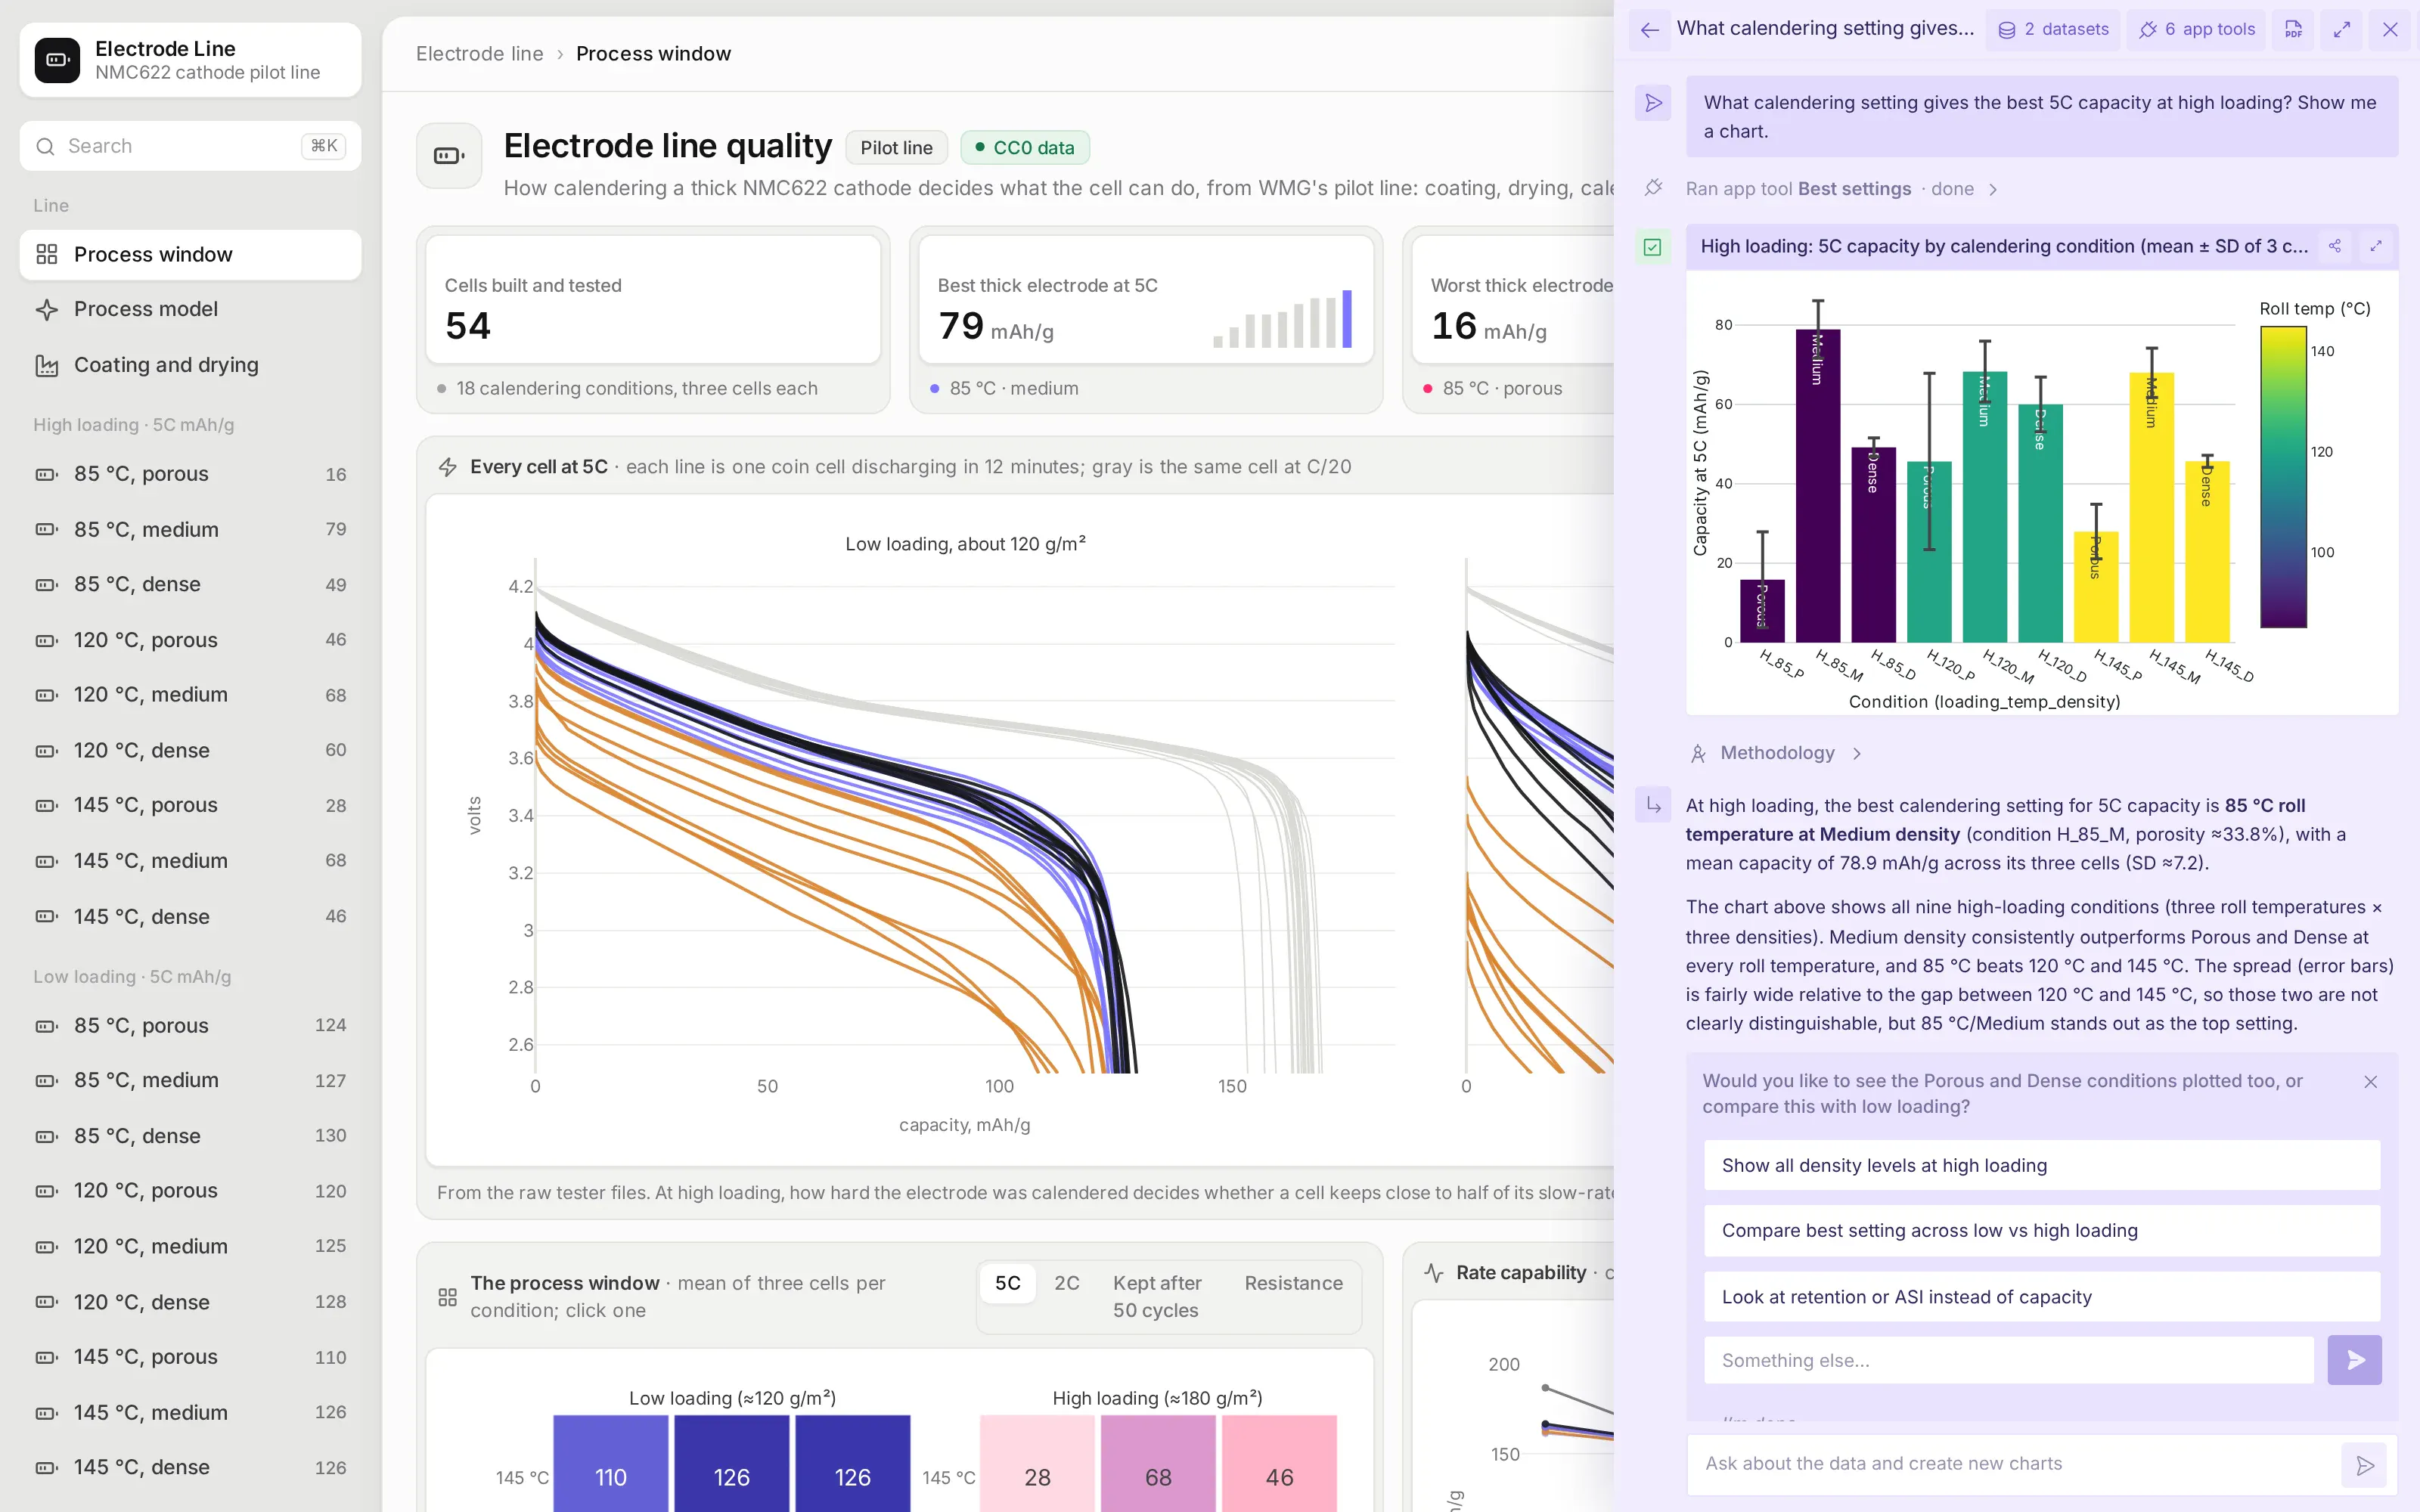
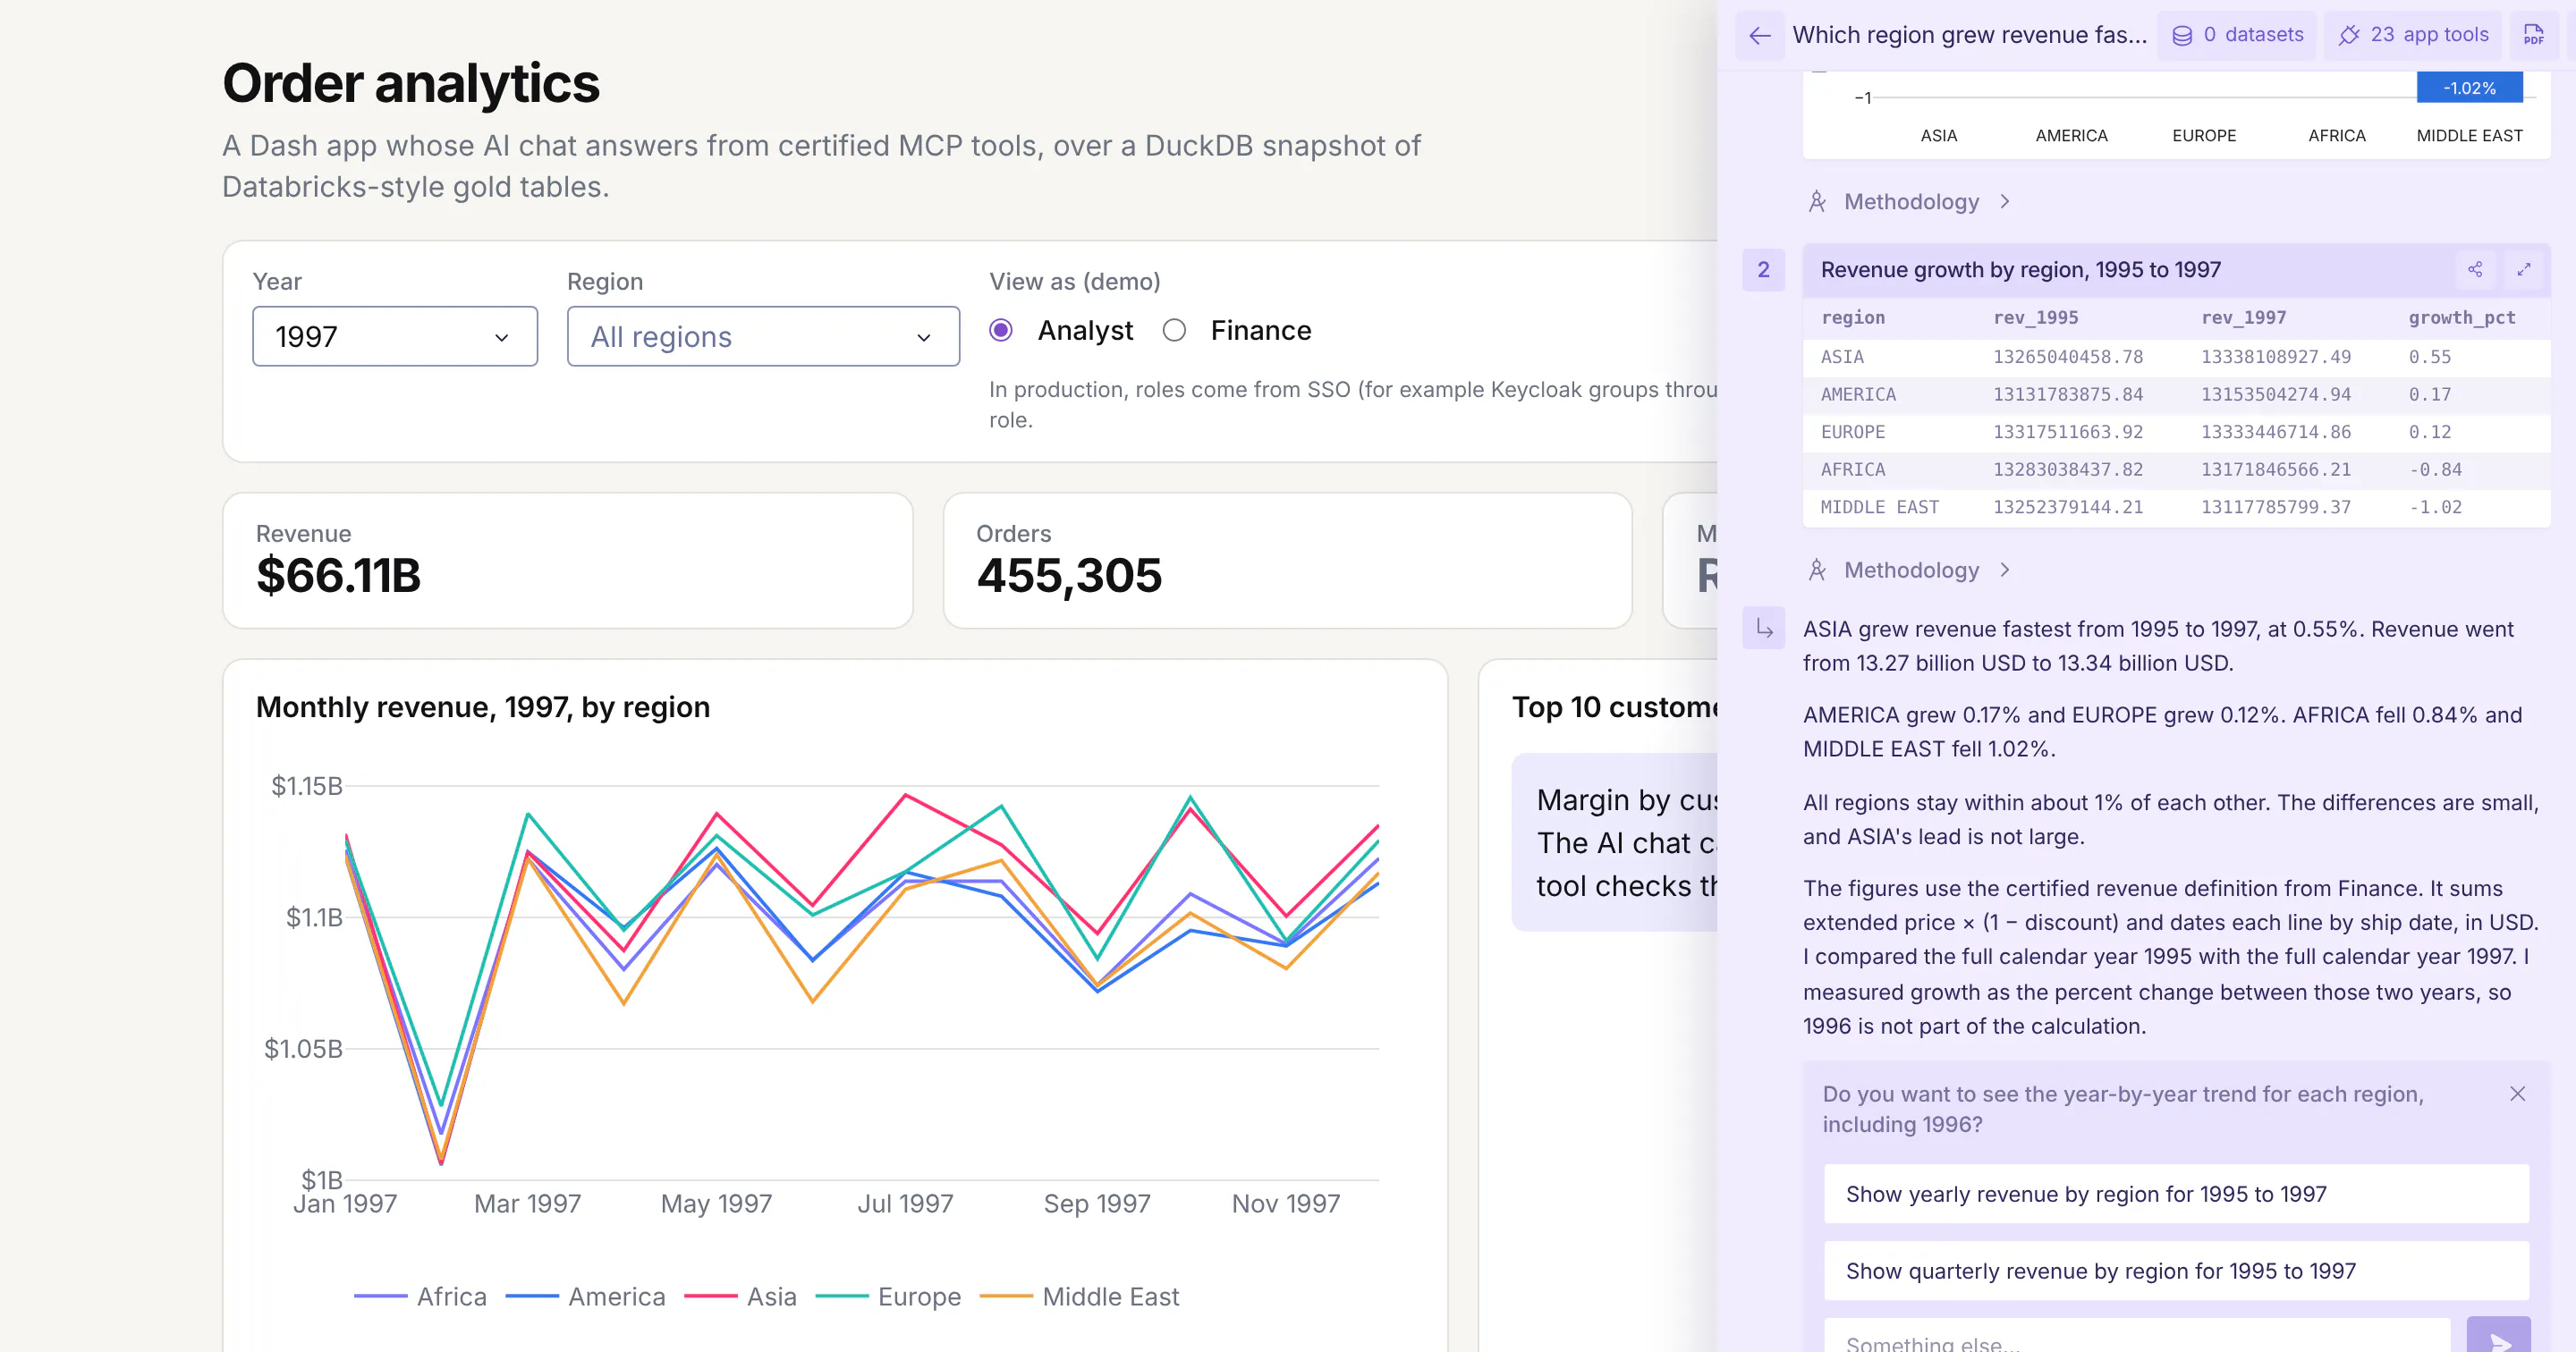
On Plotly Cloud you can switch on Plotly Studio Embedded, a chat panel that sits on top of the app and calls the same tools. Asked what calendering setting gives the best 5C capacity at high loading, it ran the app's best_settings tool and drew the chart from what the tool returned, so its numbers match the app's own pages.
Studio Embedded is available on Plotly Cloud now and comes to Dash Enterprise in Q4 2026. Every answer has a Methodology link that shows the tool calls and code behind it.
See how every number is defined
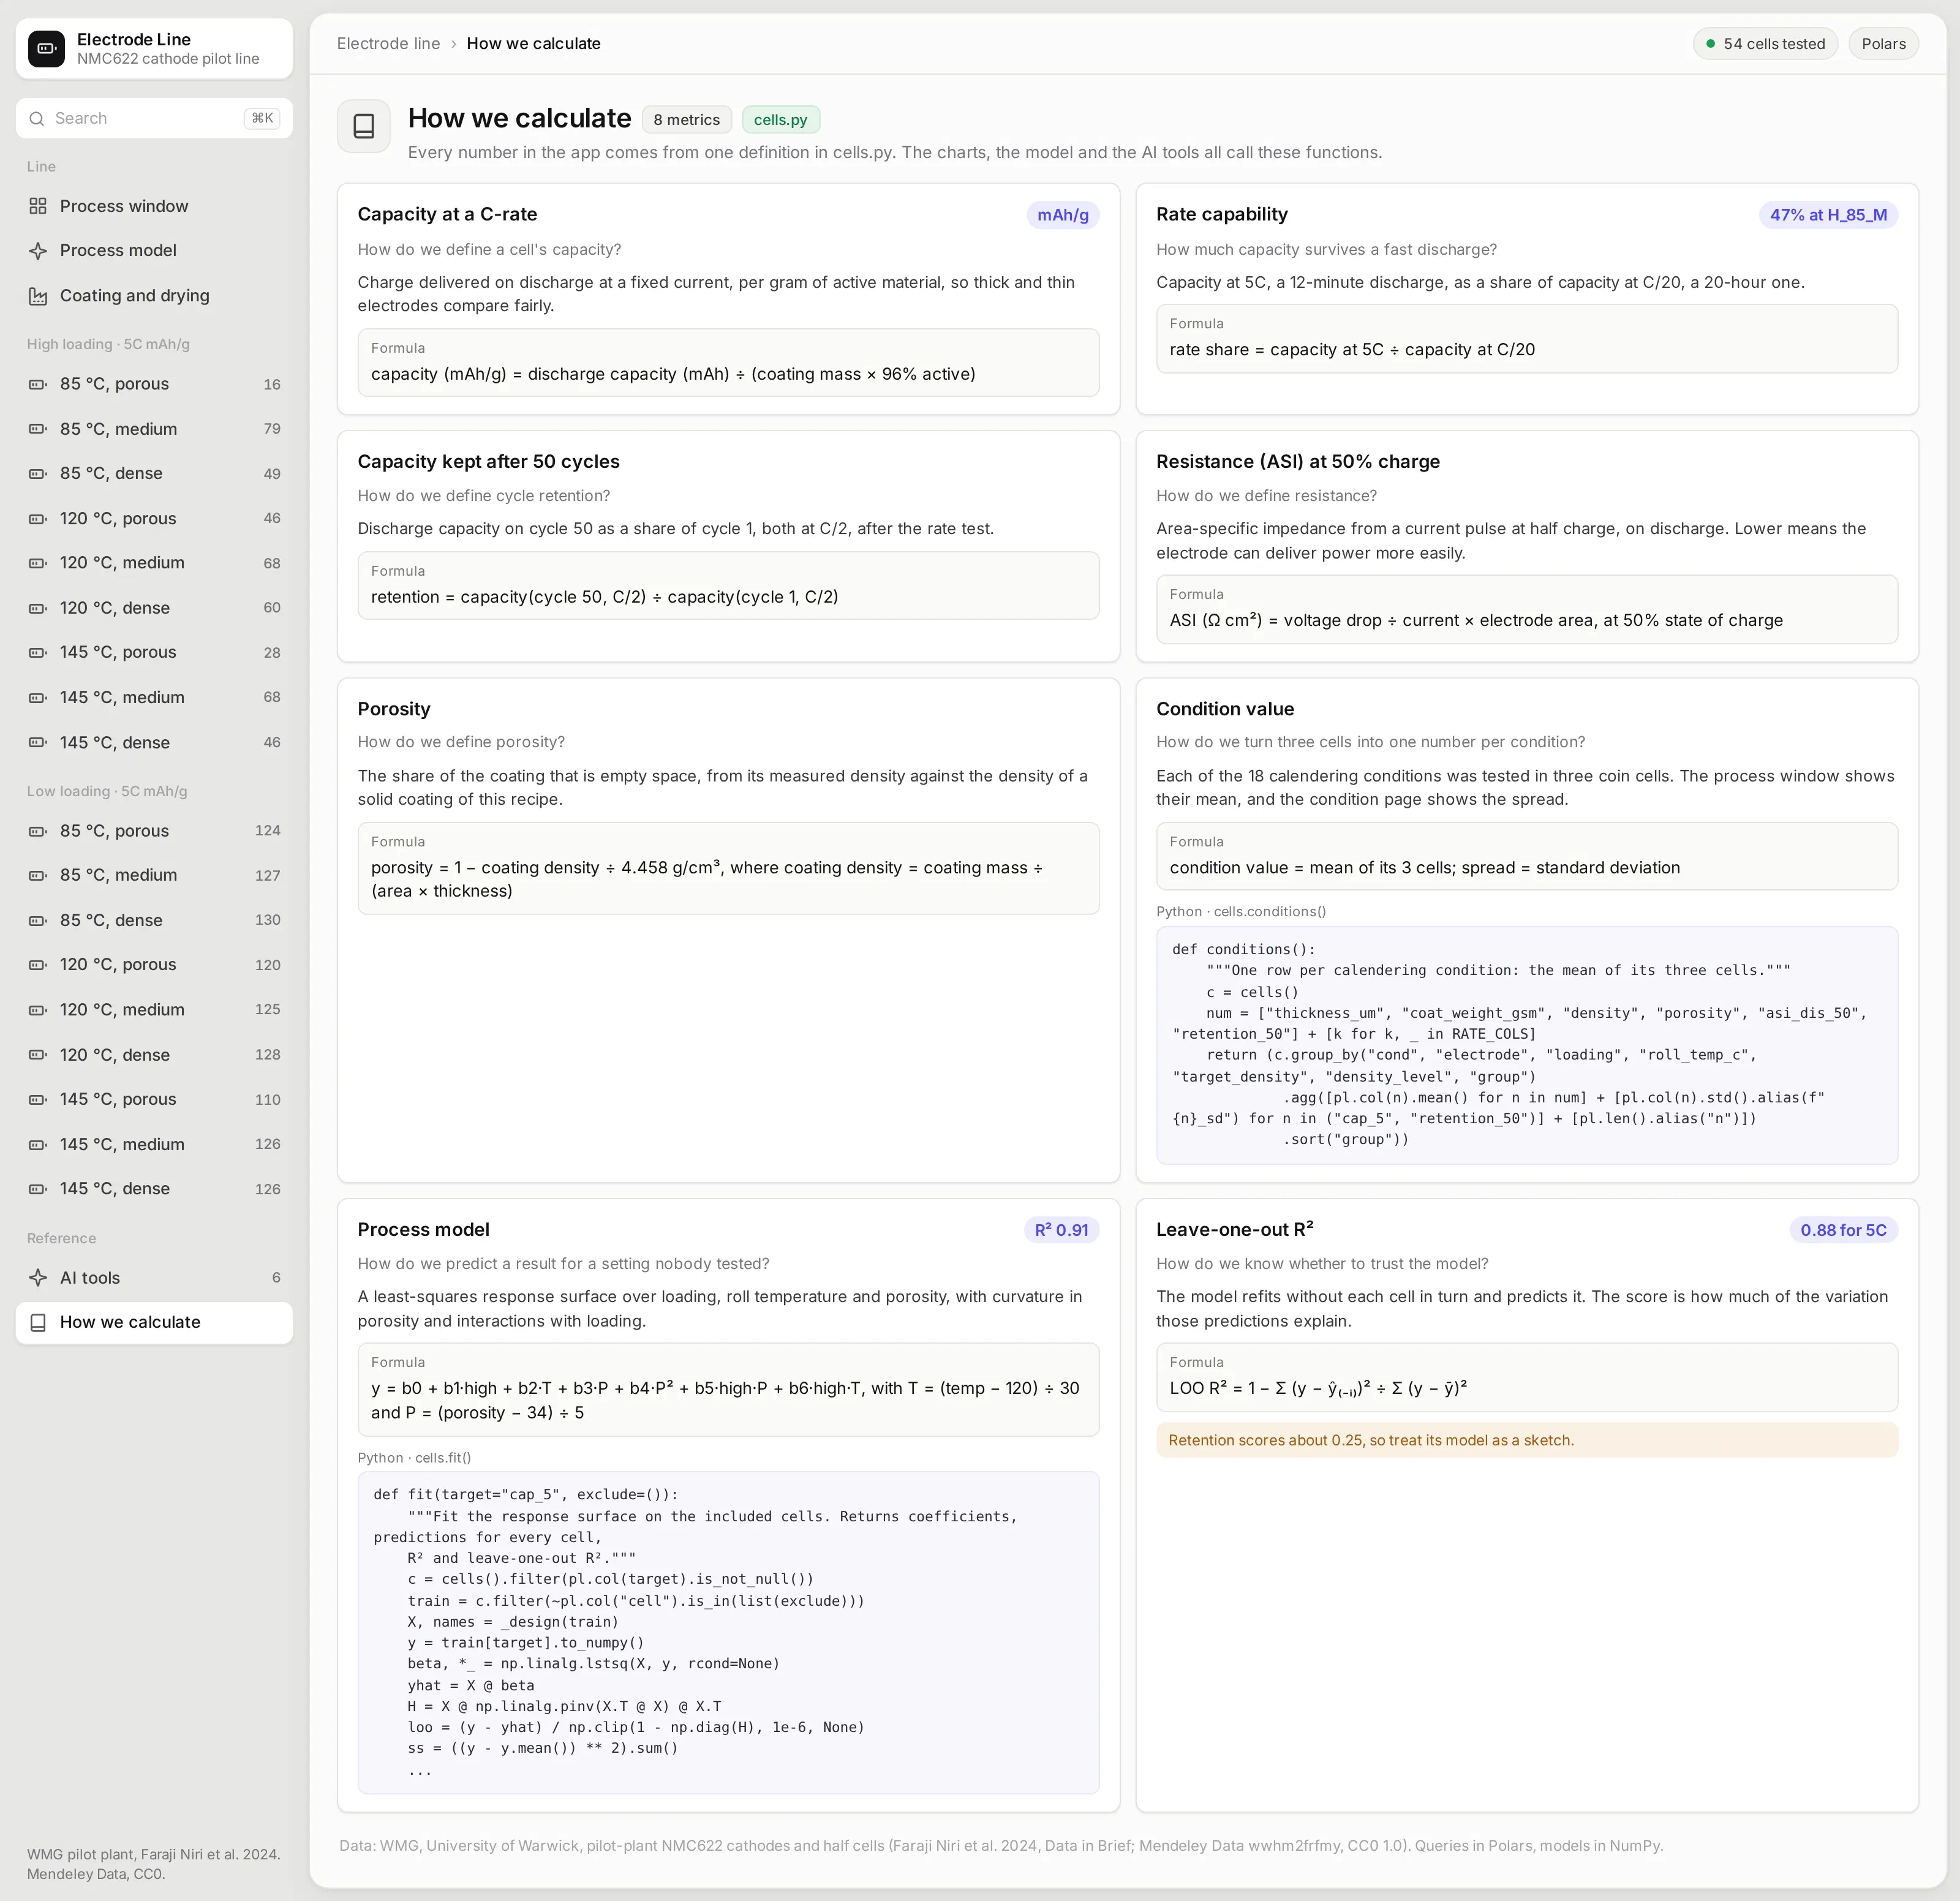
The How we calculate page is the app's semantic layer. Each card answers one "how do we define" question, such as how porosity comes from the measured coating density or how three cells become one condition value, with the formula and the Python function that computes it.
Those functions are the only definitions in the app. The charts, the process model, and the AI tools all call them, so a number means the same thing wherever it shows up.
What else could you add?
The prompt is a starting point. These are the kinds of things teams usually ask for next, and each one is a sentence or two more in the prompt:
- Read from your line's historian and your cell test database instead of public files, and refresh as new cells finish testing
- Add statistical process control charts for coating weight and thickness, with alarms when a roll drifts
- Trace each cell back to its roll, coating batch, and slurry, and compare lots
- Fit a model for cycle life on early-cycle data, and flag cells that are likely to fail early
- Expose the metrics and the model as MCP tools, so an AI assistant can answer "which calendering setting gives the best 5C capacity at high loading?"
How is this different from Spotfire and other BI tools?
If you're comparing Spotfire alternatives or other BI tools, the main differences come down to five things:
- With AI, apps like this can be built quickly and cheaply by anyone, including the process and cell engineers who know the data best.
- The apps are backed by code, which you can version control, manage, and update more easily than a fleet of point-and-click dashboards, especially when AI is making the changes.
- The apps can go much further than a traditional BI tool, with multiple pages, write-back to databases, custom simulations, models that refit live, AI chart building inside the app, MCP endpoints, and more.
- You have full control over the app: the look and feel, the controls, filters, and buttons, and every computation. You aren't fighting a tool to get what you want.
- The apps can connect to several data sources at once, and to the other systems your team already uses.
How long did it take to build?
About 10 minutes of agent time. Claude Code (with Claude Opus 5.5) downloaded the public dataset, read the coater, dryer, and gauge logs and the raw tester files, built the app and the model, ran it, took screenshots, and fixed what looked wrong in them, all from one prompt.
Along the way it caught that the gauge's readings don't match the coating weights in absolute terms, so the uniformity map shows each reading relative to its scan rather than in grams per square meter.
The prompt
Paste this into Claude Code, Codex, Copilot, Cursor, or another coding agent, in an empty folder. Swap in your own data source and the features you need.
Build a Dash app for battery electrode line quality on WMG's public pilot-plant dataset for NMC622 cathodes, using Polars for every query and NumPy for the model.
Data
- Download the dataset from Mendeley Data (wwhm2frfmy, CC0) and save tidy Parquet files: one row per coin cell with its calendering settings, measured electrode properties, rate capability, resistance, and cycling; the cycling records; discharge curves from the raw BioLogic tester files; the coater and dryer logs; and the inline gauge scans.
- Check the cell count and the conditions against the dataset's own summary table before you build anything, and tell me what doesn't match.
Pages (each with its own URL, and the back button must work)
- Process window: KPI cards, heatmaps of a chosen metric for every calendering condition at each loading where a click opens the condition, rate capability curves, and a parallel coordinates chart of every cell.
- Process model: a least-squares response surface for a chosen target, a prediction for slider settings, predicted against measured, the model's terms, leave-one-out R², and a table where ticking cells leaves them out and refits.
- /condition/<id>: the three cells' discharge curves at every rate, resistance through discharge, and 50 cycles.
- Coating and drying: a uniformity map from the inline gauge and the dryer's zone temperatures, line speed, and tension.
- AI tools: expose the process window, condition and cell lookups, a capacity prediction, and the model refit as read-only `@mcp_enabled` tools, and list them on a page.
- How we calculate: a card per metric with the question it answers, its definition, its formula, and the function that computes it.
Design
- A gray page with an inset sidebar. Each card is a light surface with its title above a white inset panel for the chart or table. Inter everywhere. No chart toolbars.
Run it, screenshot every page at 1600x1000, and fix anything that overflows, looks empty, or doesn't match the numbers before you stop.
How do I run it on Dash Enterprise or Plotly Cloud?
Dash Enterprise runs Dash apps inside your own infrastructure, behind your firewall and even air-gapped, with single sign-on and access control for each app.
This app needs nothing special. It's a Dash app with a requirements.txt, and your coding agent can deploy it through the Dash Enterprise or Plotly Cloud command line.
Keep the Parquet files on a persistent filesystem so the app doesn't rebuild them after a restart. Point the app at it with an environment variable such as DATA_DIR=/data.
If you'd rather not run any infrastructure, Plotly Cloud hosts the same app for you. We tested this one there.
Tips and tricks
These are things we like doing when we build apps like this one.
- Ask for a page per thing. A page for each calendering condition, with its own URL, makes the app feel like a website rather than a report, and lets people share exactly what they're looking at.
- Keep the raw data one click away. Summary numbers start arguments that the raw discharge curves settle. Parsing the tester files took the agent a few lines of Python.
- Report how well the model predicts, not just how well it fits. Leave-one-out R² tells you which models to trust. Here it says the 5C capacity model is solid and the cycling model is a sketch.
- Let plain Python functions be your semantic layer. The condition means, the model, and its predictions are short functions you can read, test, and change, and so can the agent. Plain Python functions like these can become your semantic layer, one definition that every page, test, and agent uses.
- Have the agent look at its own screenshots. Asking it to fix anything that overflows or looks empty catches most layout problems before you see them.
- Wrap your Python functions in @mcp_enabled. Turn on enable_mcp=True in the Dash(...) call and mark the functions with @mcp_enabled, and chat agents like Claude, ChatGPT, or Copilot can call them over MCP and get the same numbers the app's pages show.
- Switch on Plotly Studio Embedded. The same tools power Plotly Studio Embedded, an AI chat inside the app that answers questions with charts and tables built from your functions. It's available now on Plotly Cloud (in beta) and is planned for Dash Enterprise in Q4 2026.
FAQ
See what Dash Enterprise and Plotly Cloud can do for your team
Our customers in energy, pharma, finance, and manufacturing are building apps like this one with coding agents and running them on Dash Enterprise behind their firewall or on Plotly Cloud. Request a demo and we'll show you how it works for your team.