
Martha Cryan
February 07, 2025
Cutting Render Times in Half: Inside Plotly’s Latest Performance Update
New features in software projects often require weeks, months, or years of development before they’re ready to be distributed to end users. This January, we released one such feature: typed array support in Plotly.js. This feature was originally proposed and prototyped in August 2018, and in 2020 our own Mojtaba Samimi started a new effort to bring typed array support into Plotly.js. This pull request was iterated on for two more years before finally being integrated in January 2023.
At long last, the beautiful ✅
What is typed array support?
But what is “typed array support”? In essence, it’s a technique for transferring data to the browser that preserves complex types, making it easier to move information from an application into the Plotly renderer with faster serialization and better compute and memory performance. The end result is to render Plotly charts with hundreds of thousands or even millions of points in notebooks and Dash apps much faster.
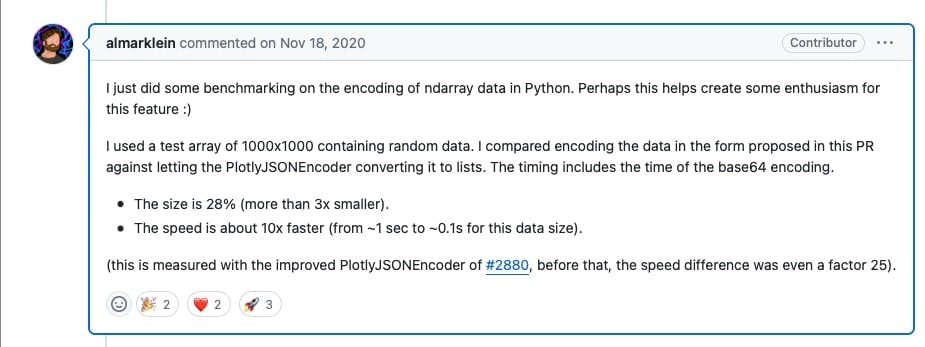
Community enthusiasm encouraged us to keep pushing the project forward.
However, without changes beyond those in Plotly.js, Python developers wouldn’t see the benefits. Fast forward to the summer of 2024, and we were finally able to build the other half of this project.
In order to give users a performance boost that only required pip install --upgrade ploty, we needed to dive into how charts are generated from Plotly.py and sent over to Plotly.js. Deep in the guts of the library, we modified the behavior of Plotly.py to automatically encode data as base64 before sending it to Plotly.js for rendering. This significantly reduces the size of the data being transmitted; while it takes the processor a few cycles to do the encoding, it pays off because CPUs are faster than networks. Encoding data also has a performance impact as rendering using typed arrays is much faster than rendering with the default PlotlyJSONEncoder.
In a development environment, the primary impact Plotly users will see is improved render times. A snappier response from the moment to execute a cell to the flash of light when you see a chart appear in the cell output. With these under-the-hood changes, developers don’t need to make any changes to their code to see these improvements.
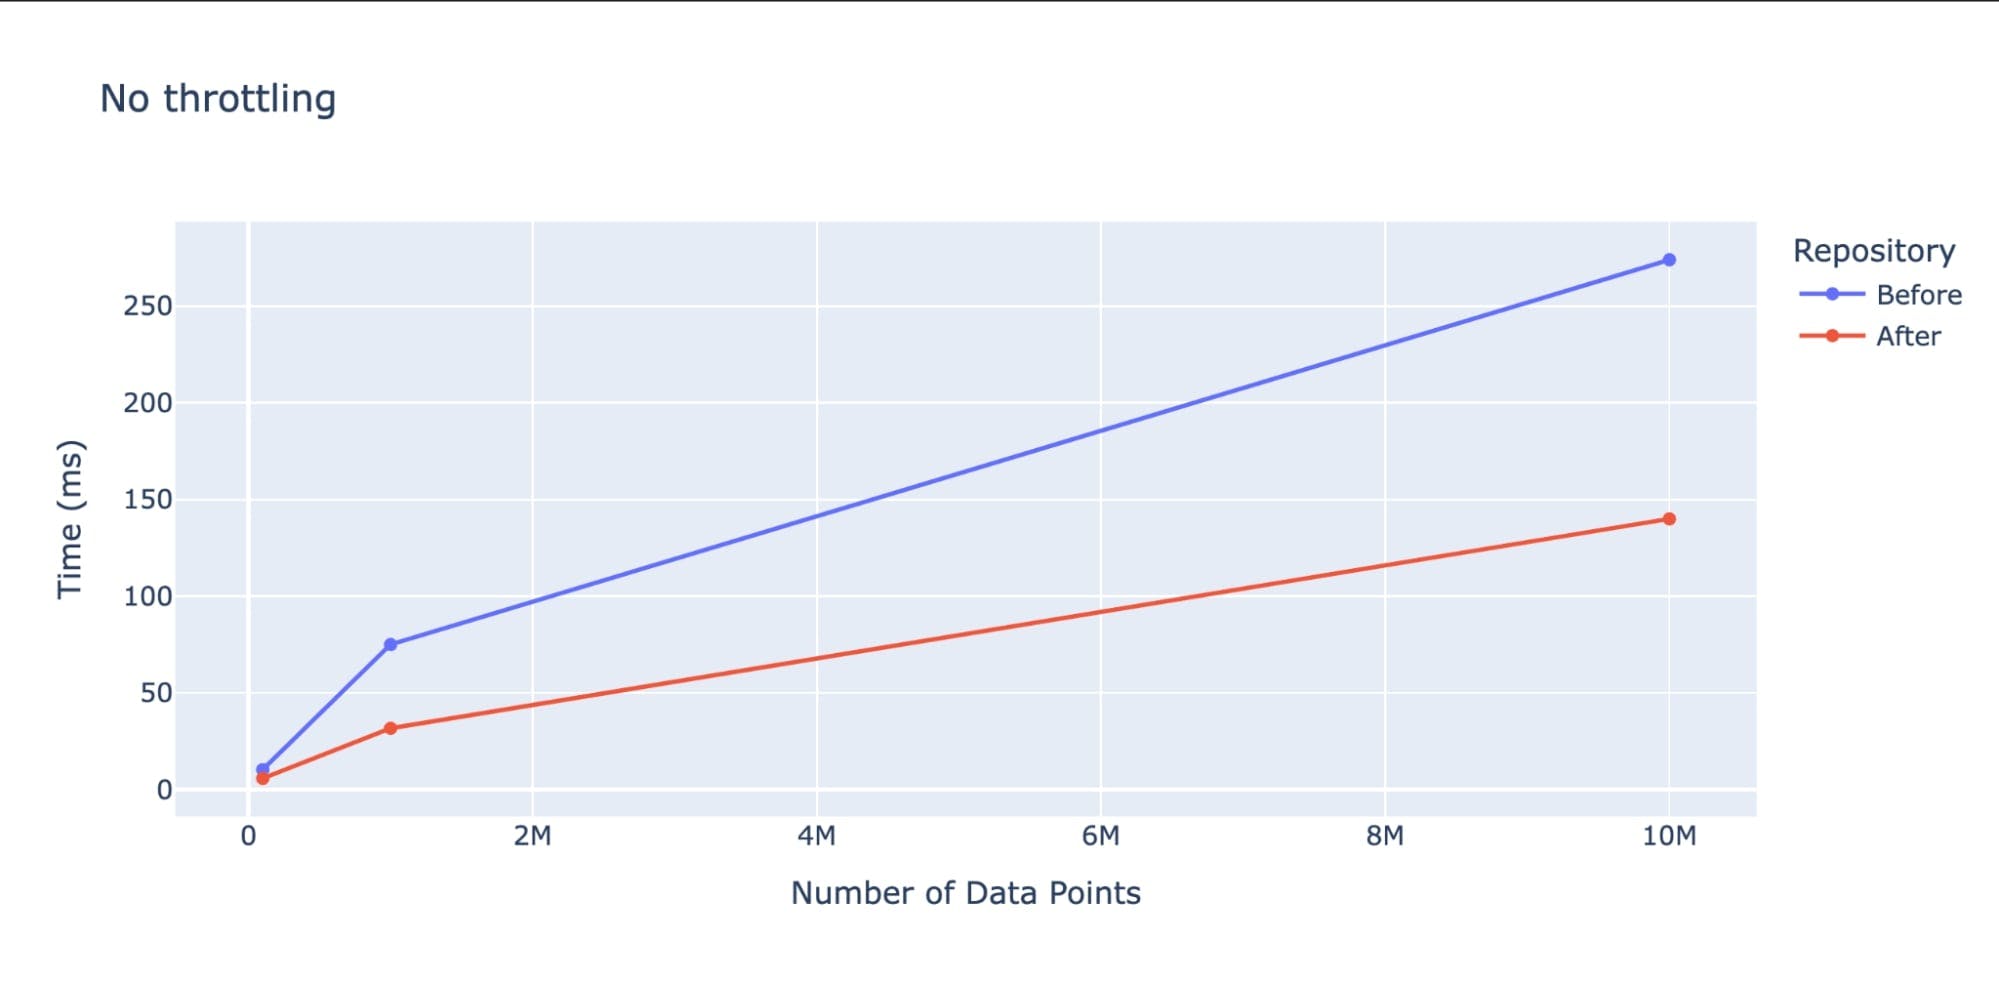
How typed array support improves rendering performance
Plotly charts have quick local render times today, but typed array support improves rendering performance in a local environment by 50%.
Better rendering speeds mean faster project iteration for everyone developing projects Plotly charts, no matter the environment.
This is a big deal: Plotly.py is a core part of developer workflows in big data environments, and in projects with many charts, improving rendering speeds means faster bug fixes, more experimentation, and, of course, happier users.
Typed array support is an even bigger deal in Dash. In a deployed Dash app, the Python process generating the data may be running in a data center far away from the computer of the person who’s actually looking at the dashboard, so compressing the data should have an even bigger payoff.
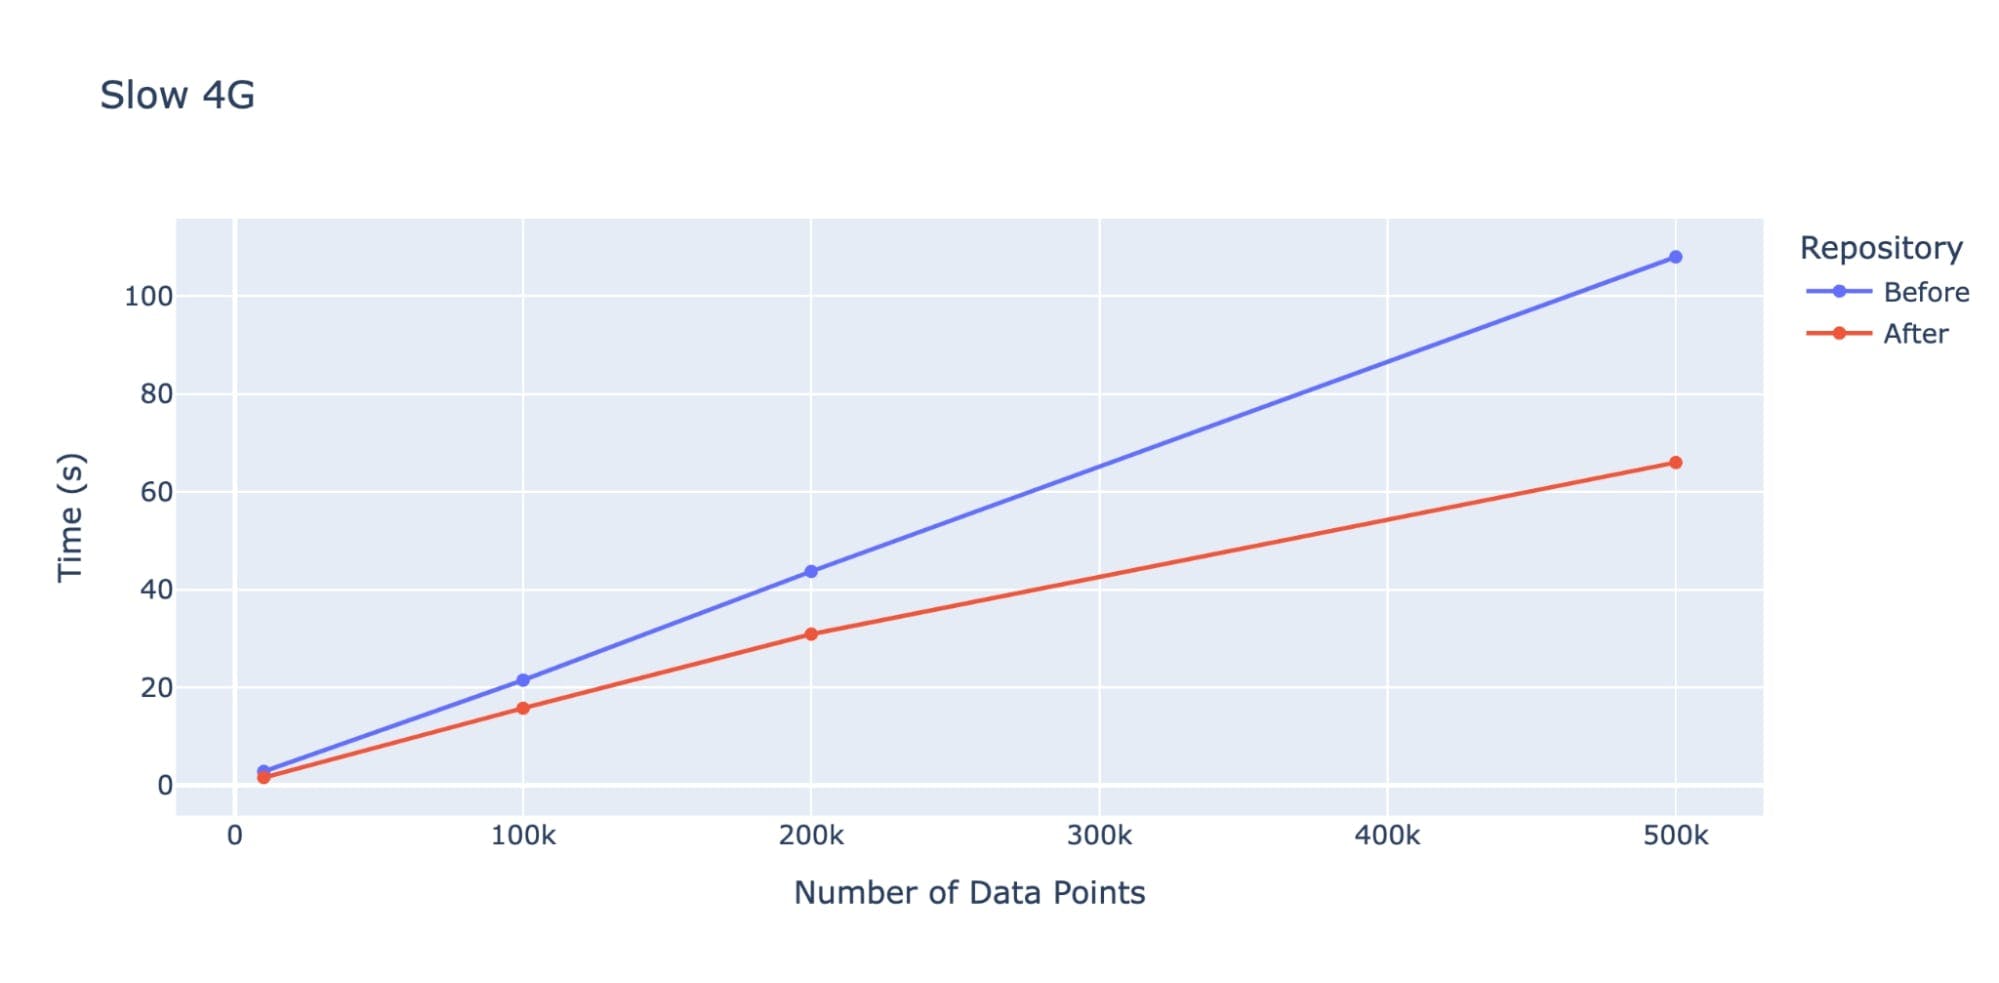
Benchmarking these changes proved to be a bit of a challenge because any physical network is likely to have other traffic on it, which would distort results. Instead, we used the developer tools in Chrome to throttle network speed in order to simulate faster and slower networks.
Our benchmarks confirmed this: with a 500,000 point dataset, we saw performance improve up to a massive 40 seconds when sending charts over a 4G network.
🤯
So, if you’re building Dash dashboards in apps you expect will be used over a cellular network, your end users will love you. And all you’ll need to do is pip install --upgrade plotly.
We’re still working on plenty of performance improvements to the graphing libraries — there’s always room to optimize. Beyond that, who knows: maybe there are other performance improvement projects hiding in our open PRs. Even better, maybe the next big performance improvement will come from you.