
Priyaanka Arora
April 24, 2025
AI vs BI in Analytics: What’s the Difference?
We’re seeing the lines blur between how data teams use the different solutions available for analytics and actionable insights from data.
Some BI tools now offer AI as a way to simplify smaller tasks when creating BI dashboards. On the other hand, AI has made it much more accessible to build impressive dashboards, reports, and even interactive apps that used to require deep coding skills.
As these tools evolve and team skill levels broaden, the distinction between uses for AI and BI starts to weaken. What’s the best way to extract what you need from data for your stakeholders?
This article aims to address those questions.
Defining AI and BI in analytics
Business Intelligence (BI) is both a discipline and a category of software used to interpret historical data through structured reporting.
Data analysts using BI software are focused on tracking and visualizing key metrics by collecting historical data, organizing it into dashboards, and enabling decision-makers to consume information. BI helps organizations answer the question, "What happened?" BI tools make it easy to surface trends in past data and standardize reports across departments. However, these dashboards are largely static and are best suited for high-level monitoring.
Artificial Intelligence (AI) is an evolving algorithmic stack; a collection of models and logic systems that learn from data and adapt over time.
AI involves building systems that can learn from data and make predictions or decisions without explicit instructions. In analytics, AI means using machine learning models to detect anomalies, forecast demand, optimize operations, and personalize user experiences. Generative AI in particular can also support data science workflows by generating code, visualizations, and insights directly in data apps, helping analysts move faster from idea to implementation. AI helps teams answer, "What will happen next?" or even "What should we do now?"
What’s the difference between AI and BI?
Let’s compare AI vs BI in practical terms, as both are different approaches to analytics. AI learns from data to automate decisions, while BI reports on past performance to guide strategy. AI adapts in real time through feedback and model-driven logic. BI relies on structured, historical data to create dashboards and summaries.
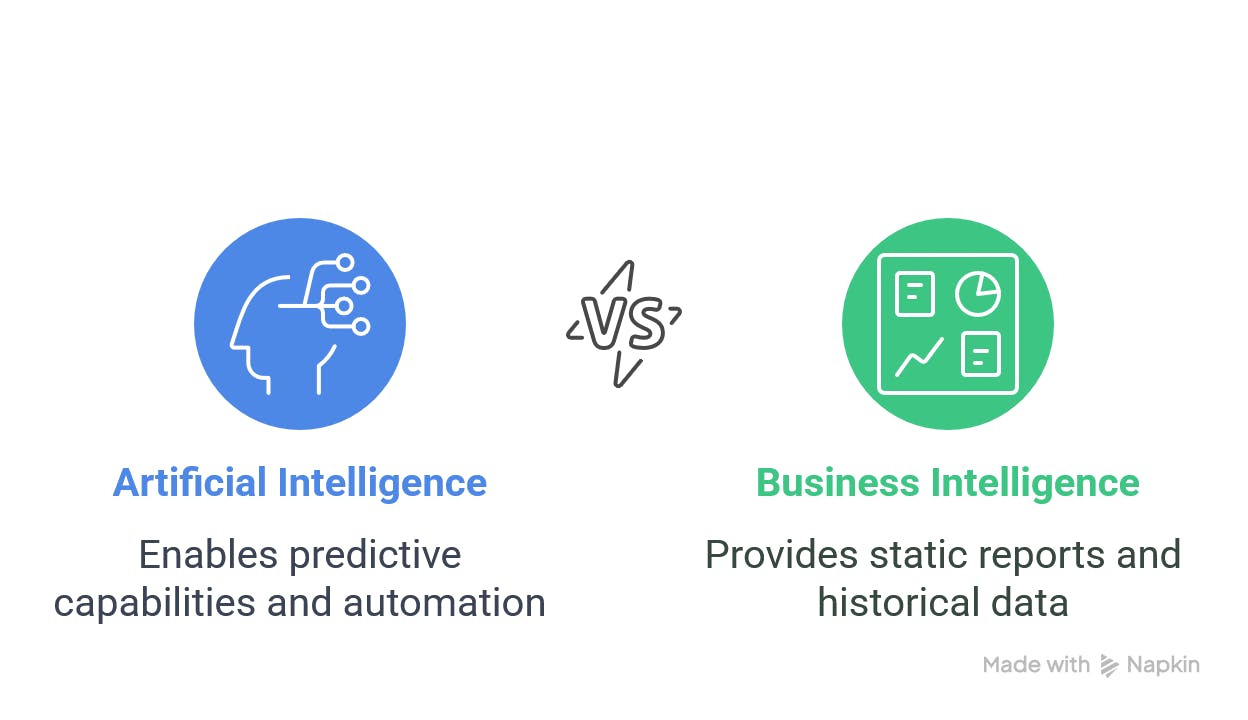
Understanding the difference between BI and AI is key to building modern, efficient analytics workflows that support faster decision-making and deeper insights. BI excels in environments where reports and dashboards are sufficient, such as financial overviews or metric recaps. As businesses seek more agile responses and proactive insights, AI becomes essential. It enables predictive capabilities, automation, and continuous learning.
By clearly delineating the strengths and limits of each, teams can avoid over-relying on outdated tools for problems that require forward-looking analysis. This clarity also helps organizations choose the right platforms and allocate resources more effectively, accelerating the shift toward data maturity and more integrated analytics ecosystems.
Comparison: AI vs BI
Here’s how the two approaches compare at a glance:
Feature
Business Intelligence (BI)
Artificial Intelligence (AI)
Focus
Historical data and reporting
Prediction, automation, and decision-making
Tools
Tableau, Power BI, Looker
Python, TensorFlow, Plotly Dash Enterprise
Interactivity
Static visualizations, inflexible user control
Fully interactive, logic-driven applications
Customization
Limited, fixed UI and charts
High, adaptable UI and model integration
AI integration
Surface-level or constrained by platform limitations
Core component
Output
Charts, KPIs, static PDFs
Forecasts, simulations, automated actions
Cost to scale
High, per-user pricing
Lower, especially with dev-based licensing
How AI and BI are used in analytics
BI is used to monitor what already happened. It’s most effective for recurring reports that require consistency and broad visibility across teams. Dashboards built in BI tools function as basic status boards. They provide leadership with curated views of sales performance, financial trends, or compliance metrics.
For example, a retail chain might use a BI dashboard to track regional sales week-over-week. A finance team might review quarterly performance using predefined charts built in Power BI or Tableau.
Typical BI use cases include:
- Executive dashboards showing monthly KPIs
- Sales performance reports by territory
- Historical cost trend analysis for procurement teams
AI is used in systems that need to respond and adapt. It’s used when analytics must go beyond observation and into prediction, personalization, or real-time automation. AI-powered models are often embedded inside apps or triggered by workflows, enabling context-aware decisions as conditions change.
A telecom company might use AI to predict churn and dynamically trigger customer retention offers. A logistics team could deploy AI to optimize delivery routes in response to weather, traffic, or demand.
Common AI-driven use cases:
- Predicting which users will convert, then surfacing offers accordingly
- Recommending optimal pricing based on competitor changes
- Auto-assigning customer support tickets based on intent and priority
AI takes analytics past dashboards into workflows, decisions, and action in real time.
Why BI tools struggle with AI
Tools like Power BI are beginning to integrate AI assistants like Copilot, but these are early-stage and not deeply customizable. Challenges include:
- Limited ability to fine-tune or retrain models to specific datasets
- Fixed visual components that restrict complex interactivity
- Disconnected architectures requiring extra steps to integrate ML workflows
- IT-heavy maintenance and governance workflows
Even when AI is added to a BI tool, it rarely becomes a core, fluid part of the user experience. It often feels bolted on, constrained by the dashboard framework. As a result, teams rarely see the ROI of AI, either avoid using AI features altogether or need extensive engineering support to make them work.
One example of this shift is at CIBC Capital Markets. The Quantitative Solutions group at CIBC moved beyond spreadsheets and restrictive BI tools by building custom data apps with Dash Enterprise. These apps integrate machine learning models and serve insights through interactive interfaces deployed across their intranet.
This shift enables their data science teams to deliver timely, scalable analytics tailored to both individual desks and cross-functional departments, something that wasn’t possible with spreadsheets or rigid BI tools.
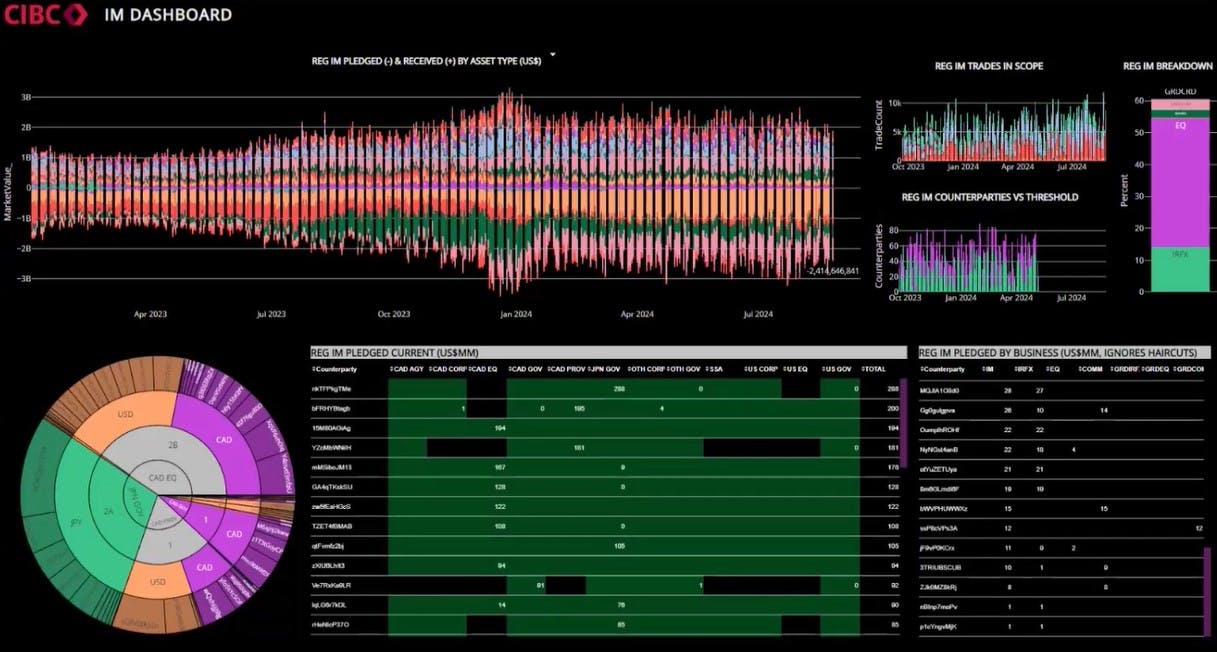
A risk management Dash app by the CIBC team
The better path: AI + data app platforms
Data app platforms like Plotly Dash Enterprise provide a more scalable, flexible alternative. These platforms enable analytics teams to build custom interfaces, integrate with live Python models, and push real-time predictions to users. Unlike BI tools, which license per end user, Dash Enterprise licenses per developer, supporting:
- Unlimited interactive apps
- Custom UX that matches brand and performance needs
- Full access to model logic and data pipelines
- Integration with enterprise authentication and monitoring
Plotly AI and data apps move beyond historical reporting. They solve real bottlenecks: enabling faster decisions, removing manual analysis steps, and closing the loop between analysis and action. For teams building modern data stacks, these capabilities are becoming essential.
If you’re evaluating the best AI tools for business intelligence, look beyond dashboards. Consider whether your analytics workflow needs to adapt to new data, take input from users, or run logic in real-time. If so, traditional BI won’t cut it.
To build real-time automation and analytics workflows, move past the constraints of dashboard-bound BI. Combine AI with data app platforms for flexibility, performance, and the potential to act. For more, read the paper: A smarter, faster way to build what BI never could.