
Nathan Drezner
Sept 6, 2024
Celebrating 500 Million (and counting!)
This week, Plotly.py, the Python distribution of our graphing libraries, reached an incredible milestone: 500 million lifetime package downloads from PyPi. The graph below shows data directly from PyPi visualized using a Dash data app — we use Dash here at Plotly to keep track of releases, tickets, and more in our open-source projects.
This is a Plotly Dash app used to track Plotly open-source downloads.
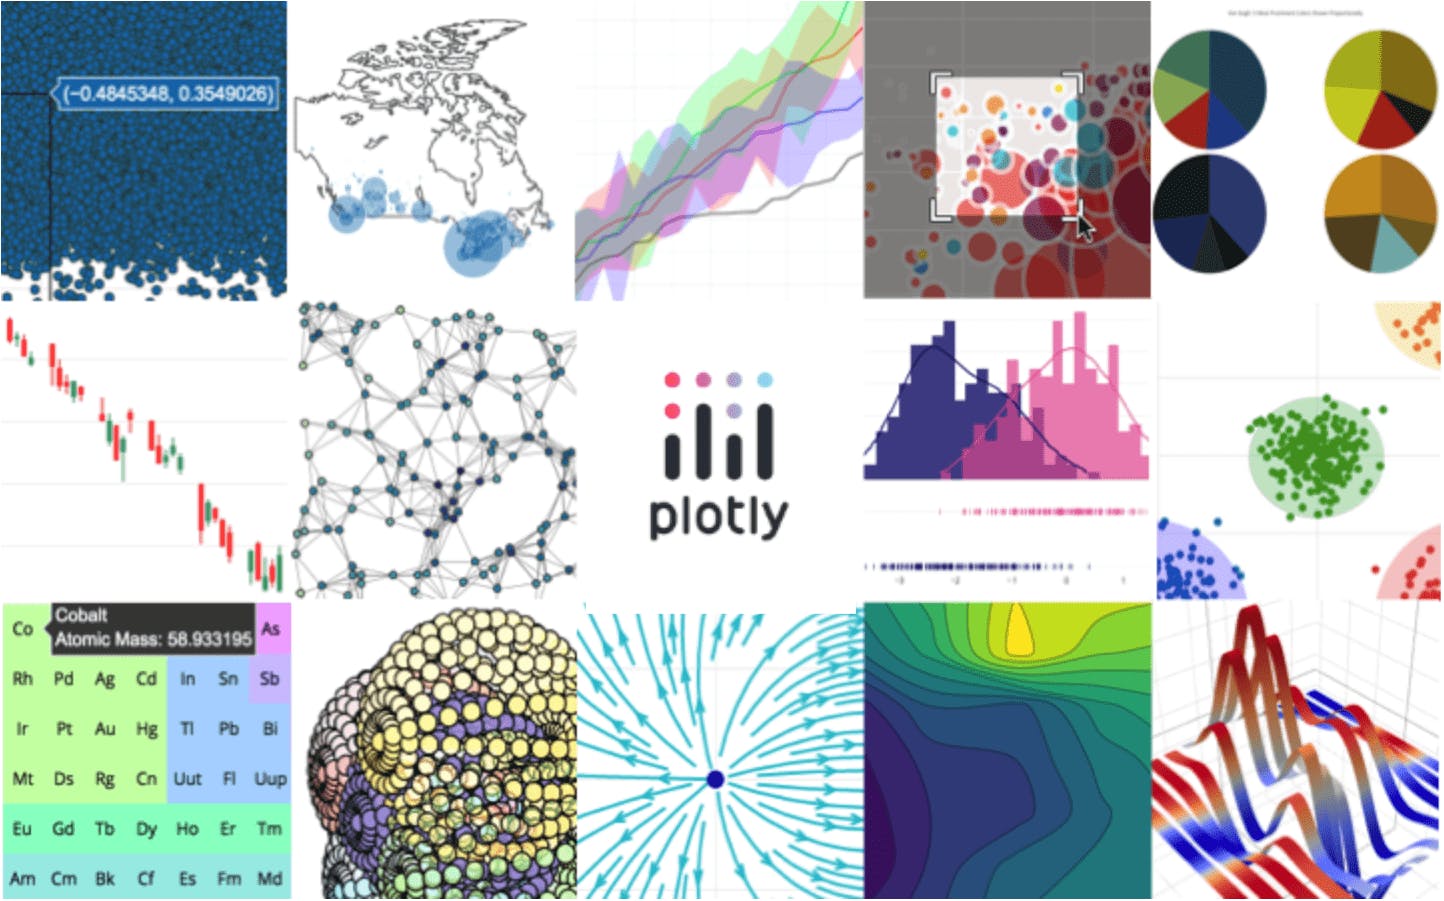
We’re proud to hit this milestone: our JavaScript charting library, Plotly.js, launched in 2013 and was made open-source in November 2015, and since then we’ve pushed more than 18,000 commits to that codebase. Plotly.js is one of the most popular JavaScript visualization libraries used by millions of companies, such as Databricks and Retool, for 3D charts, statistical graphs, SVG maps, and many other interactive graphing use cases. It’s been a monumental effort by the members of the Plotly team and of course, the many contributions from our community.
Plotly.py had its first release to PyPi in June 2013. Since then we’ve introduced many charting capabilities exclusively to the Python bindings for Plotly, most notably Plotly Express in March 2019. For a trip down memory lane, take a look at the original launch article for Plotly Express, which radically simplified the API for building charts from dataframes with a focus on terse expression. The Python bindings have since become the most popular way to interact with the Plotly graphing libraries.
Over the past 11 years, we’ve issued 298 releases of Plotly.py to PyPi and had more than 240 contributors provide documentation, features, bug fixes, and more to the open-source codebase on GitHub.
Here at Plotly, we’re continuing to work on exciting new features and changes for our graphing libraries: last week we launched a set of new charts that integrate MapLibre as the default map renderer for Plotly charts. You can learn more about this initiative in the announcement article for the latest releases of our graphing libraries. We have plenty more in store for folks who are looking forward to new features and capabilities for the libraries, including performance improvements with typed arrays, new traces, and more.
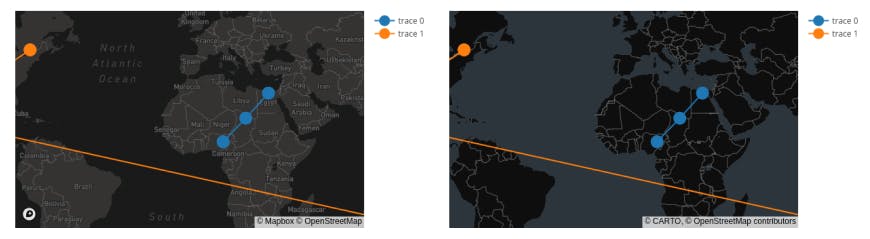
A side-by-side comparison of Mapbox vs MapLibre dark themes, supporting modern mapping standards.
You can help shape the future of these libraries by sharing your feedback in our recent community survey.
Of course, Plotly graphing libraries are only half the picture: Dash, our Python web framework for analytical data apps, has nearly 75 million lifetime downloads. Both of these libraries play great with Dash Enterprise, and are designed to integrate with each other: if you’ve been a Plotly developer since day one but have never taken Dash for a spin — well — it’s never too late 🙂.
If you’re curious to dig into the hundreds of releases, issues, pull requests, or look at the history of downloads of Plotly packages, we’ve put together a Dash app that allows anyone to drill into the details. It’s available on Dash Enterprise.
A big thank you to everyone who helped us reach 500 million downloads over the last decade. We can’t wait to see the incredible charts and visuals folks create as we hurtle forward to 1 billion downloads.