
Chris Parmer
November 19, 2026
10 Ways to Visualize Rainfall Data
TL;DR
- Downtown San Francisco had 2.64 inches of rain on November 18, 2026, beating the day's record of 2.24 inches from 1918, and five other Bay Area stations set records too.
- We charted the storm 10 ways with Plotly, using public NOAA, National Weather Service (NWS) and USGS data.
- A coding agent made all 10 charts, starting from a two-sentence prompt and a few rounds of feedback.
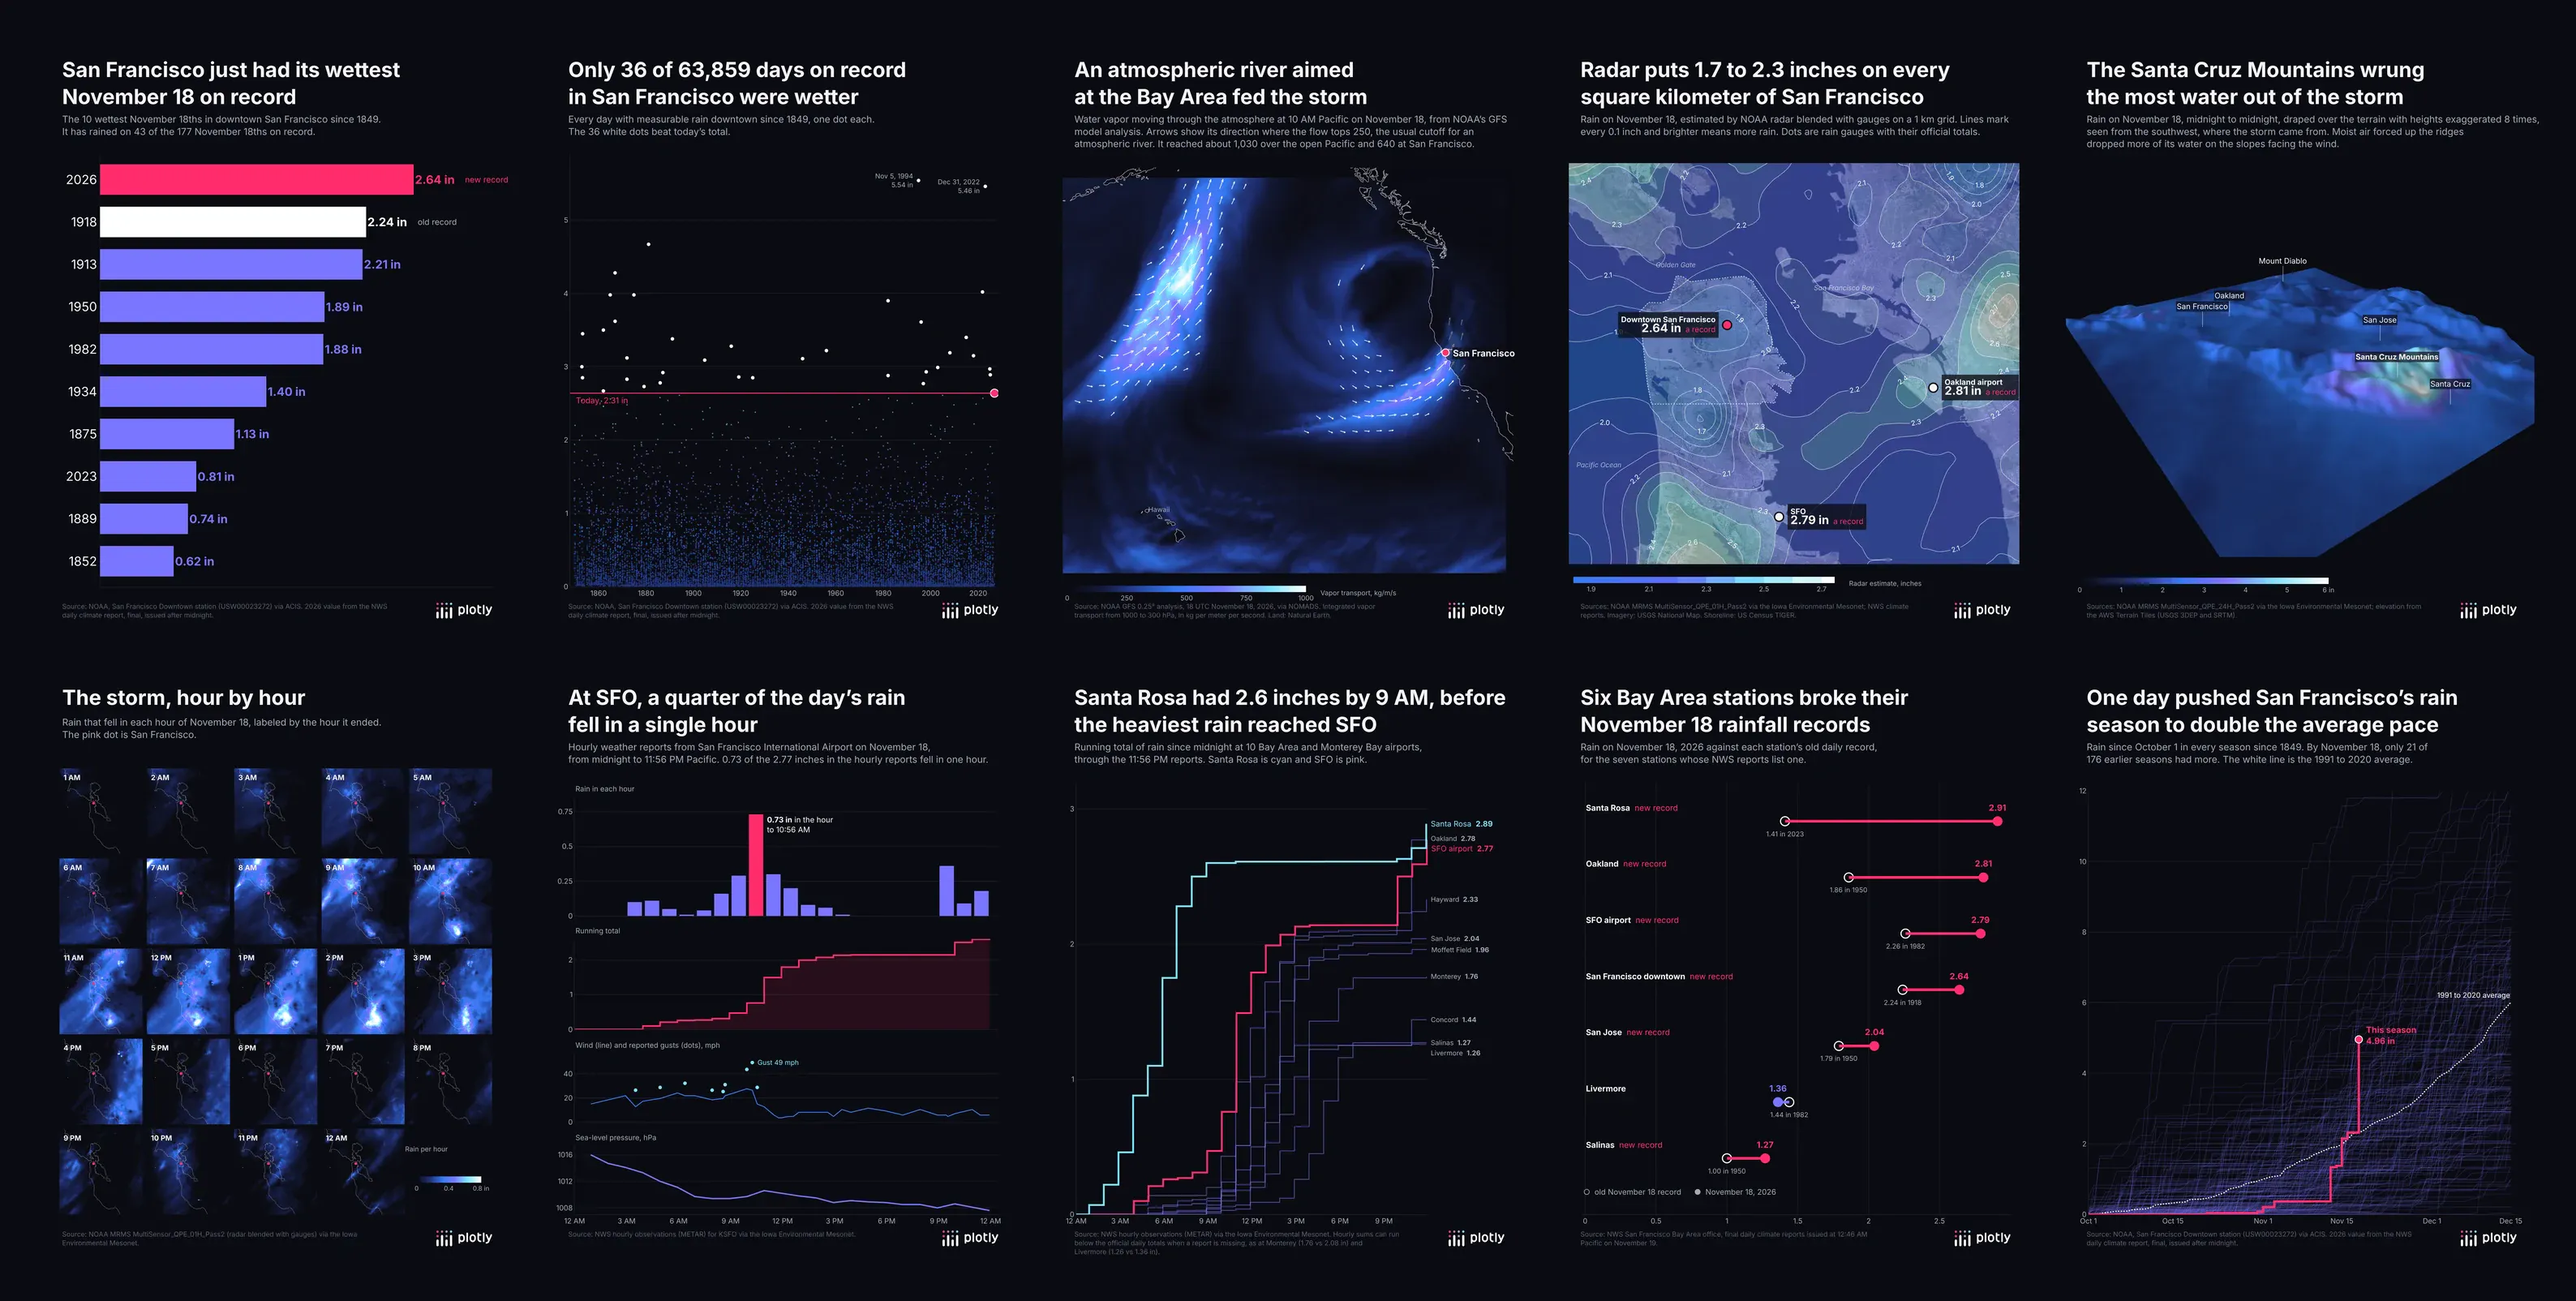
A storm broke a 108-year-old rainfall record in San Francisco on November 18, 2026. Rainfall data comes as long gauge records, hourly airport reports, radar grids and weather models, so here are 10 ways to visualize rainfall data from the same storm, one per shape.
1. The record, ranked
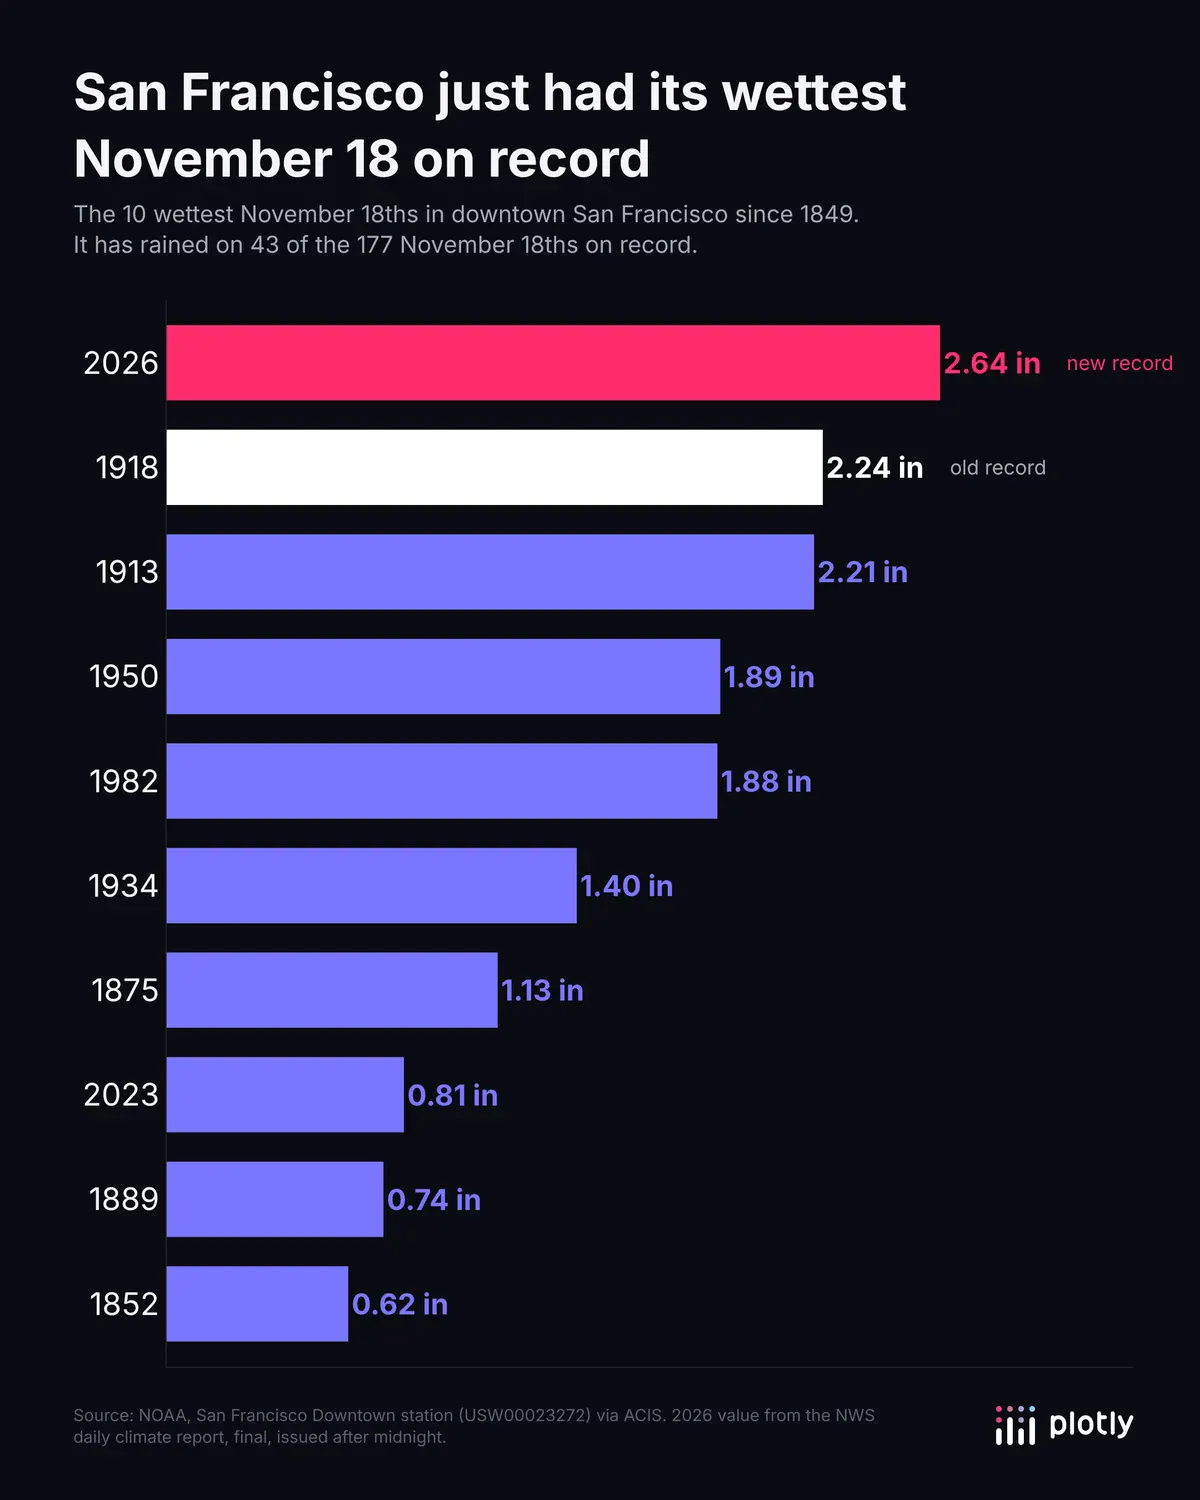
The 10 wettest November 18ths since 1849, as a horizontal bar chart. This year's 2.64 inches beat 1918's 2.24.
2. Every rainy day since 1849
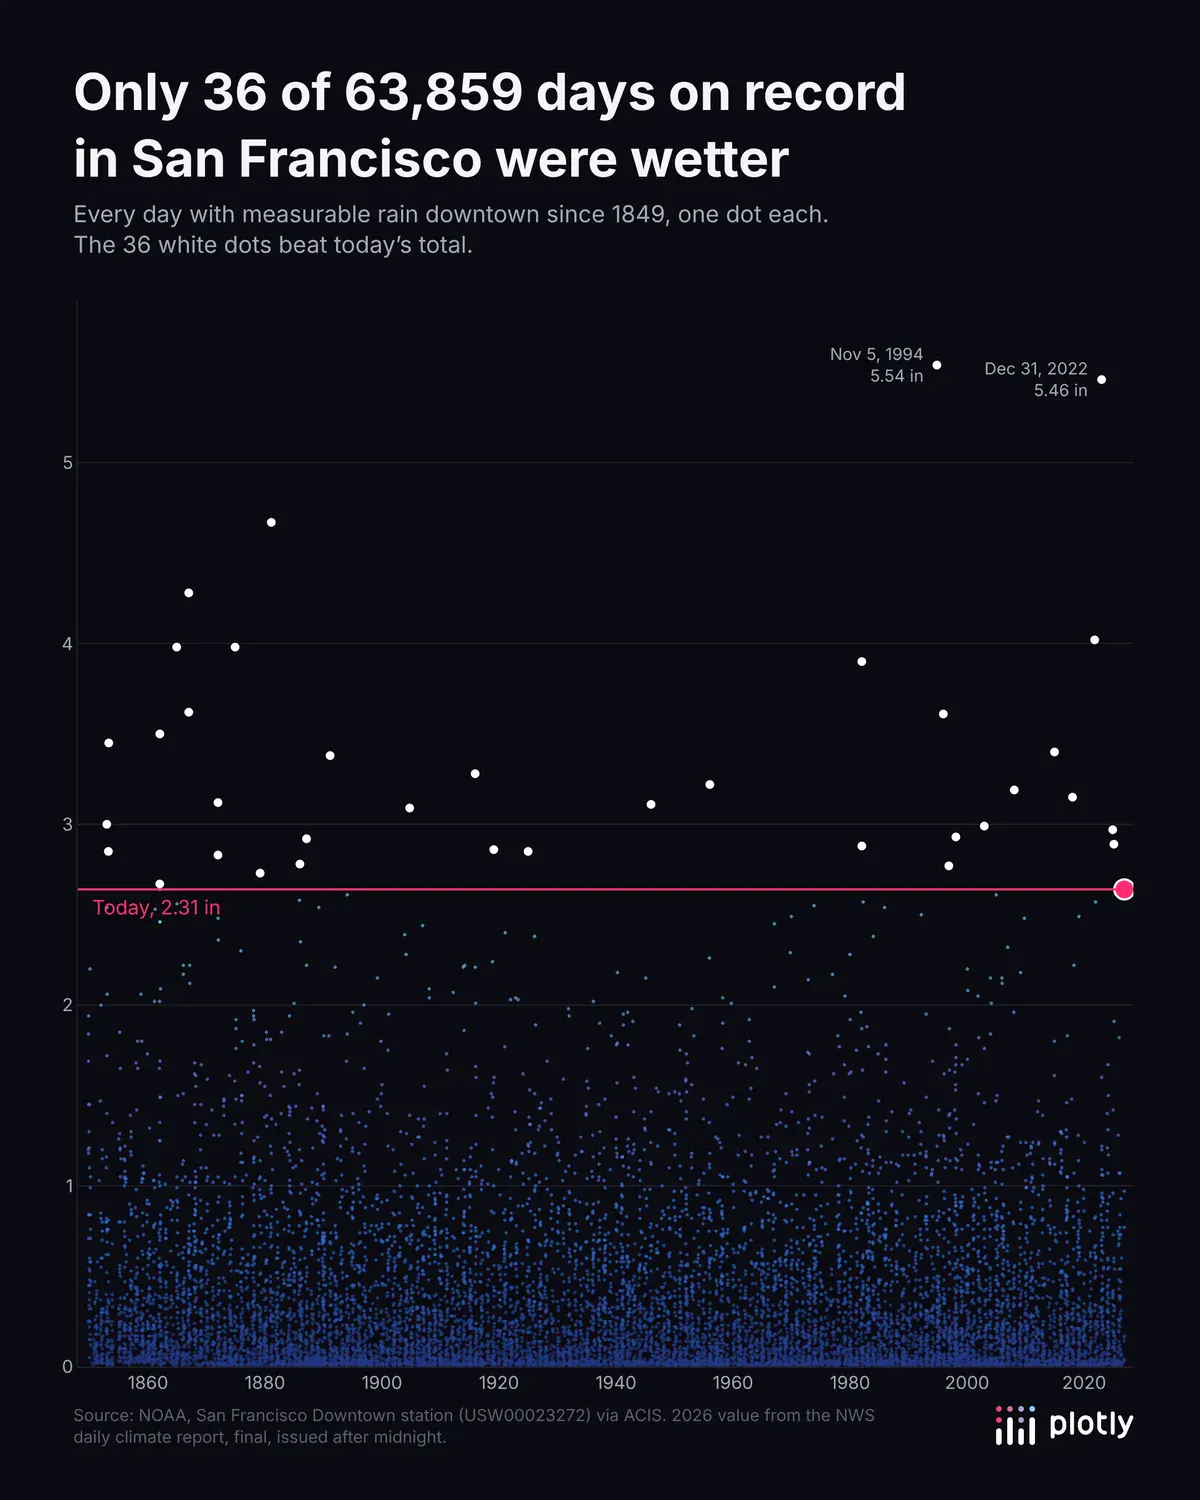
One dot per rainy day. Only 36 of 63,859 days on record were wetter, and WebGL keeps tens of thousands of points fast.
3. The atmospheric river
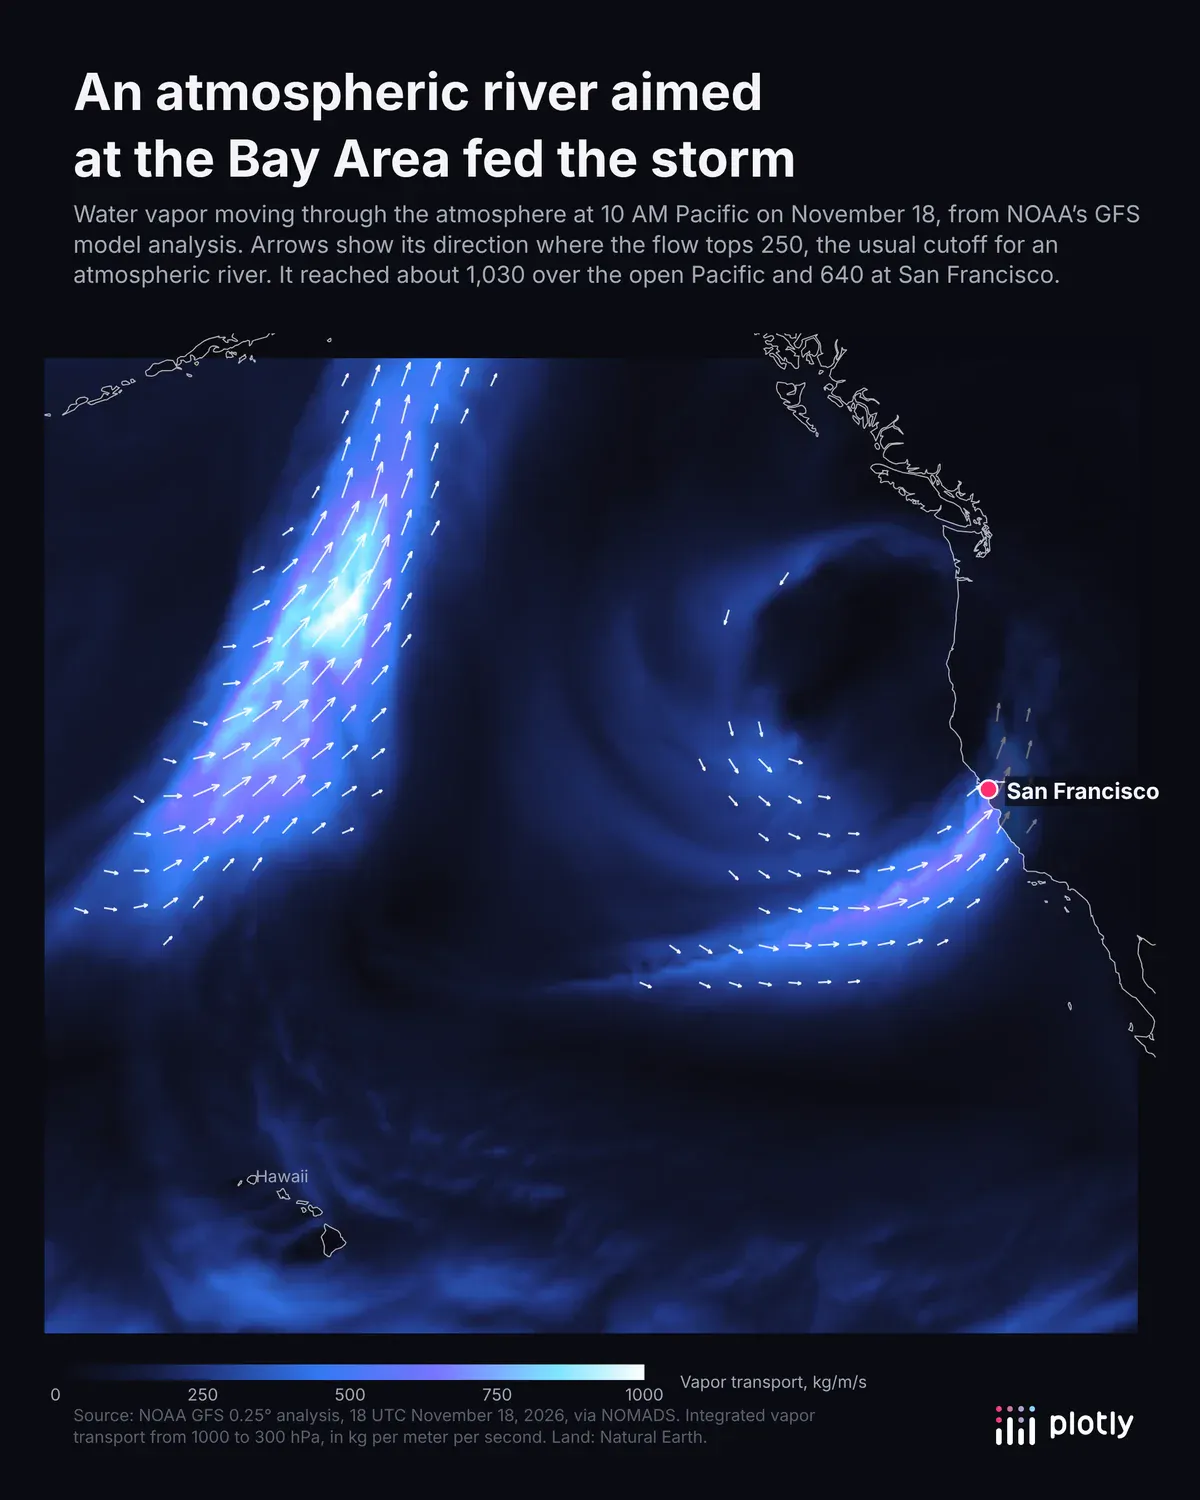
Water vapor flowing into the Bay Area, drawn as a heatmap with quiver arrows from NOAA's GFS weather model. It reached about 640 kg per meter per second at San Francisco, well above the 250 that usually defines an atmospheric river.
4. Radar over the city, on satellite imagery
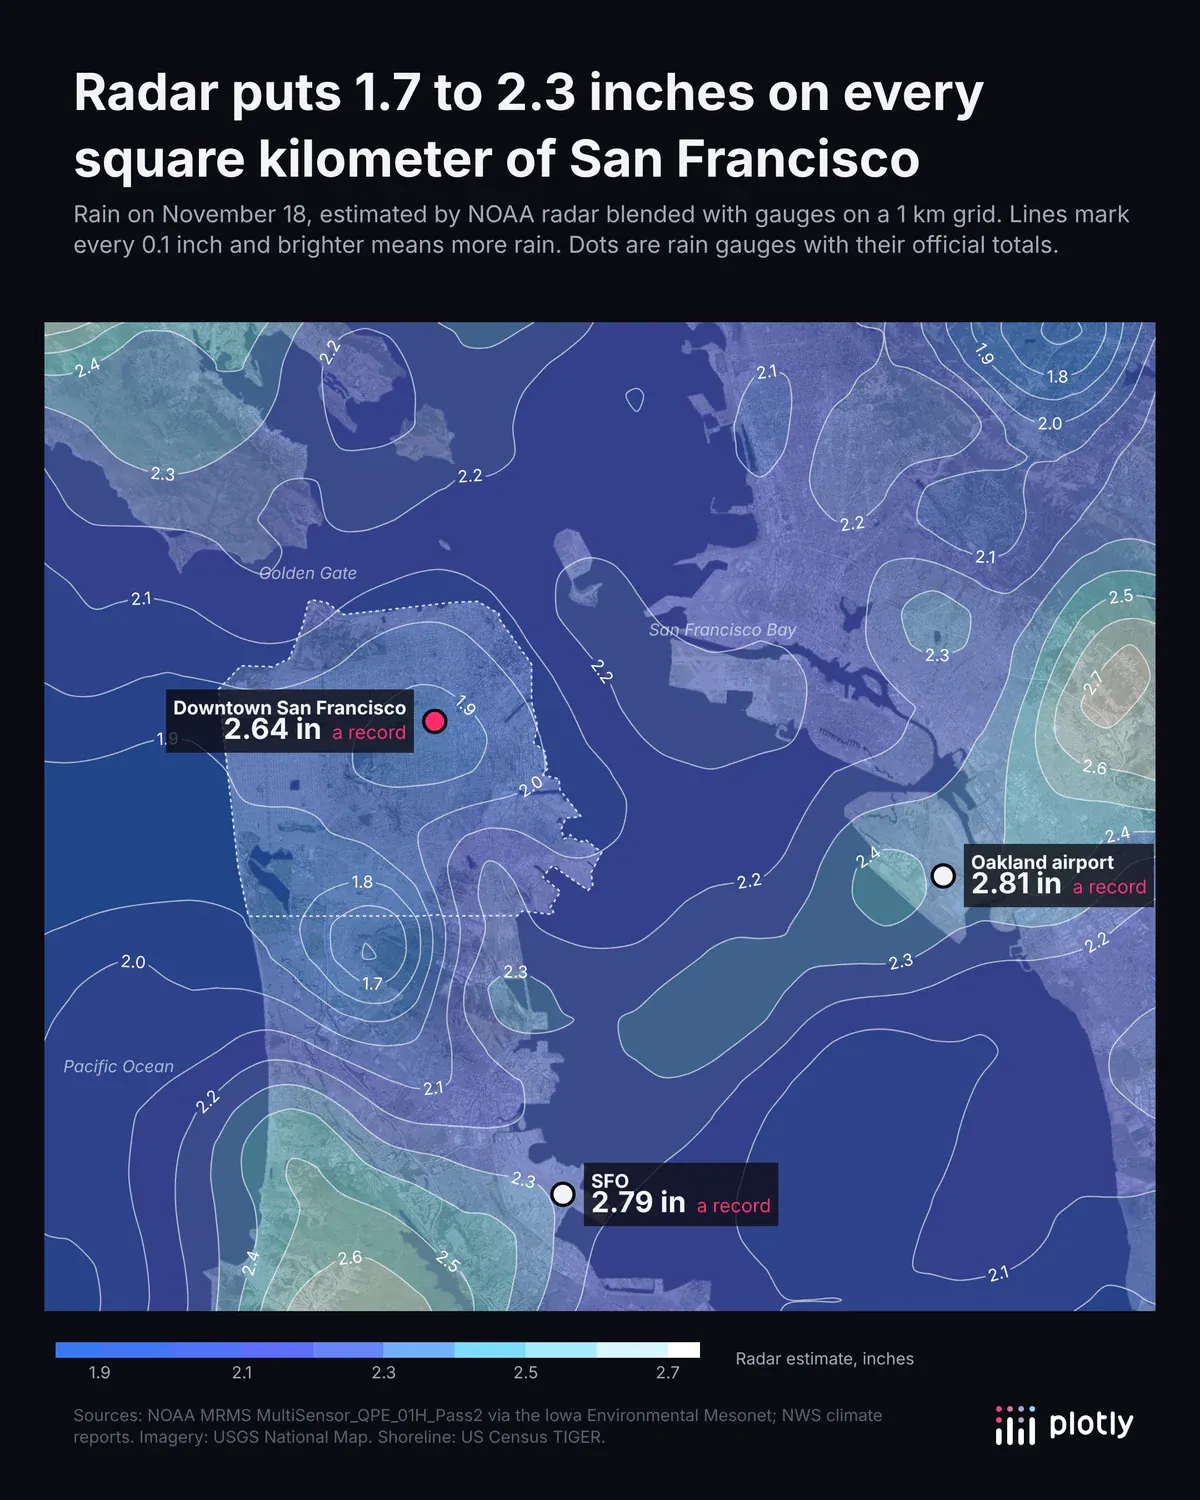
NOAA radar blended with gauges on a 1 km grid, drawn as labeled contours over USGS imagery. Radar puts 1.7 to 2.3 inches on every part of the city, and the downtown gauge caught 2.64.
5. Rain on the terrain, in 3D
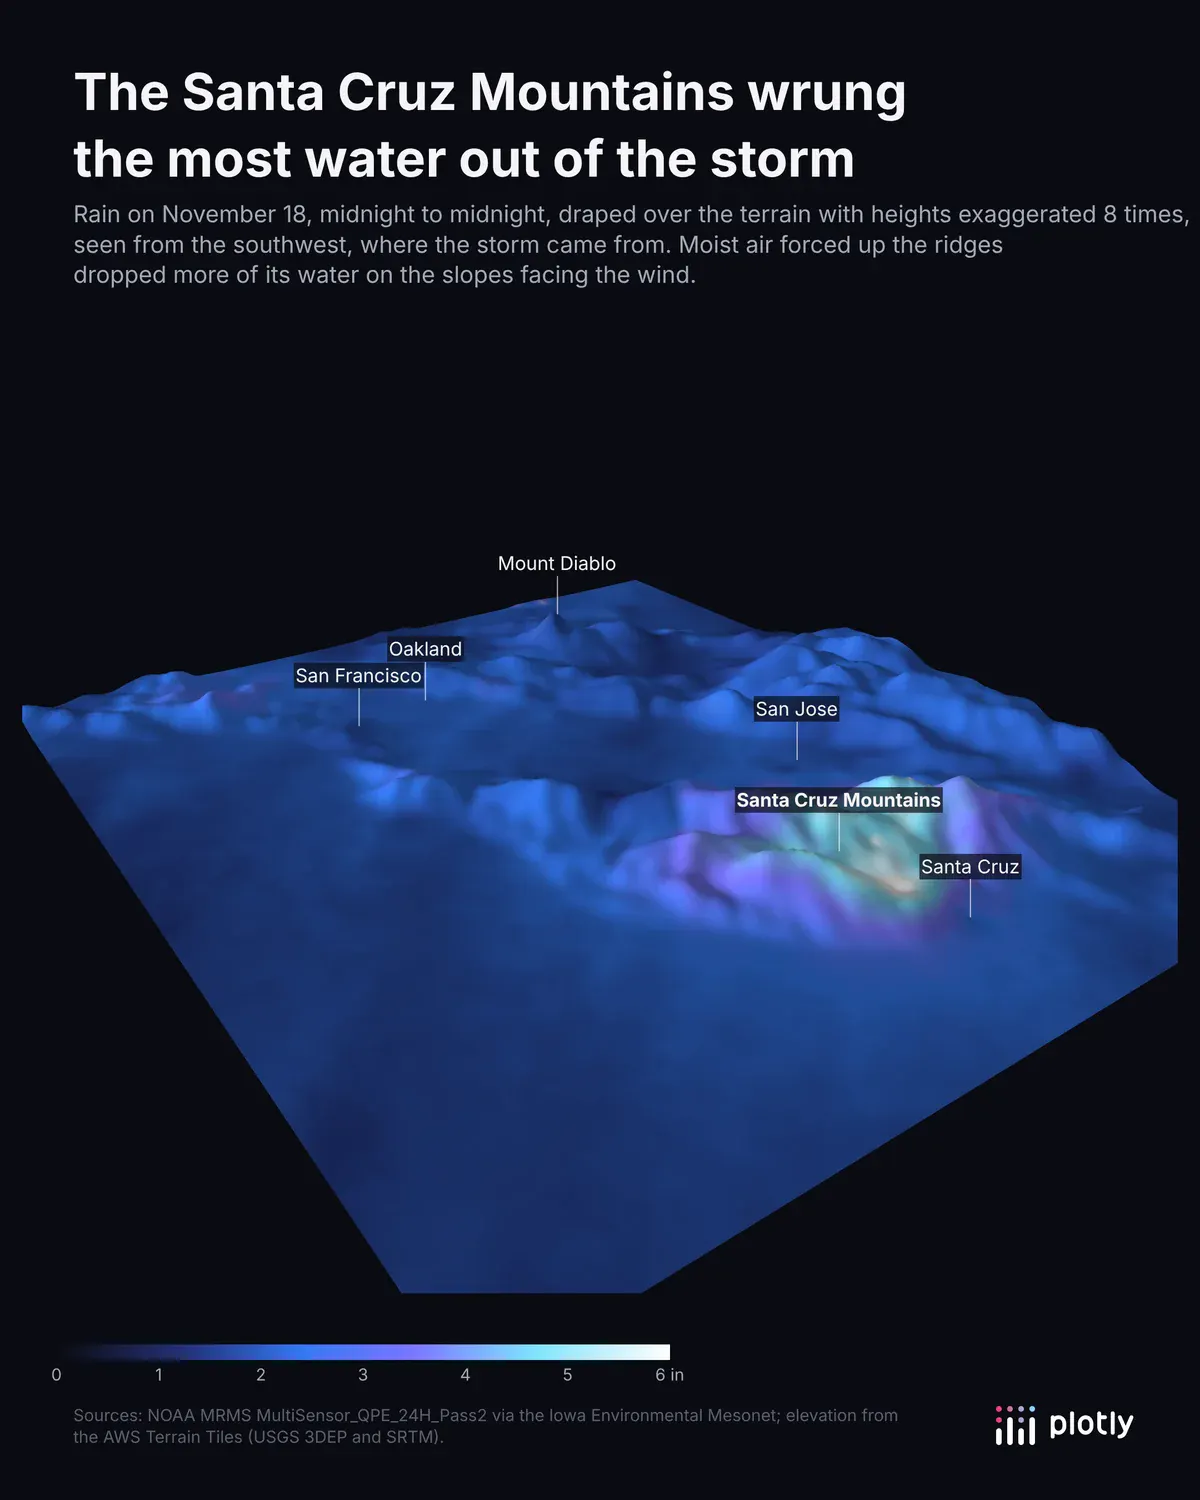
Radar rain draped over a 3D surface of the terrain. The Santa Cruz Mountains caught about 6.6 inches, because the ridges forced the wet air upward.
6. The storm, hour by hour
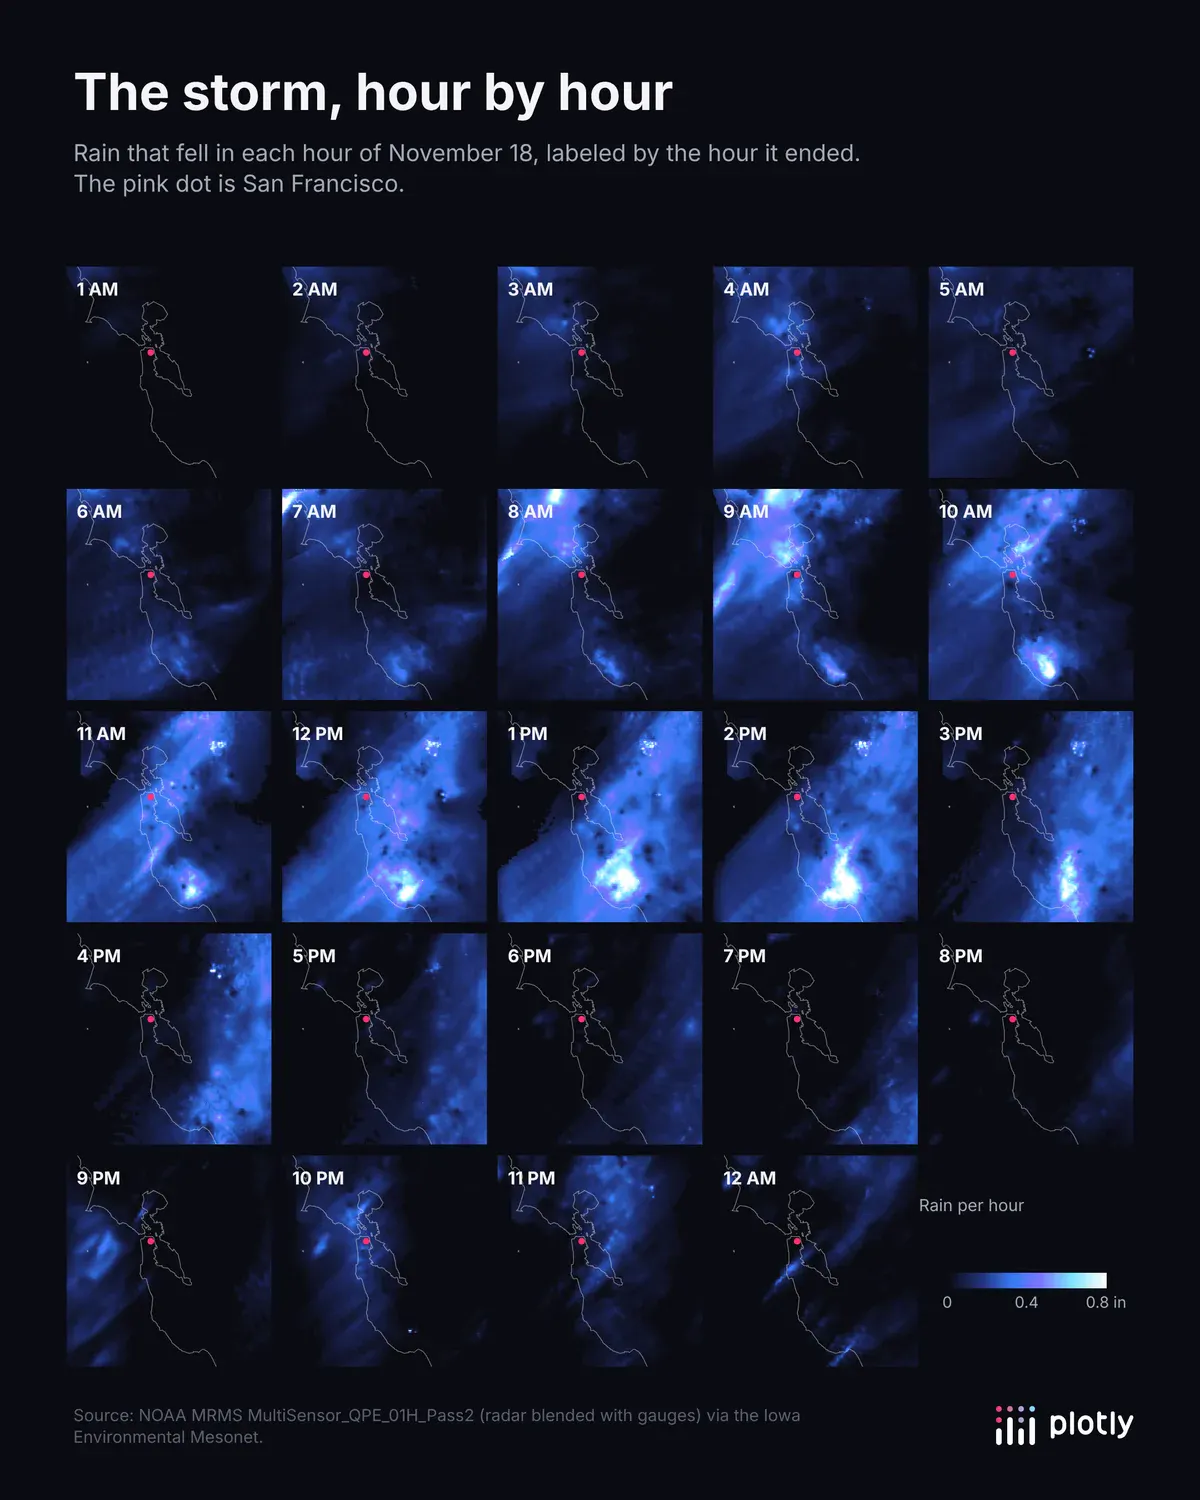
Small multiples, one radar map per hour. The heaviest rain crossed the Bay between about 8 AM and 3 PM, and a second, lighter band came through after 9 PM.
7. One airport, four views
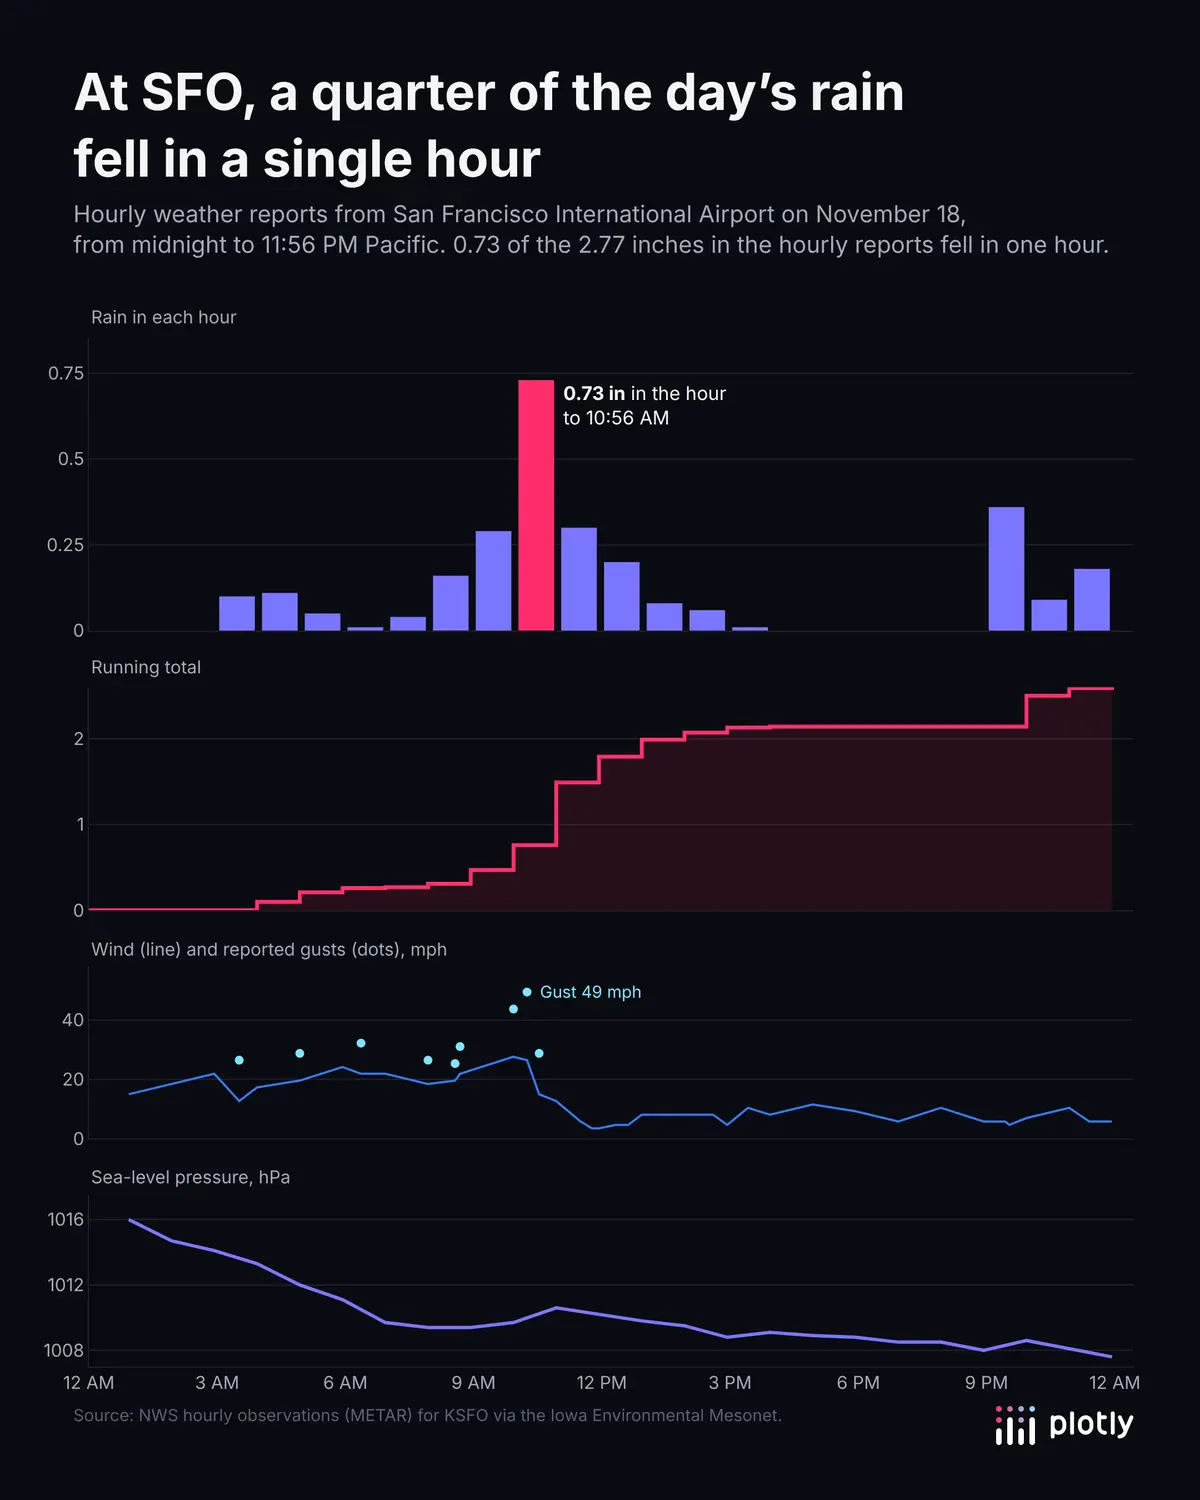
Rain, running total, wind and pressure at SFO on a shared time axis. A quarter of the day's rain fell in one hour.
8. Which airport got it first
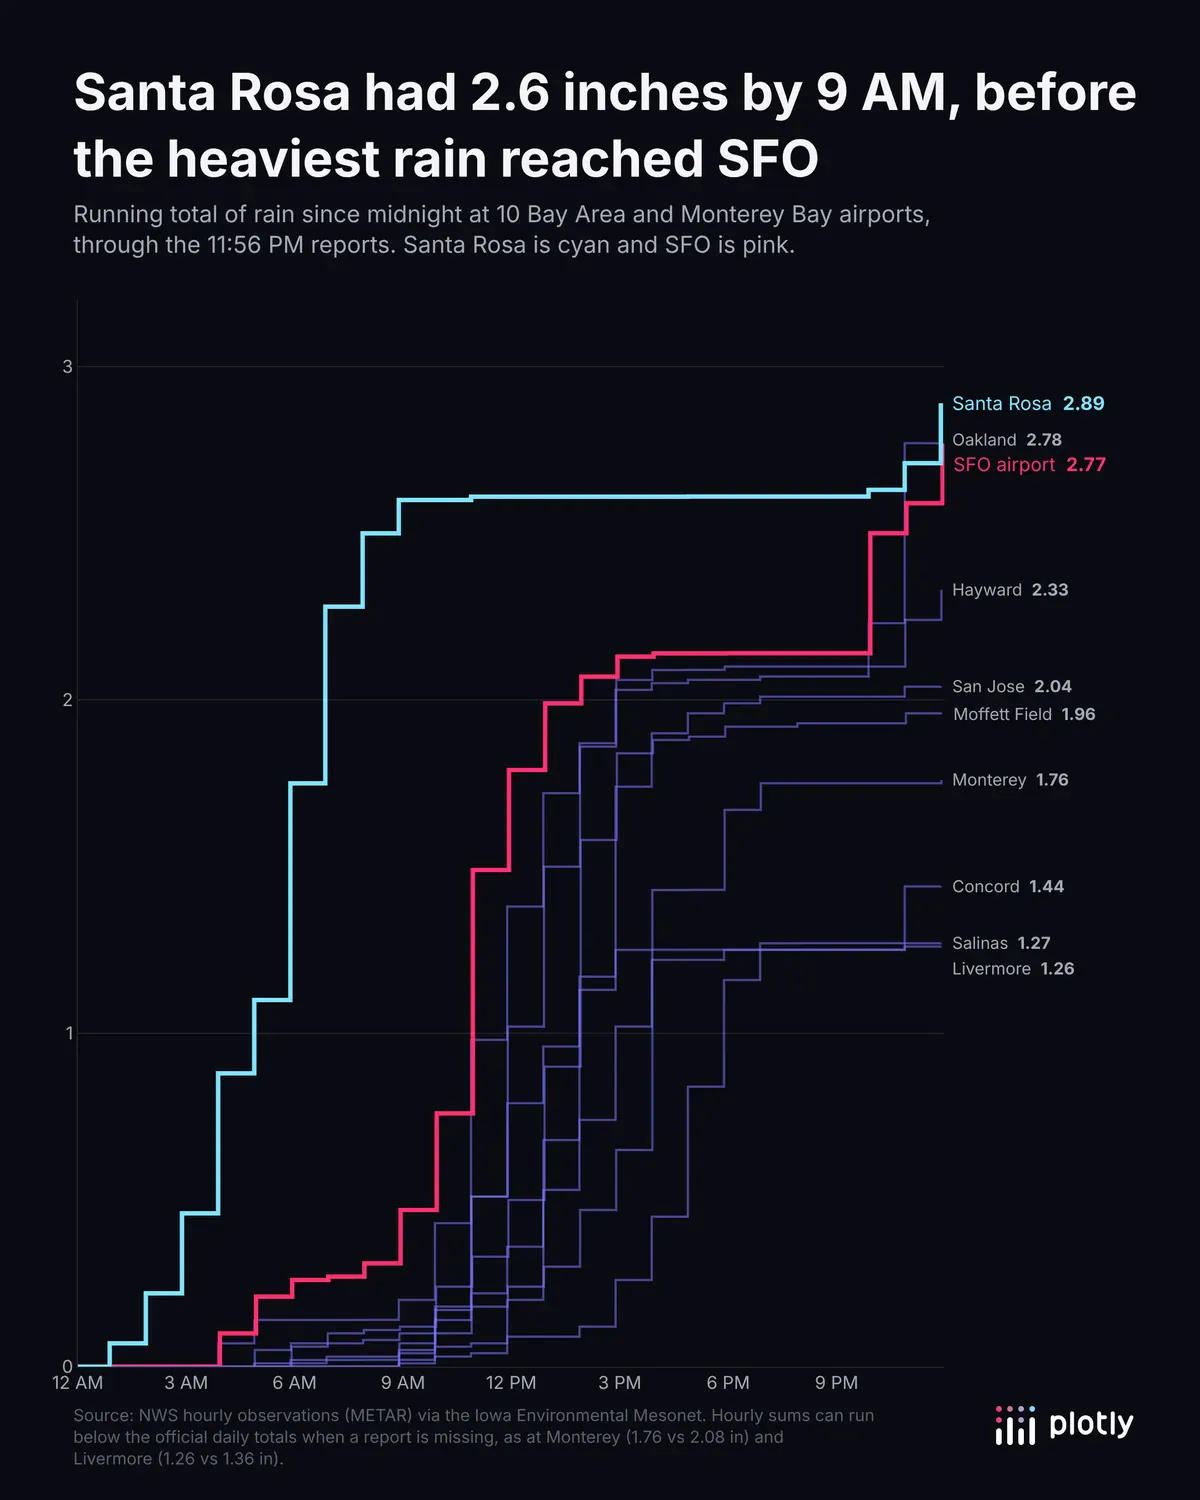
Running totals at 10 airports as step lines. Santa Rosa had 2.6 inches by 9 AM, before the heaviest rain reached SFO.
9. Records broken
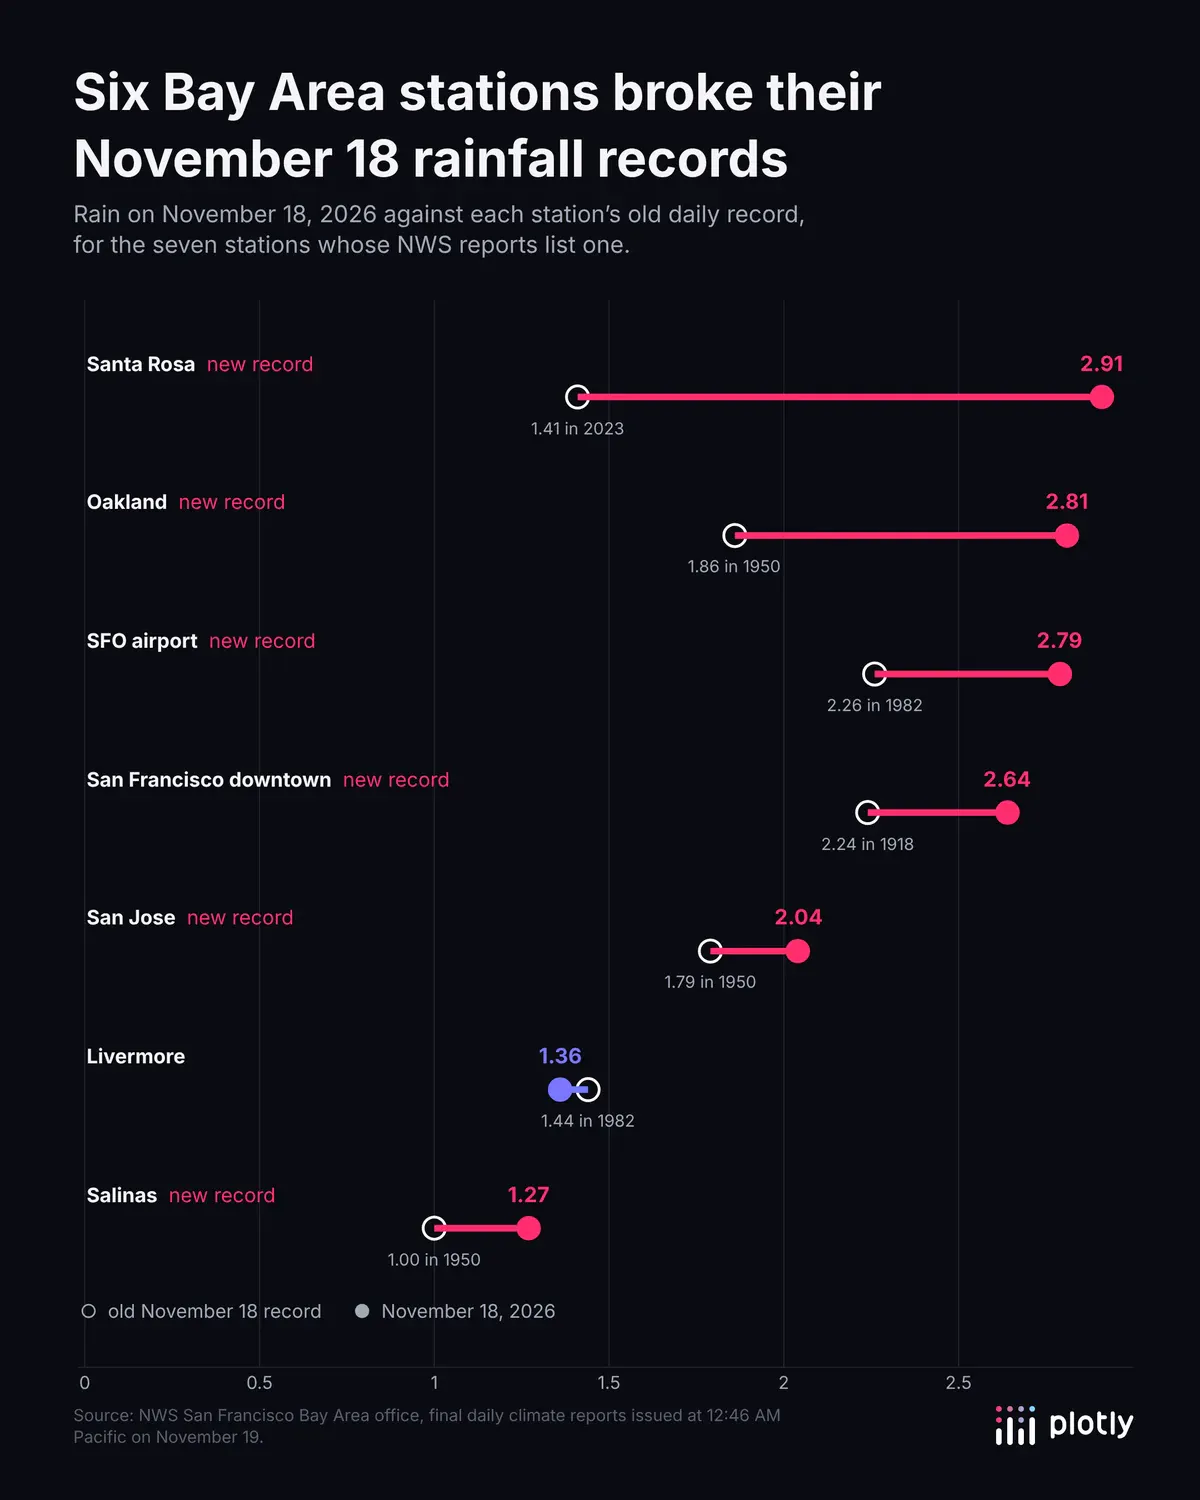
A dumbbell chart of each station's old record against this year. Six of the seven broke theirs, including SFO, where the old record was 2.26 inches from 1982.
10. The rain season so far
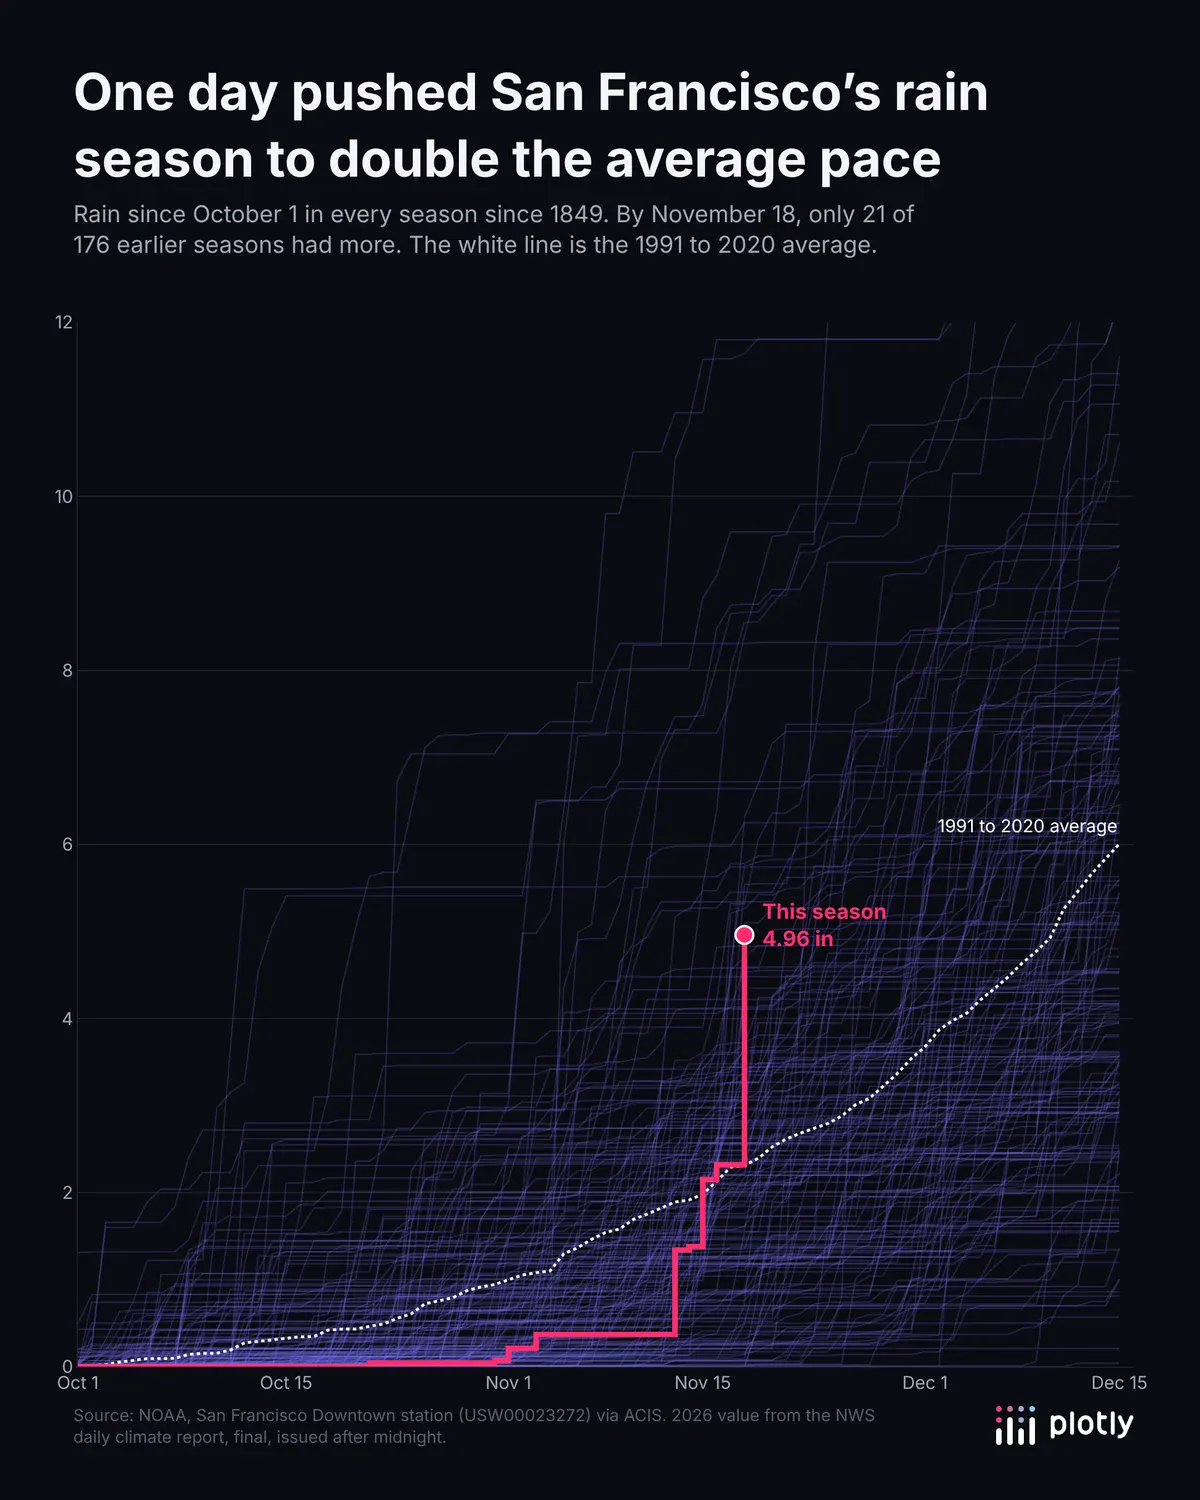
Rain since October 1 for every season since 1849. This season is at 4.96 inches, more than double the average for the date.
How to visualize rainfall data with a coding agent
All 10 charts started from this prompt to a coding agent (Claude Code), which found the data, checked its totals against the NWS reports and looked at every chart before calling it done. A few rounds of feedback, such as "make the map about SF" and "the colors blend together," got them to what you see here:
Create 10 graphs with Plotly visualizing today's epic rainstorm in San Francisco. Get creative.
The same prompt works in Codex or Plotly Studio. To share the charts interactively, ask the agent to turn them into a Dash app and host it on Plotly Cloud. For more of San Francisco's weather, see 13 ways to visualize time series data.