
Dash Enterprise for Sports Analytics with Utah Jazz
Industry
Telecom & Entertainment
Summary
- Legacy tech replaced: Tableau
- Dash app audience: 40 NBA coaches, managers, analysts, and other NBA staff
- Dash Enterprise capabilities in play: Snapshot Engine, Snowflake Connector, No-Code Authentication, Application Manager, and Jobs Queue
- Python stack: Dash, Plotly, Pandas, statistics, statsmodels
Introduction
Cory Jez, Head of the Utah Jazz’s basketball analytics group, is all about listening to the numbers that give the Jazz a winning edge. Utah’s analytics team is small, comprising a data scientist, analyst, and data engineer. But together, they publish Dash applications that serve over 40 managers, coaches, and other staff who all have unique information needs in order to make the team run — both on and off the court.
"Running a professional basketball team in many ways is like running any other business. It all comes down to information! With over 2 million data points generated for every NBA game, we needed a way to get the right information into the hands of coaches and executives quickly and securely."
Cory Jez, Head of Basketball Analytics Group, Utah Jazz
Challenge
Cory’s analytics team must deliver robust analytics on a continual basis via multiple channels: TVs in the office, iPads used during games or on the road, and hard-copy PDF booklets are just a few outlets. These must be easy to understand, explorable, and responsive to constant change, but also secure for varying levels of end-user authorization — with printable capability, to boot. Different players and new opponents play every game, so the team’s Snowflake data warehouse is continuously updating with data from multiple sources. In short, Cory’s team has to run a living, breathing data operation for over 40 different end users.
In Cory’s three years of coordinating analytics capabilities for the Utah Jazz, his team had inherited a legacy system, running data models with PHP scripting and Excel files. They used Tableau to visualize their data, but it became expensive at the level of end-users Cory’s analytics team was serving and couldn’t deliver the specific data views required by coaches and managers. For example, starting line-ups that identify a team’s starting players, typically the five strongest who drive the game, can be changed even up to 30 minutes before game time. Player shot charts illustrate the basketball court and the locations from which a player shoots the ball.
Visualizations like these were impossible to pull off and update quickly using Tableau. The needs of Cory’s analytics team greatly exceeded the capabilities of their legacy system. To get an edge on the data science operations of their rivals, Cory’s team needed the advanced analytics and visualization capabilities of Python, and Dash Enterprise to deliver visual analytics to their end users.
Solution
Recently, Cory’s analytics team took ownership over their own technology stack. With it came a window of opportunity to create a system that worked better for everyone — if they could pull it off in their three-month off-season. As a small team serving the diverse needs of over 40 stakeholders, without back-end DevOps or front-end web development teams to support them, they needed a nothing-but-net solution.
Building web applications with Flask could be a partial fix, but the team really needed a way to build interactive analytic applications tailored for data science, as well as a way to manage and deploy them securely. As a Python user, Cory knew about Plotly’s open-source Dash framework for building analytic applications. It suited the team’s needs because each application they built could be written in Python alone, from analytics to GUI. He also learned about Dash Enterprise, Plotly’s one-stop shop for data science operations. Horizontally scalable hosting, deployment, and authentication for analytic web apps, without any IT or DevOps requirement, were finally within reach with one shot.
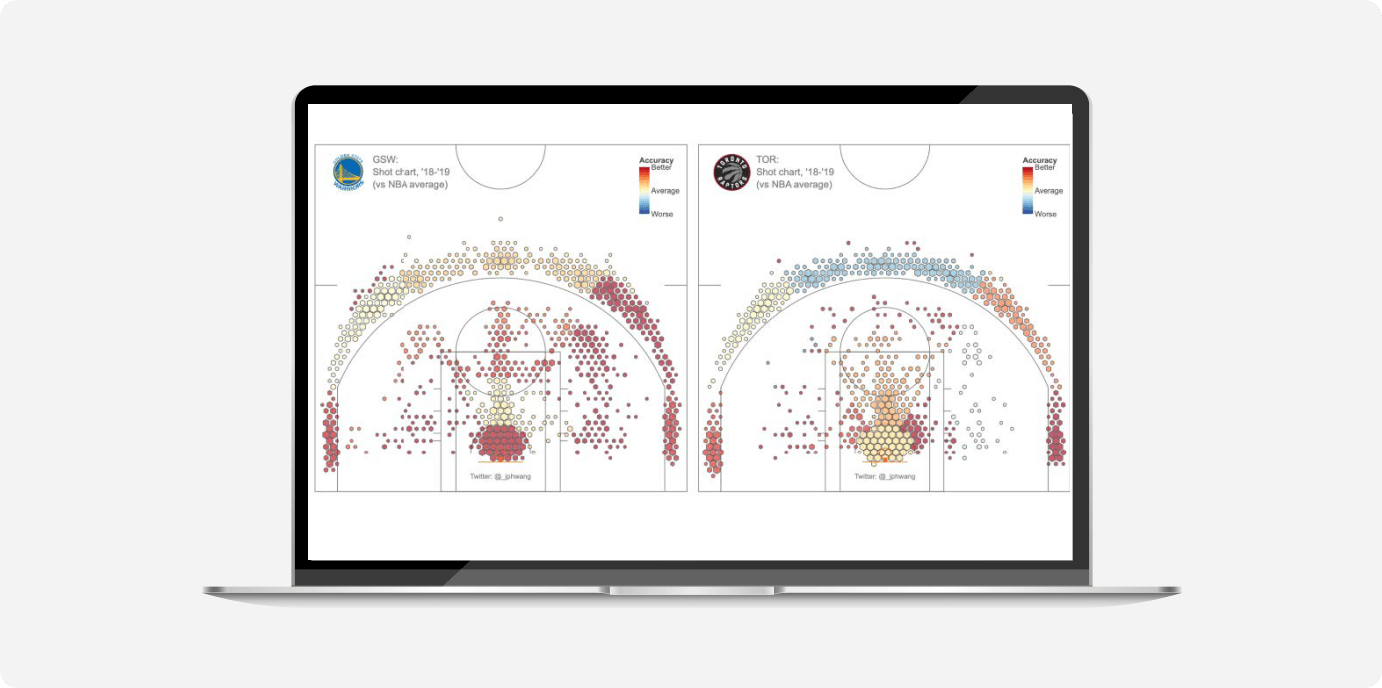
Interactive player shot charts created by freelance Plotly content creator, JP Hwang.
Results
Dash Enterprise enabled Cory’s team to make over 20 dashboards securely available in the Dash Enterprise App Portal, where the Utah Jazz staff had easy, curated access to the latest information they needed to make operational and business decisions:
- Key KPIs: The Jazz can now see all their relevant basketball statistics in one easy-to-use platform without having to search internal systems or the public web for the right statistic.
- Data Visualization: Dash enabled Cory and his team to better guide users to key takeaways, much easier than could be done with Excel or PDF’d legacy reports.
- Interactivity: End users were able to drag and drop in new datasets or switch out injured or traded players for fast, reactive visualizations and data updates.
- Reporting: With one click, precise application views can be exported as PDFs, either interactive or printable, via Dash Enterprise Snapshot Engine.
- Security: The no-code Authentication built into Dash Enterprise meant that Cory didn’t have to spend his own time implementing SAML credentials for each application his team deployed.
Now, Cory won’t spend his off-seasons worrying about managing the tech stack and can focus on navigating NCAA modeling, college rankings, and upcoming draft pick strategy. He’s using Dash datatables to show the relevant information for the upcoming NBA draft or free agency.
"Dash Enterprise has been a lifesaver. I’m able to quickly create, edit, and deploy customized Dash apps as soon as I need to. Dash Enterprise is light-years ahead of other Python and R app deployment platforms."
Cory Jez, Head of Basketball Analytics Group, Utah Jazz
About Utah Jazz
The Utah Jazz are an American professional basketball team based in Salt Lake City. The Jazz compete in the National Basketball Association (NBA) as a member of the Northwest Division of the Western Conference.

More user stories like this

Kansas City Chiefs Champion Digital Transformation in Business and Operations
How Crant Automated AI-driven Insight for Brand Building with Dash

Gamma Technologies and Plotly Partner on Industry-Leading Simulation Platform