
Domenic Ravita
October 07, 2025
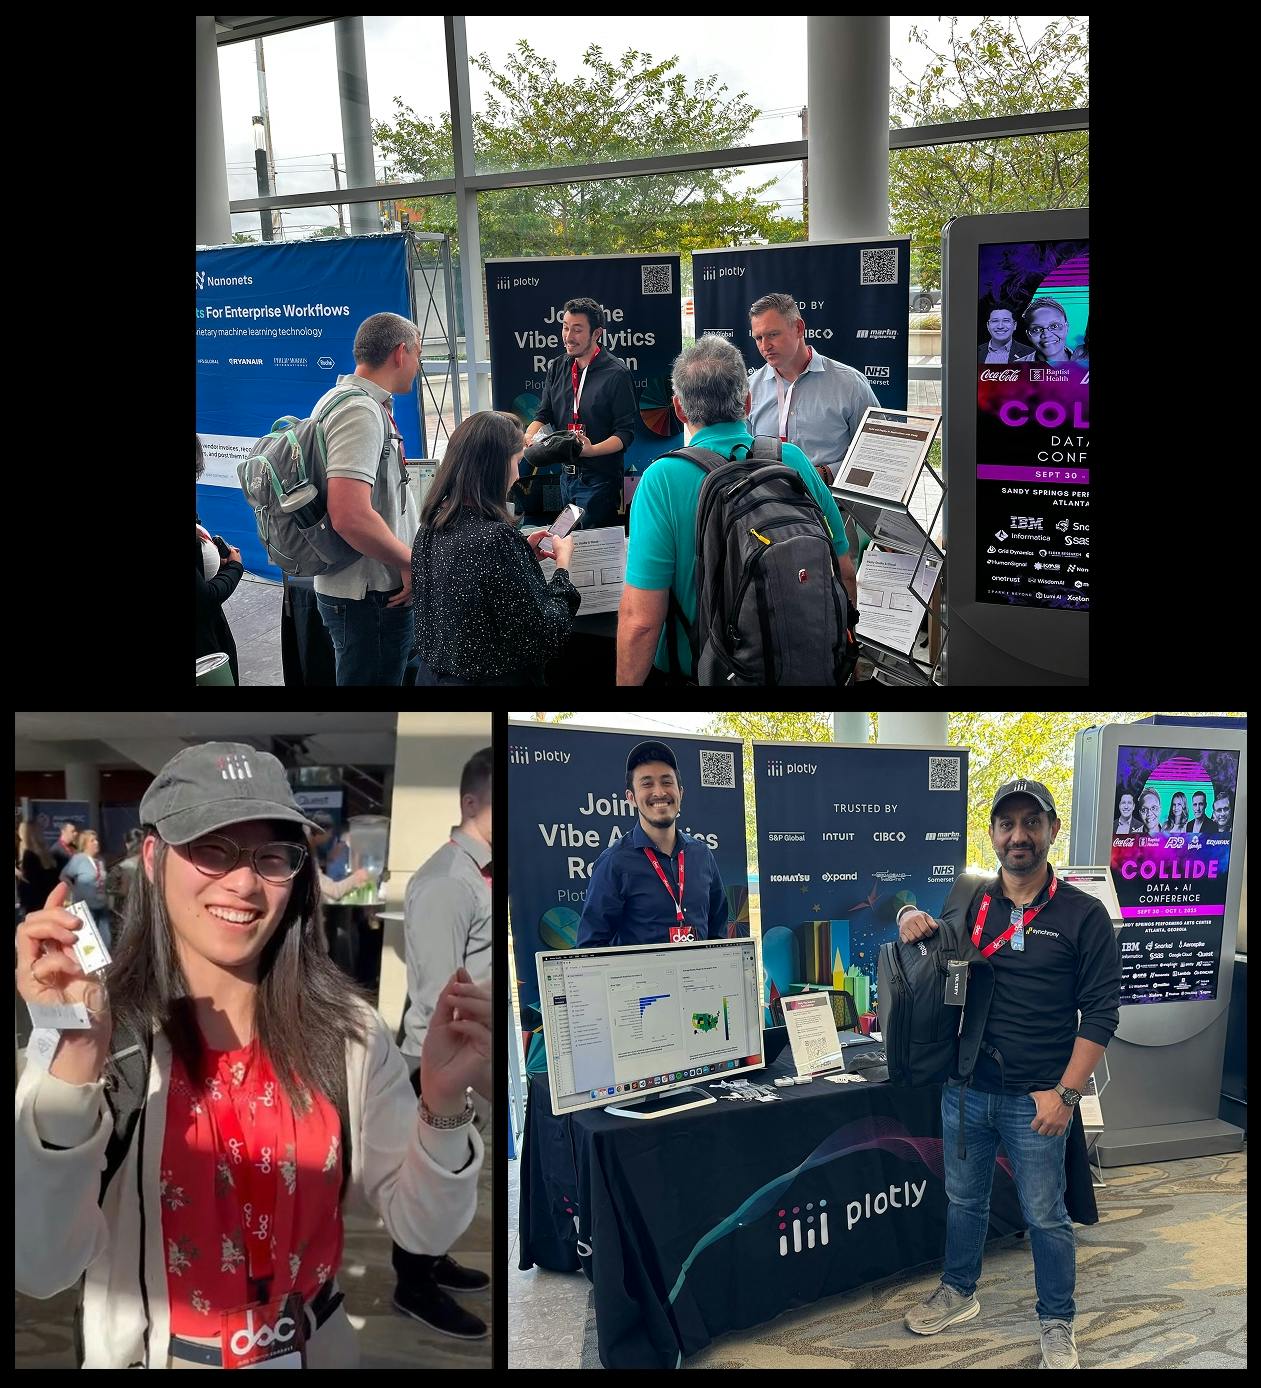
Plotly at Data Science Connect Collide 2025
We spent two days in Atlanta last week at Data Science Connect's Collide conference, connecting with data leaders from telecom, financial services, manufacturing, and cybersecurity.
The conversations covered everything from customer transaction analytics to supply chain optimization, with one clear thread running through them: teams want faster ways to explore their data.
That's exactly what Plotly Studio addresses through its AI-native and spec-driven user experience. We're in an exciting moment for vibe analytics, where data teams and knowledge workers alike can leverage AI to instantly analyze data and generate data apps without drag & drop, open-ended chat or confusing code-only interfaces. Seeing that need validated by practitioners at Collide made the week even more energizing for the Plotly team.
Vibe analytics for exploratory data analysis
Patrick Hutto from Broadband Insights presented "Vibe Analytics for Exploratory Data Analysis" on day one. His company serves smaller, rural telecom operators in the U.S. who lack the massive data science teams of larger carriers, making the speed of analysis particularly important. Watch the recording, or read the highlights below:

The problem with traditional exploratory analysis
Patrick described a frustration many data teams know well. Clients love the idea of dashboards and visualizations, but when you ask what they actually want to see, the conversation falls apart. You might get a napkin sketch or a memory of something they saw five years ago. Sometimes you get a list of 300 metrics with no structure.
His team would spend weeks building something like a Sankey diagram showing customer flow through different stages, only to hear "can I get a bar chart instead?" The gap between what executives need and what developers build wastes time on both sides.
From weeks to minutes
Broadband Insights got early access to Plotly Studio and started using it with real customer data. The difference showed up immediately in their exploratory work.
"Instead of spending weeks talking about a problem or days trying to code something to show it to someone, we narrow that gap where they could be in the same room talking in real time. This is taking minutes to go back and forth and generate a new graph without having to spend weeks trying to figure out what they want."
Patrick Hutto, CEO, Broadband Insights
When a client sends a CSV of customer packages or utility pole data, Patrick's team drops it into Plotly Studio. The tool interprets the columns, suggests relevant visualizations, and generates interactive charts without manual coding. A histogram of pole clearances or a map of infrastructure costs appears in minutes instead of days.
The back-and-forth happens in real time. "This looked interesting as a scatter plot, can we make it a bar chart?" gets answered immediately. Plotly Studio generates options Patrick hadn't considered, like spatial distributions of customer trends across regions. When something doesn't make sense, you gain the flexibility to quickly move on to the next idea.
Closing the collaboration gap
The true value, apart from speed, is putting the executive and the analyst in the same room, working with the data together. Patrick emphasized that vibe analytics is the art of building the visual layer fast enough that the conversation stays productive.
After the exploratory phase, his team knows what matters. They can mock up production-ready dashboards, copy the code, and move it through their normal deployment process. Plotly Dash Enterprise hosts the final applications with security and caching handled automatically.
Self-service for clients who don't code
Patrick's customers often want to explore their own data but lack Python skills. His team exports cleaned datasets from their data lake into Plotly Studio, letting clients experiment without handing work back to developers. It won't replace production pipelines, but it surfaces questions and insights that wouldn't emerge otherwise.
The talk drew data scientists and analysts working in telecom, who stopped by afterward to discuss how they handle exploratory work with their own datasets. The questions centered on moving from static reports to interactive analysis, especially for teams that don't have dedicated developers for every visualization.
The Vibe Analytics Data Challenge
On day two, we ran a vibe analytics data challenge asking attendees to build an analysis using their own datasets. We received nearly 50 submissions from practitioners across industries.
Three submissions stood out:
- Sakthi Ganapathy Rathinam from Green Sky submitted a customer transaction analytics dataset that demonstrated financial pattern analysis.
- Owen Gates from Smurfit Westrock built a supply chain analytics exploration, showing how packaging and paper companies track complex logistics data.
- Kanjit Sidhu from Synchrony Financial created an analysis relevant to consumer credit and financial services.

Each winner received a Plotly-embroidered digital backpack at the booth award ceremony.
Dinner conversations with data leaders
We hosted two dinners during the conference. The first brought together practitioners from telecom companies, many of whom had attended Patrick's talk earlier that day. The second dinner on day two included quantitative analysts focusing on financial modeling and risk analysis use cases.

These smaller conversations revealed common challenges: teams often know what questions they want to ask of their data, but getting to answers requires too many handoffs between analysts, data engineers, and developers. The most productive tools are the ones that collapse that distance.
What we learned
The mix of professionals we spoke to at Collide ranged from VP of Enterprise Data Analytics & AI and Director of Data Science to Sr. BI Developer and Advanced Data Engineer. That range matters because the problems they're solving require both strategic thinking and hands-on technical work.
The teams making progress are the ones that can move quickly from question to insight. Whether that's a telecom operator analyzing network performance, a financial institution modeling risk, or a manufacturer optimizing supply chains, the speed of exploration determines how many hypotheses you can test.
The energy around vibe analytics was real. People want tools that let them build and explore without waiting on developer queues or fighting with rigid BI platforms. When analysts, executives, and domain experts can work directly with their data, the questions get better and the answers come faster.
Thanks to everyone who stopped by the booth, joined us for dinner, or submitted a data challenge entry. We'll be at more conferences this year and we're always interested in hearing what you're building.