
Matt Brown
August 10, 2026
Part 1 of 3: The Architecture Case
Why it still matters which framework you pick when AI writes all the code
Part 1 of 3 in a series on why you should ask Claude to build data apps in Dash instead of a full-stack app. This part makes the architecture case: a Dash app is one application, in one language, with a smaller blast radius when something breaks. Part 2 covers the risks that show up after launch, and Part 3 does the math on token cost, and on when full stack is still the right call. Access the full PDF of the 3-part series.
TL;DR: When you ask Claude to build a data app, naming the framework in the prompt matters. For a walkthrough, watch our recent webinar.
Here's the short version of why that framework should be Dash from the perspective of architecture.
- One app, not two. You asked for an app, but full stack gave you two: a front end and a back end with an API layer gluing them together. That’s two things that have to be built, hosted, and kept in sync, or worse, a front end that never got a back end at all. Dash is one application, one language, one process.
- No translation tax. Your data already speaks Python. Dash callbacks call pandas, NumPy, and scikit-learn directly. Full stack has to flatten that same data into JSON first, a boundary that breaks on ordinary things like datetimes and NaN values if not handled appropriately.
- Fewer decisions, fewer forks in the road. Full stack doesn't have a default state-management pattern, so Claude has to pick one for every project introducing possible inconsistencies and complexity. Dash's callback model is one tried-and-true default that works every time.
- The wiring is just as important as the charts. Cross-filtering and linked components in Dash are just another callback. In full stack, Claude has to invent the state architecture connecting components from scratch, every time.
- A smaller blast radius when something breaks. One language, one runtime, one place for a bug to live, and a much shorter path to understanding why.
Read on for the details behind each one.
YOLO-ing data apps
Type "build a dashboard that tracks churn by cohort" into Claude and you might get a Dash or a full-stack app back. That's the whole pitch of vibe-coding: describe the outcome, skip the syntax, let the model handle the rest. So why does it matter if you don’t pick a framework in your prompt?
Because Claude isn't the one who has to live with what it builds. You are. And the choice between full stack and Dash isn't really a choice about which framework is more powerful. It's a choice about how much surface area you're handing an AI to get right, and how much of that surface area you can personally inspect when it doesn't.
You’re actually asking for two apps
Ask Claude for a data app in full stack and you're asking for two applications: a front end that renders the UI, and a back end that talks to your data, with an API contract stitched between them. That's two languages, two runtimes, and a handshake between them that has to stay in sync every time either side changes.
Or, just as often, you get one application instead of two, and the wrong one. Claude builds the front end, wires it up to sample data or a hardcoded JSON file to get something on screen fast, and never gets around to the back end at all. It looks done. It renders, it's interactive, the charts show up. Then you go to point it at your actual data source and discover there's no API to call, no data layer underneath it, nothing to connect to, just a UI built around the shape of whatever placeholder data it started with. Now you're not adding a feature, you're building the whole back end Claude skipped, from scratch.
Ask for the same thing in Dash and you get one application. Layout and logic live in the same codebase, deploy as the same process, and talk to your data directly instead of across a wire. There's no API contract to keep in sync because there's no second service on the other end of it, and no separate build step, host, or network boundary to set up and maintain.
This isn't purely about file count, but also how many moving parts Claude has to get right at once, and how many of those parts can quietly drift out of sync with each other after the fact. A front end and a back end built in the same session can still disagree about a field name or a response shape six prompts later, but a single application doesn't have a seam to drift across.
It also changes what Claude has to hold in its head on every turn. Less to generate and re-read on every follow-up prompt means fewer tokens spent over the life of a project, and less room for the model to lose track of an architecture that's split across two codebases instead of one.
When you want to open the hood yourself, there's only one application to understand – a much smaller job for anyone reviewing the work – especially when the person doing the reviewing is a data analyst or scientist.
Your data already speaks Python, don’t make it learn a second language
Data teams already live in Python. Pandas, NumPy, Polars, SciPy, scikit-learn, and whatever proprietary ETL pipeline your company has built up over the years are all native to it. It goes to the heart of where the actual analysis work already happens, in a notebook, in a script, in a scheduled job, long before anyone thinks about putting it in front of a wider audience. A Dash callback runs in that same process. It can call pd.read_sql, run a groupby and an aggregation, call .predict() on a scikit-learn model, and hand the result straight to a Plotly figure, in the same file, the same language, the same objects your notebook already produces. It’s your raw analysis – not an adaptation of your work for the web – wired up directly to a callback.
Full stack can't do any of that directly, because the browser doesn't run Python natively, and WebAssembly, although promising, hasn’t yet eliminated the need for a true server-side application in most cases. Whatever pandas or scikit-learn work happens has to happen somewhere else, get flattened into JSON, and cross a wire before a React component ever sees it, and this boundary can be brittle.
Consider this simple mistake: a plain pandas DataFrame with a datetime column fails to serialize. Did you spot the mistake?
# api/endpoints.pyimport jsonfrom flask import Flask, Responseimport pandas as pdapp = Flask(__name__)def load_sales_summary():df = pd.read_csv("sales.csv", parse_dates=["order_date"])summary = (df.groupby("region").agg(total_revenue=("revenue", "sum"),order_count=("order_id", "count"),last_order=("order_date", "max"),avg_discount=("discount", "mean"),).reset_index())return summary@app.route("/api/sales-summary")def sales_summary():df = load_sales_summary()# Looks harmless — this is the line that blows uppayload = df.to_dict(orient="records")return Response(json.dumps(payload), mimetype="application/json")if __name__ == "__main__":app.run(debug=True)
Python's own json.dumps raises a TypeError: Object of type Timestamp is not JSON serializable. Of course, there’s a workaround for this, but it’s dependent on your chosen API (e.g. instead use Flask’s jsonify() function).
How about this one?
# api/endpoints.pyimport jsonfrom flask import Flask, Responseimport pandas as pdapp = Flask(__name__)def load_inventory_counts():df = pd.read_csv("inventory.csv")counts = (df.groupby("warehouse")["sku"].count().reset_index(name="item_count"))return counts@app.route("/api/inventory-counts")def inventory_counts():df = load_inventory_counts()payload = df.to_dict(orient="records")return Response(json.dumps(payload), mimetype="application/json")if __name__ == "__main__":app.run(debug=True)
The default numpy.int64 integer type that pandas hands you fails the same way: TypeError: Object of type int64 is not JSON serializable.
And what about this last one?
# api/endpoints.pyimport jsonfrom flask import Flask, Responseimport pandas as pdapp = Flask(__name__)def load_discount_summary():df = pd.read_csv("orders.csv")summary = (df.groupby("region").agg(avg_discount=("discount", "mean")).reset_index())return summary@app.route("/api/discount-summary")def discount_summary():df = load_discount_summary()payload = df.to_dict(orient="records")return Response(json.dumps(payload), mimetype="application/json")if __name__ == "__main__":app.run(debug=True)
This one doesn’t throw a Python error at all, nor is there any issue with the code itself, but the data set includes missing values that are printed as NaN values in the payload, which is not valid JSON. Try to parse that same payload in a browser and JSON.parse throws immediately: Unexpected token 'N', "...NaN}" is not valid JSON.
Again, can these issues be worked around? Absolutely, but it’s something the AI and you will need to stay on top of as you develop. Claude will have to solve this on every project, because there's no default answer for how it should be done. The fixes an AI agent reaches for under time pressure tend to be the ones that make the error disappear rather than the ones that preserve the data’s meaning: fillna(0) to stop the crash, str() on a timestamp to get past the TypeError. A data scientist glancing at that fix would catch it instantly. Zero is not the same thing as missing, and a stringified date in one format upstream can silently stop matching a differently formatted date downstream. Whether anyone catches it depends entirely on how easily the person reviewing it can spot the problem, which is much harder when you’re working across the full stack.
Plotly's own libraries, plotly.py, dash_table, dcc.Graph, already know how to carry a DataFrame's dtypes, its NaNs, its timestamps, and its categorical columns into a rendered chart without losing or misrepresenting any of it. That translation still happens somewhere under the hood. The difference is that it happens inside code Plotly maintains and tests against exactly these edge cases, not inside code Claude is inventing for your project for the first time.
Here’s the code that just works in Dash.
import dashfrom dash import html, dash_tableimport pandas as pddf = pd.read_csv("orders.csv", parse_dates=["order_date"])summary = (df.groupby("region").agg(order_count=("order_id", "count"), # numpy.int64last_order=("order_date", "max"), # pandas.Timestampavg_discount=("discount", "mean"), # NaN for regions with none).reset_index())app = dash.Dash(__name__)app.layout = html.Div([dash_table.DataTable(data=summary.to_dict("records")),])if __name__ == "__main__":app.run(debug=True)
It also changes the scope of small edits. Decide you want a different aggregation, a new model feature, a rolling average instead of a daily sum, and in Dash that's a change to one Python function, the same kind of edit you'd make in a notebook. In a split React + back end app, the same idea touches two files in two languages: the back end logic, and then whatever the front end was expecting the response to look like, whether or not the underlying change had anything to do with the front end at all. That's slower for you to review and slower for Claude to get right, because part of every iteration goes to keeping a contract in sync instead of improving the analysis.
Lastly, it determines who can actually check the work afterward. A data scientist can read a Dash callback built around a groupby and know immediately whether the logic is right, wrong, or subtly off, because it's written in the language they think in. That same person usually has no way to tell whether a to_dict(orient="records") on a Flask endpoint actually matches what a useEffect hook expects on the other end, or whether a timestamp quietly picks up a timezone shift somewhere in the handoff. It’s obvious but worth stating plainly: It’s much easier to review and debug code you already understand.
Fewer forks in the road
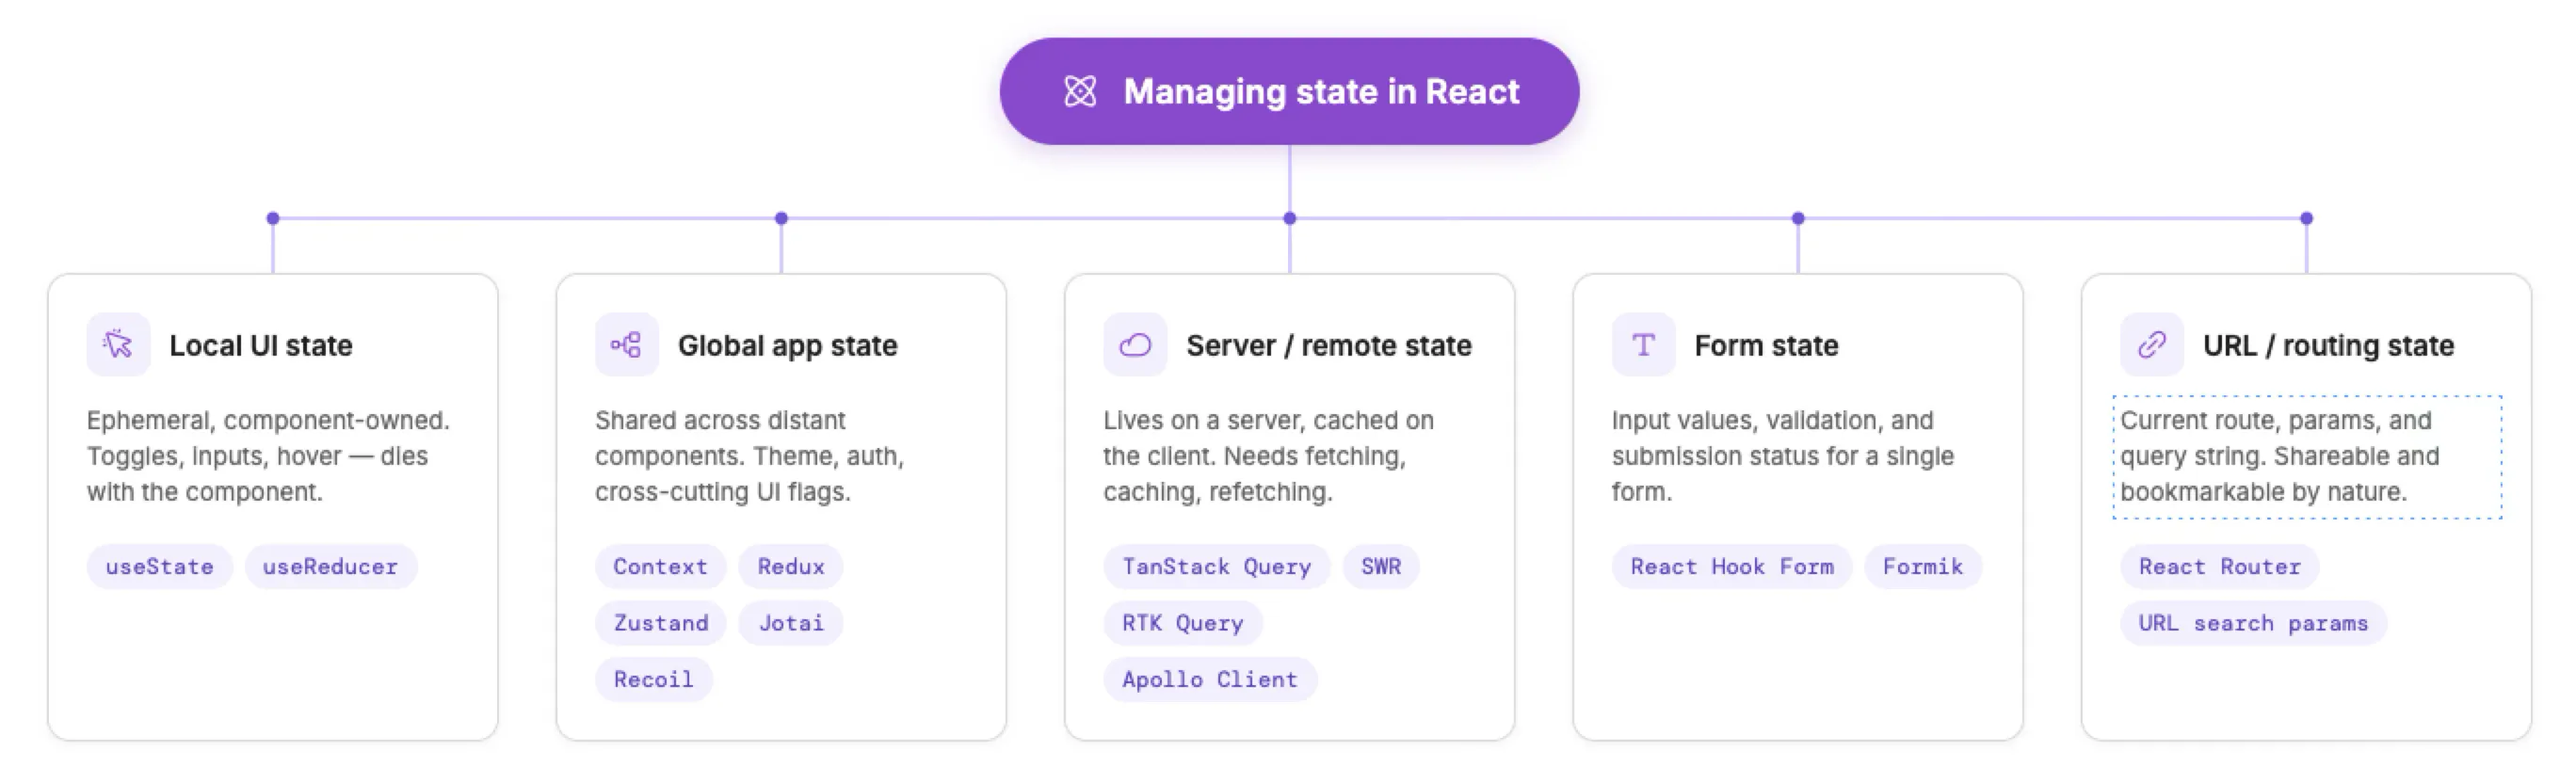
On the front end, React doesn't ship an opinion on how to manage state, route between views, or fetch data. That flexibility is the point, but it means every new project starts with a round of decisions: Redux, Zustand, Jotai, or Context for state; TanStack Query or something homegrown for server data; React Hook Form here, plain state there. Developer surveys going into 2026 describe this landscape in terms of "decision fatigue," and the industry's own response has been to split state into five separate categories, each with its own recommended library.
That's a lot of forks in the road for a human team to navigate deliberately. It's worse for an AI agent improvising a project structure from scratch, because there's no single "correct" pattern for it to reach for.
Dash doesn't force that decision on you as often. Though the choice technically still exists (Dash components are React components under the hood, and you can write your own if you need to) but Plotly and the community have already built and battle-tested the ones most apps need, so callbacks are the default way state moves without anyone having to reach for a custom component or a separate state library to get there. There's one tried-and-true pattern, so there's one thing for Claude to get right, and one thing for you to learn if you need to change it later. Fewer decisions during development keeps both the AI and the human on a maintainable path instead of a bespoke one.
It’s not just state, the wiring matters too
A "build me a dashboard" prompt rarely wants just one chart sitting on a page by itself. It wants three or four charts that talk to each other: click a bar in one, the table below filters to match; hover a point on the scatter plot, a detail panel updates; drag a selection across a time series, everything else on the page recomputes against just that window. It’s called cross-filtering, and it has less to do with any individual chart library and everything to do with where state lives and how it gets from one component to another.
In Dash, cross-filtering is the same pattern already used for everything else in the app. One chart's clickData or selectedData prop is an Input, another chart's figure prop is an Output, and the callback in between recomputes whatever the second chart needs to show. It's one more Input-Output pair, wired the same way as the dropdown that populates a table. Nothing new to learn, and nothing new for Claude to invent.
In React, that same interaction has no single answer, because React doesn't have an opinion on where shared state should live, the same fork-in-the-road problem from the last section, applied to interactivity instead of app-wide state. Claude has to decide whether to lift the selection into a parent component, hoist it into context, or push it into whatever state library the project already happened to pick. Then it has to write an event handler on the first chart that updates that shared value, a subscription on the second chart that reads it, and, if the update needs new data rather than just a re-render, a fresh call back to whatever back end is supplying it, the same fragile seam described earlier in this piece. Multiply that by four or five linked charts on one dashboard and it stops being a small decision. It's now a thorny state-architecture problem, solved per project, with no default pattern to fall back on the way Dash's callback model already provides.
Enterprise-grade components make this gap wider. Dash AG Grid ships as a Dash component, so filtering, sorting, pivoting, and cell edits all flow through the same callback model as everything else in the app. An edit fires an Output, and whatever needs to react to it does, automatically. Wire the plain AG Grid library into a React app instead, and the grid manages a lot of its own state imperatively, through its own API, gridApi.setFilterModel, onCellValueChanged, and so on, which then has to be manually bridged back into React's declarative state model any time something outside the grid needs to know what changed inside it. That bridge is code an AI agent writes once and rarely revisits, which is where the inconsistent UX and the filter that quietly stops filtering tend to stem from.
Performance follows the same shape. Downsampling a chart that's about to choke on a hundred thousand points is, in Dash, a pandas operation, the same resampling or aggregation you'd already reach for in a notebook. In React, keeping a page of linked, high-frequency components responsive usually means correctly reaching for useMemo, useCallback, and React.memo to stop components from re-rendering each other into a crawl, a set of tools whose entire job is managing the consequences of the state-sharing problem above. Get a dependency array wrong on any of them, one of the most common bug classes in React code, and a chart quietly stops updating, or the whole page re-renders incessantly.
None of this is a knock on any individual charting library, but Dash's components already know how to talk to each other, and React's don't, not natively, which means every dashboard with more than one interactive element asks Claude to build the wiring between components from scratch, get it right the first time, and hope nobody needs to touch it again in six months.
Don’t chase bugs across the seams
Every AI-generated app eventually has a bug. The question is how far you have to dig to find it.
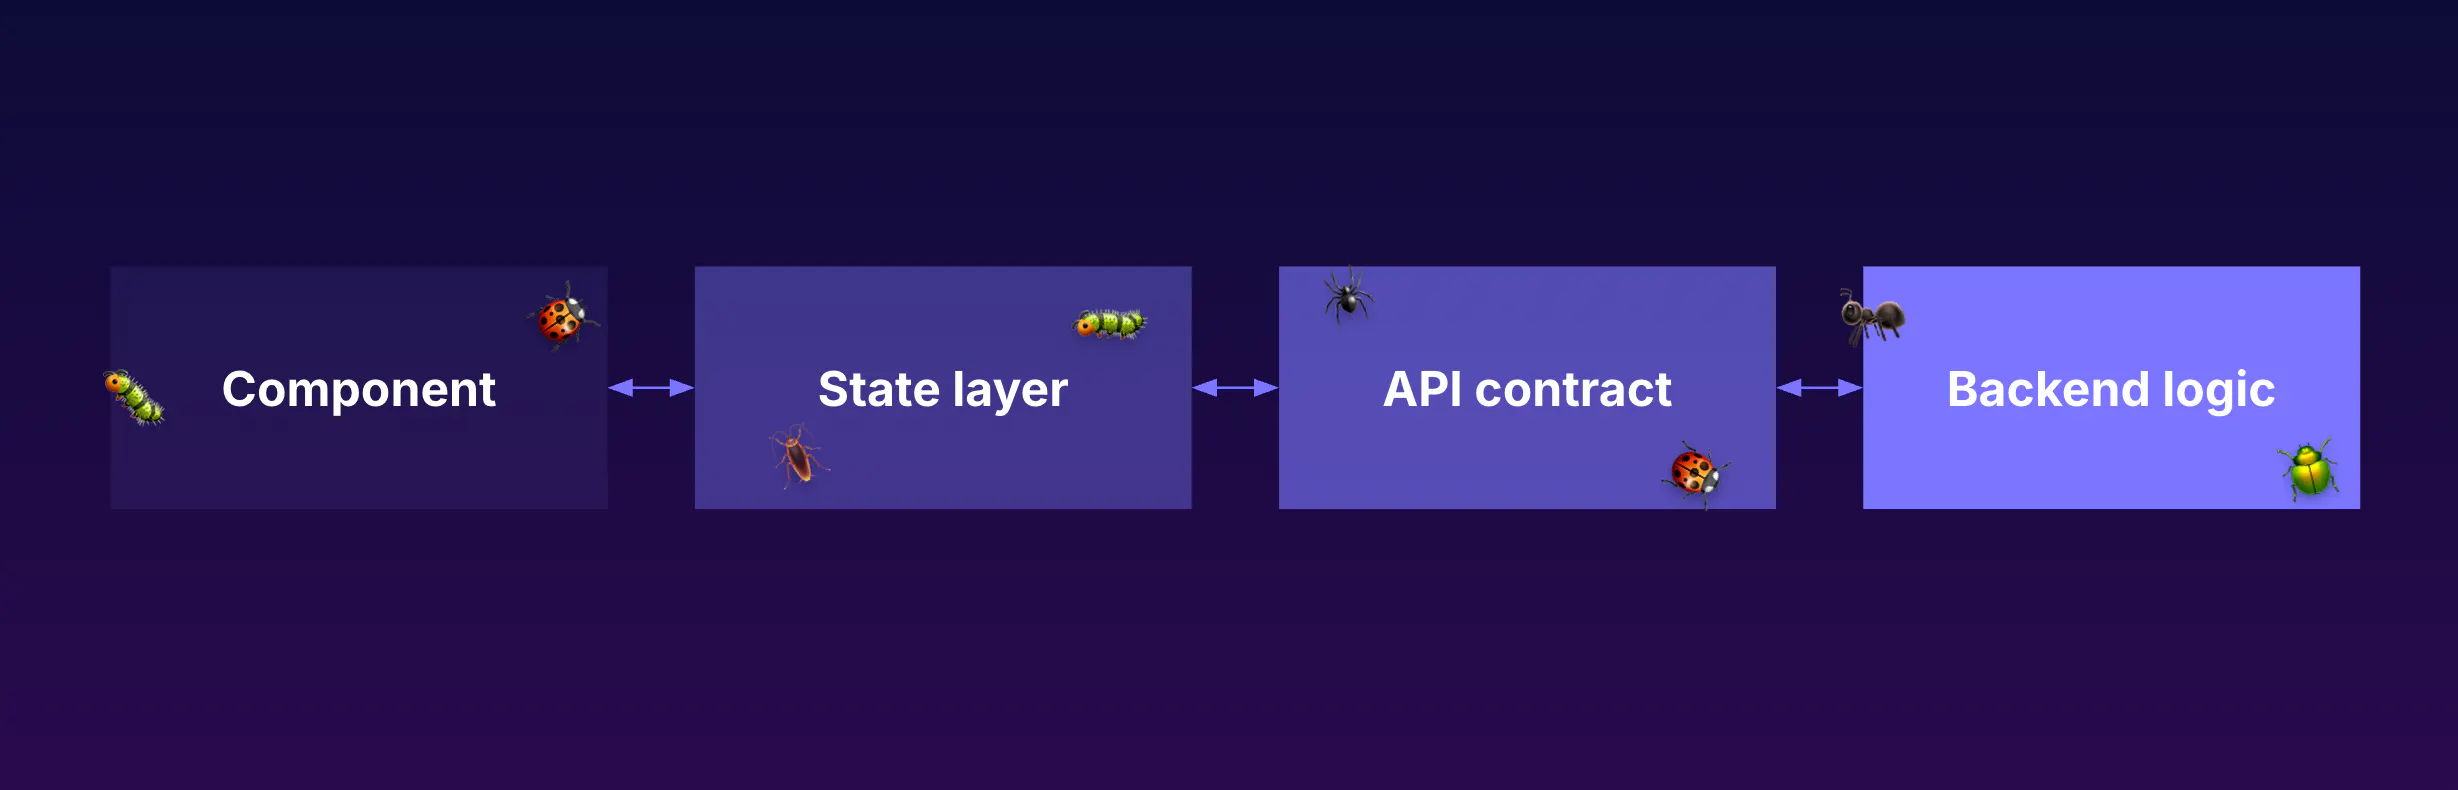
In a typical full-stack app, a bug could be in the component, the state layer, the API contract, or the back end logic, and it's often some interaction between two of those. Fixing it means understanding both halves and the handshake connecting them, whether you're debugging it yourself or asking Claude to.
In a single-process Dash app, there's just less of it. One language, one runtime, one place for the problem to live – a smaller blast radius for Claude to reason about when something goes wrong, and a much shorter path for you to walk when you need to understand why.
Up next
That's the case for why Dash is the easier, safer bet on day one, but most vibe-coded apps don't get judged on the day they ship. They get judged eight months later, when the person who built it has moved on, or when something buried in a thousand-package dependency tree gets flagged by a security scanner. Join us next time as we examine the risks you don’t see on day one in Part 2.