From Prompt to Production: Building Real-Time Data Application with AI
In today's fast-paced data environment, the ability to quickly transform raw data into actionable insights is crucial.
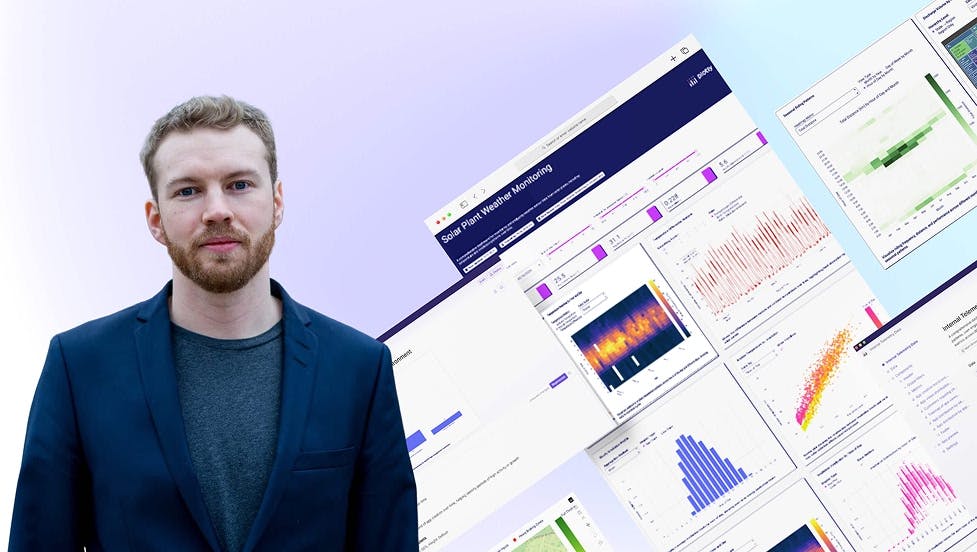
This session demonstrates how Plotly AI revolutionizes the dashboard development process by enabling natural language-driven creation of sophisticated data applications. The demonstration will follow a real-world workflow:
- Data Ingestion & Exploration: We'll begin with raw streaming data and use Plotly AI's natural language interface to explore and understand the dataset.
- Visualization Creation: Through simple prompts, we'll generate complex visualizations including time-series charts, geographic maps, and statistical plots that update in real-time.
- Dashboard Assembly: We'll demonstrate how Plotly AI can assemble individual visualizations into a cohesive, interactive dashboard with filtering capabilities and cross-filtering.
- Deployment & Sharing: Finally, we'll show how the resulting application can be instantly deployed and shared with stakeholders.
Throughout the demonstration, we highlight how Plotly AI:
- Generates Python code automatically from natural language descriptions
- Suggests optimal visualization types based on data characteristics
- Handles real-time data streams with up to 20 updates per second
- Enables rapid iteration through conversational refinement
Key Takeaways:
- How to leverage AI-assisted tools to accelerate the dashboard development process
- Techniques for building real-time data applications without extensive coding
- Best practices for translating business requirements into visualization specifications
- Strategies for deploying and sharing interactive data applications