Plotly Studio Overview: Agentic Data Analytics
Meet the Speaker

Matt Brown
Matt Brown is a Senior Product Manager at Plotly.
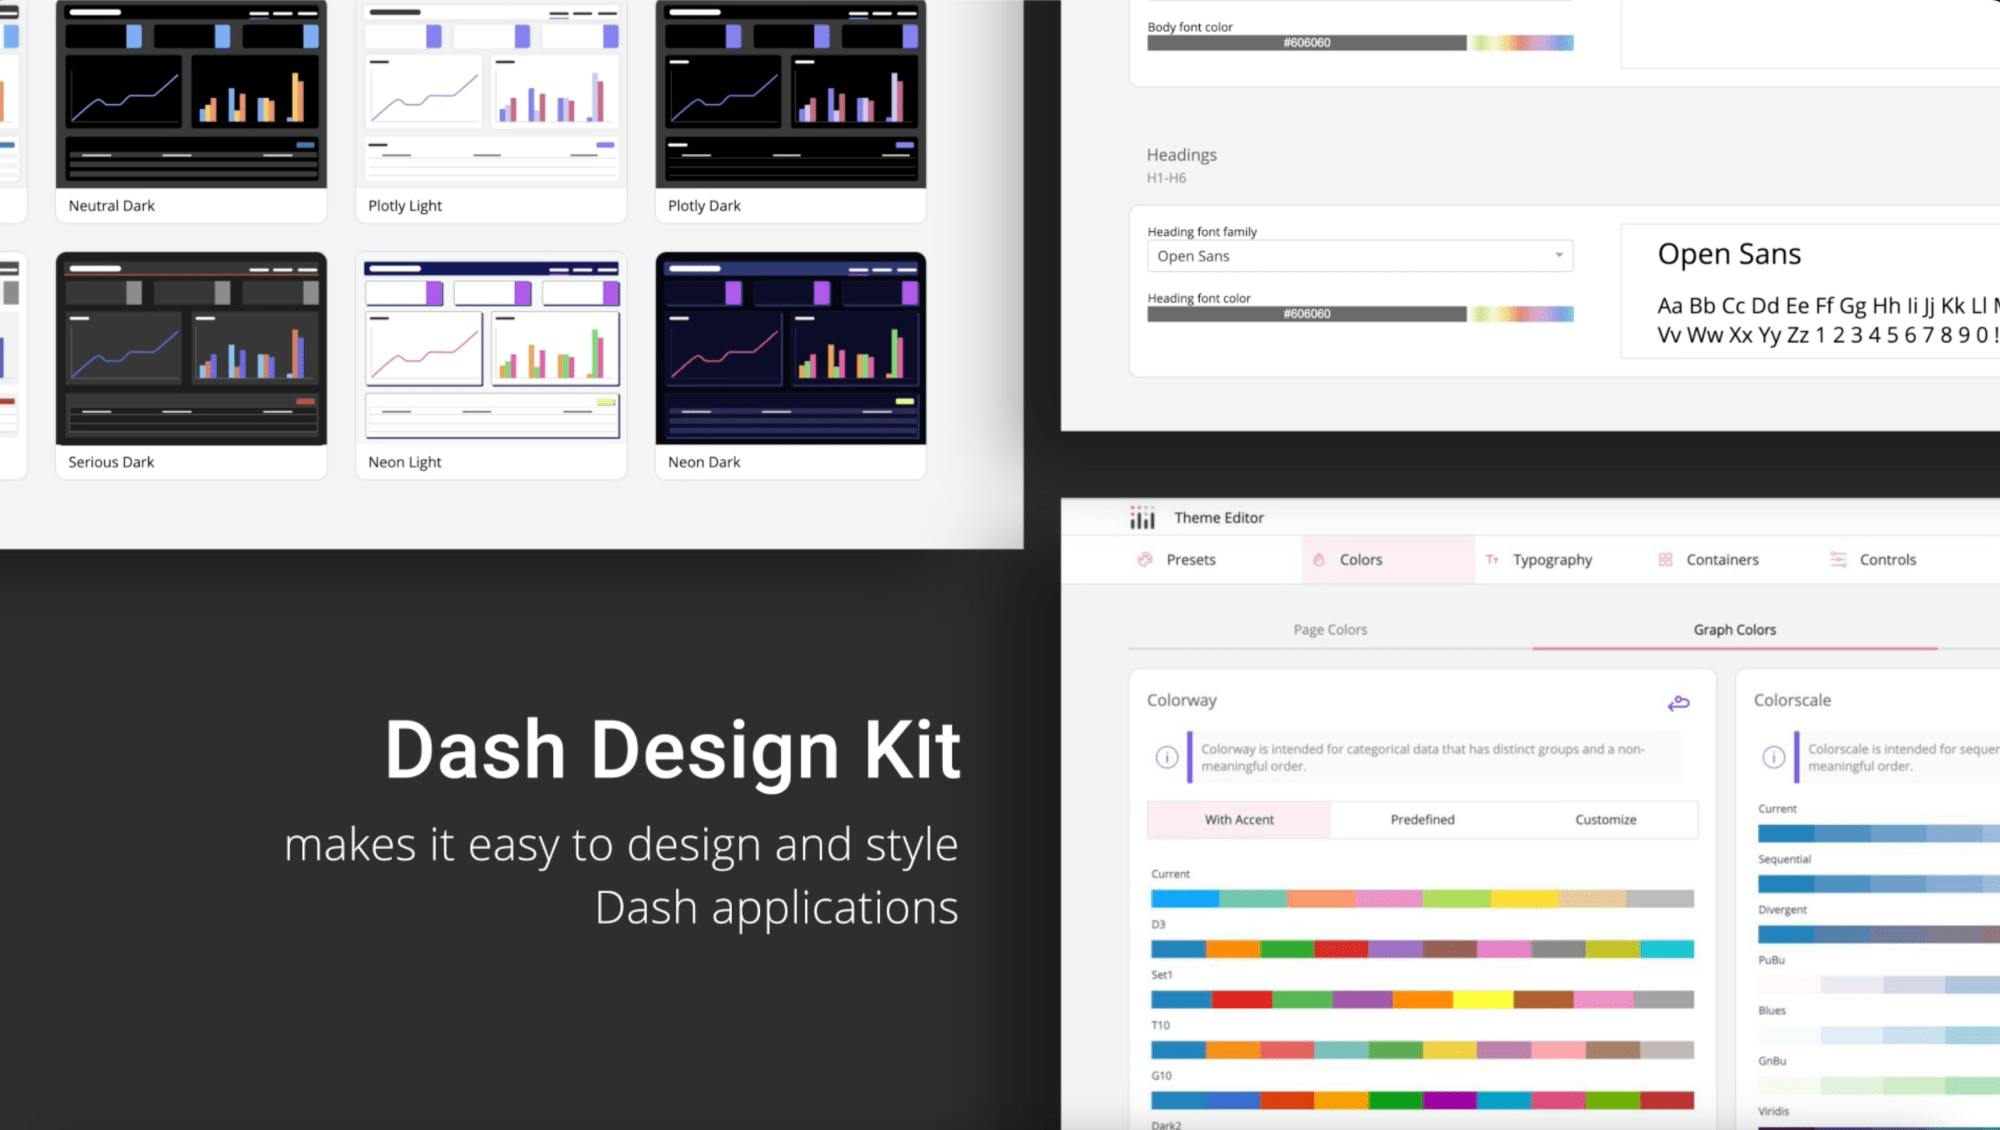
The video presents Plotly Studio as a new way to move beyond the limitations of traditional BI tools. Instead of rigid interfaces or steep coding requirements, Plotly Studio introduces vibe analytics, which uses large language models to generate sophisticated data apps directly from your data and natural language instructions.
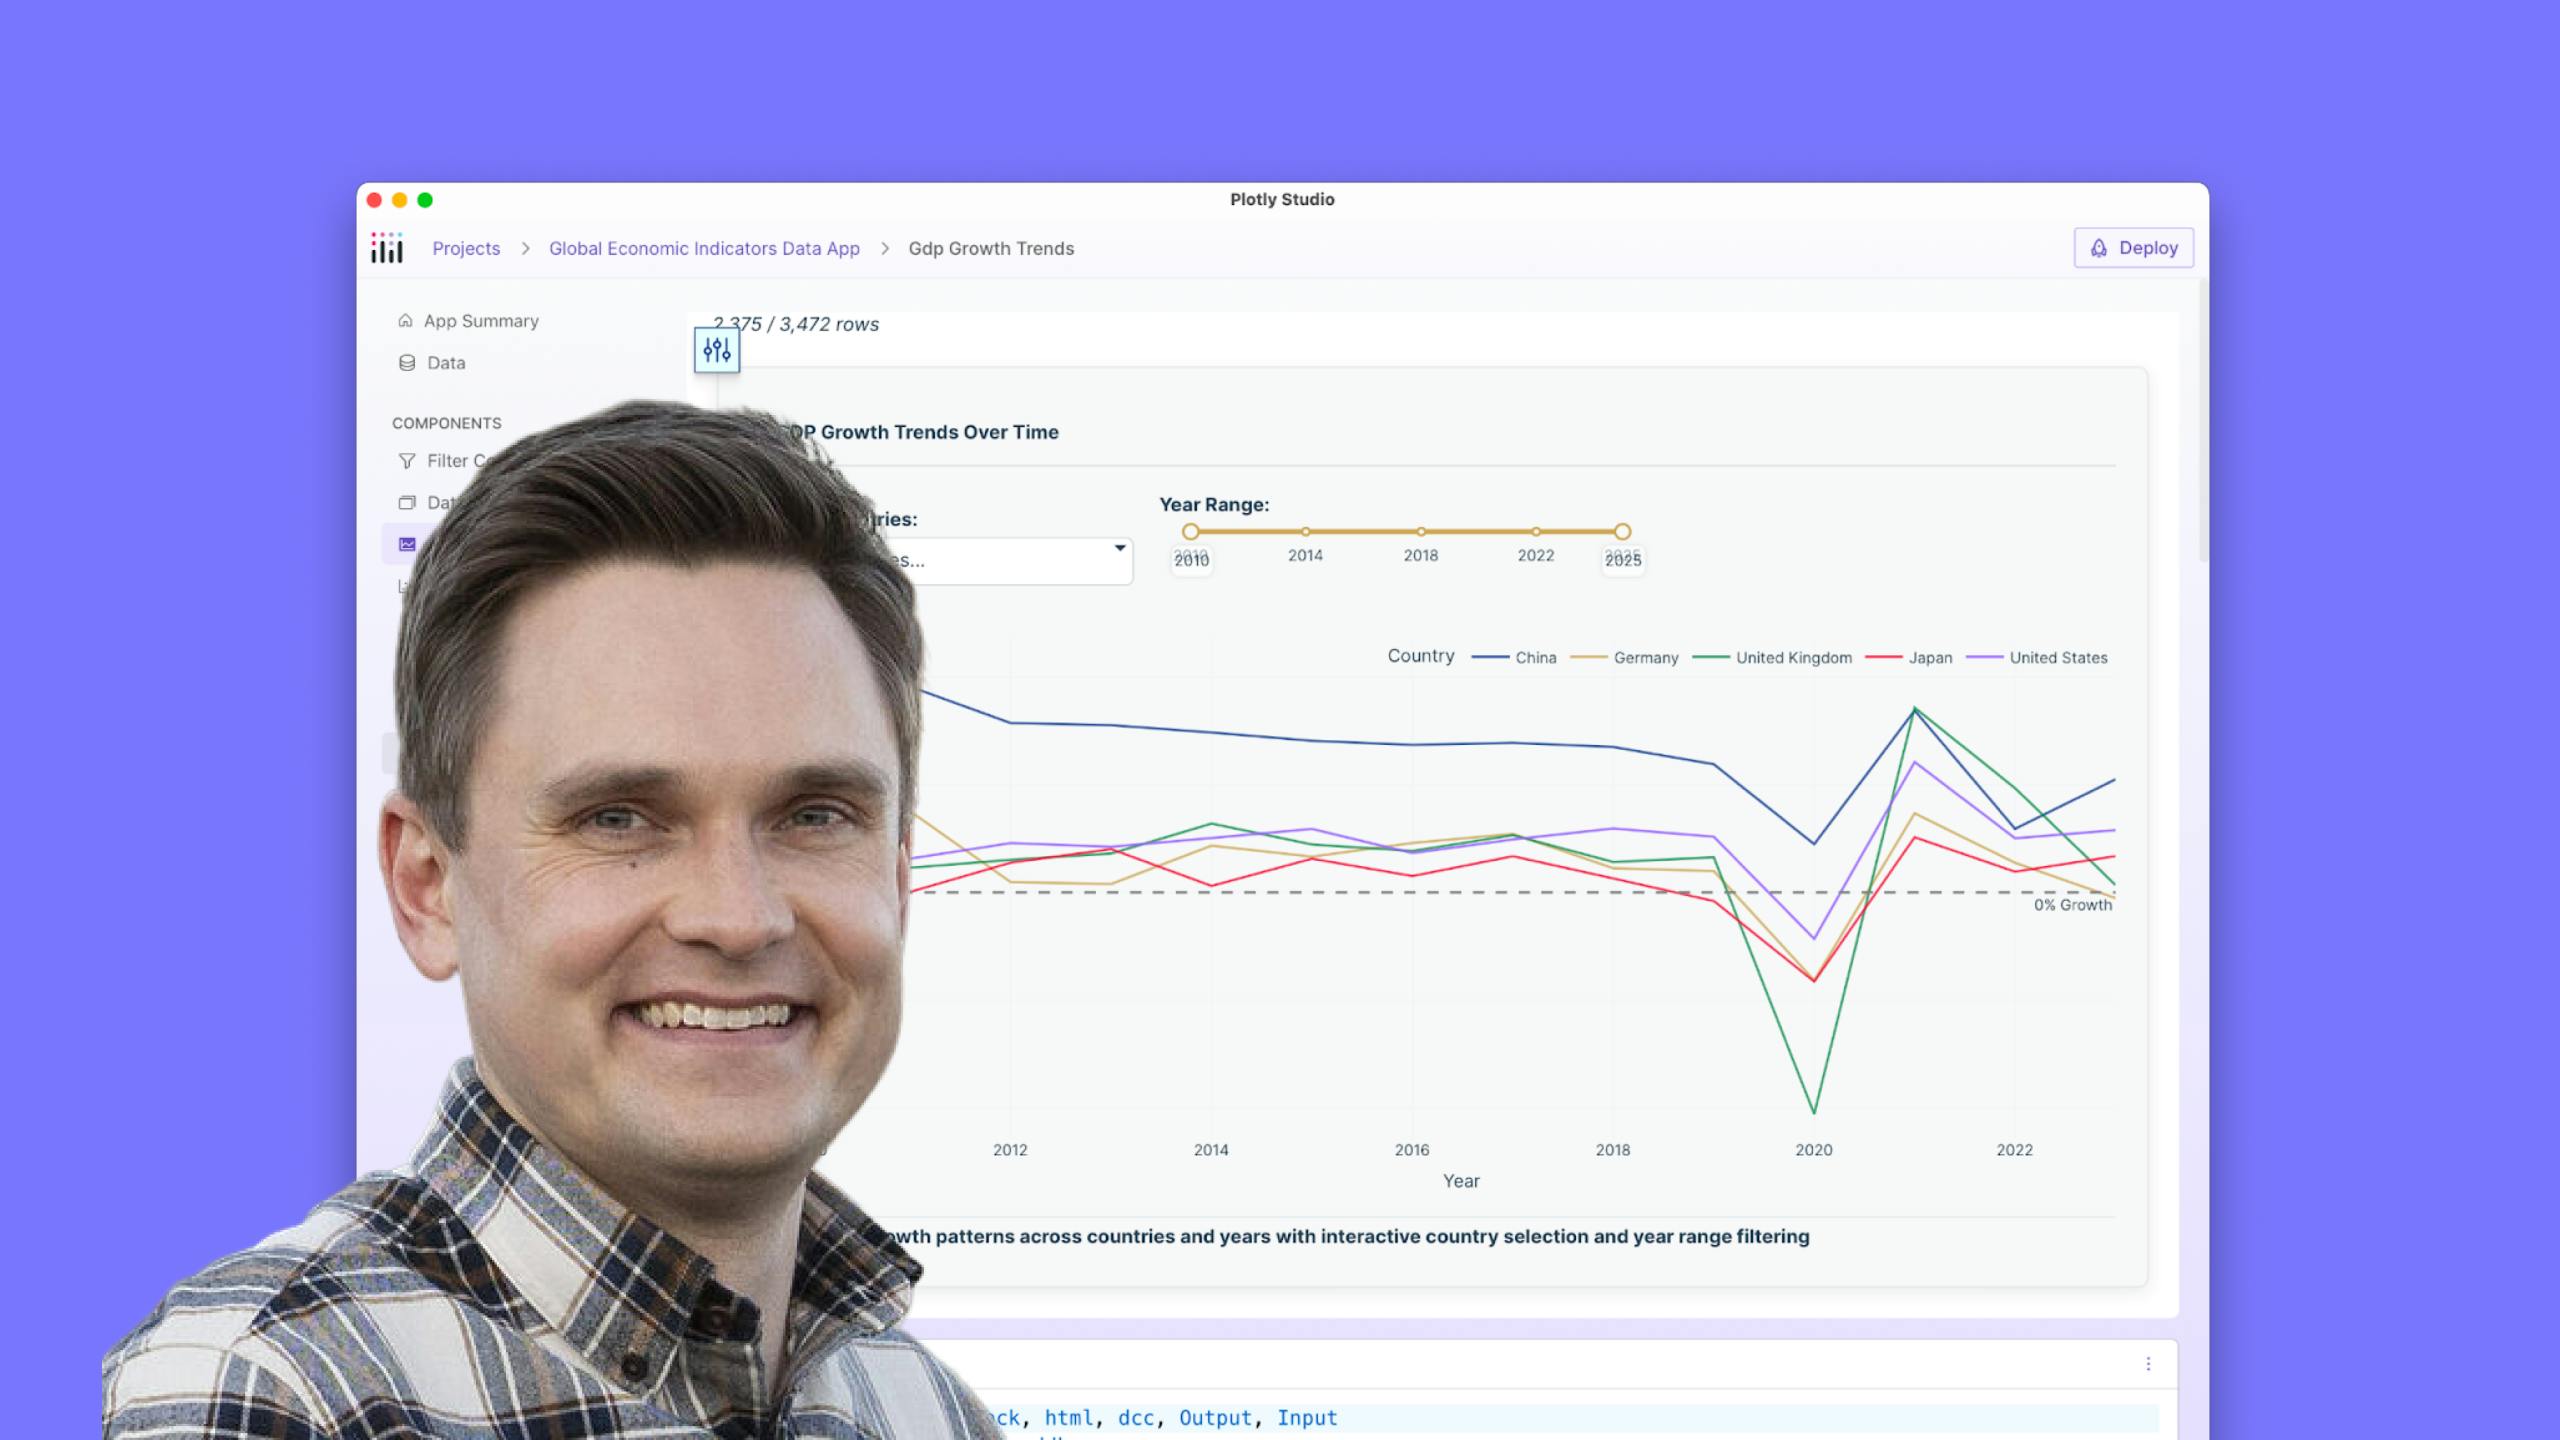
Plotly Studio is a desktop application that bundles years of best practices in visualization and dashboard design. Users can request analyses in plain text, and the platform builds interactive apps with global filters, chart specific inputs, and searchable tables. Charts can be created or modified by simply describing what is needed, such as a stock performance chart with sector filters. Everything generated is backed by code, but a natural language specification keeps it accessible for those who prefer to avoid direct coding.
Key highlights include
- Natural language input for chart creation and iteration
- Automatic code generation synchronized with plain English specifications
- Integration with Plotly Cloud and Dash Enterprise for simple publishing
- Enterprise features like private LLMs, advanced security, and unlimited hosted apps
- Over 90 percent success rate in app generation on first try during testing
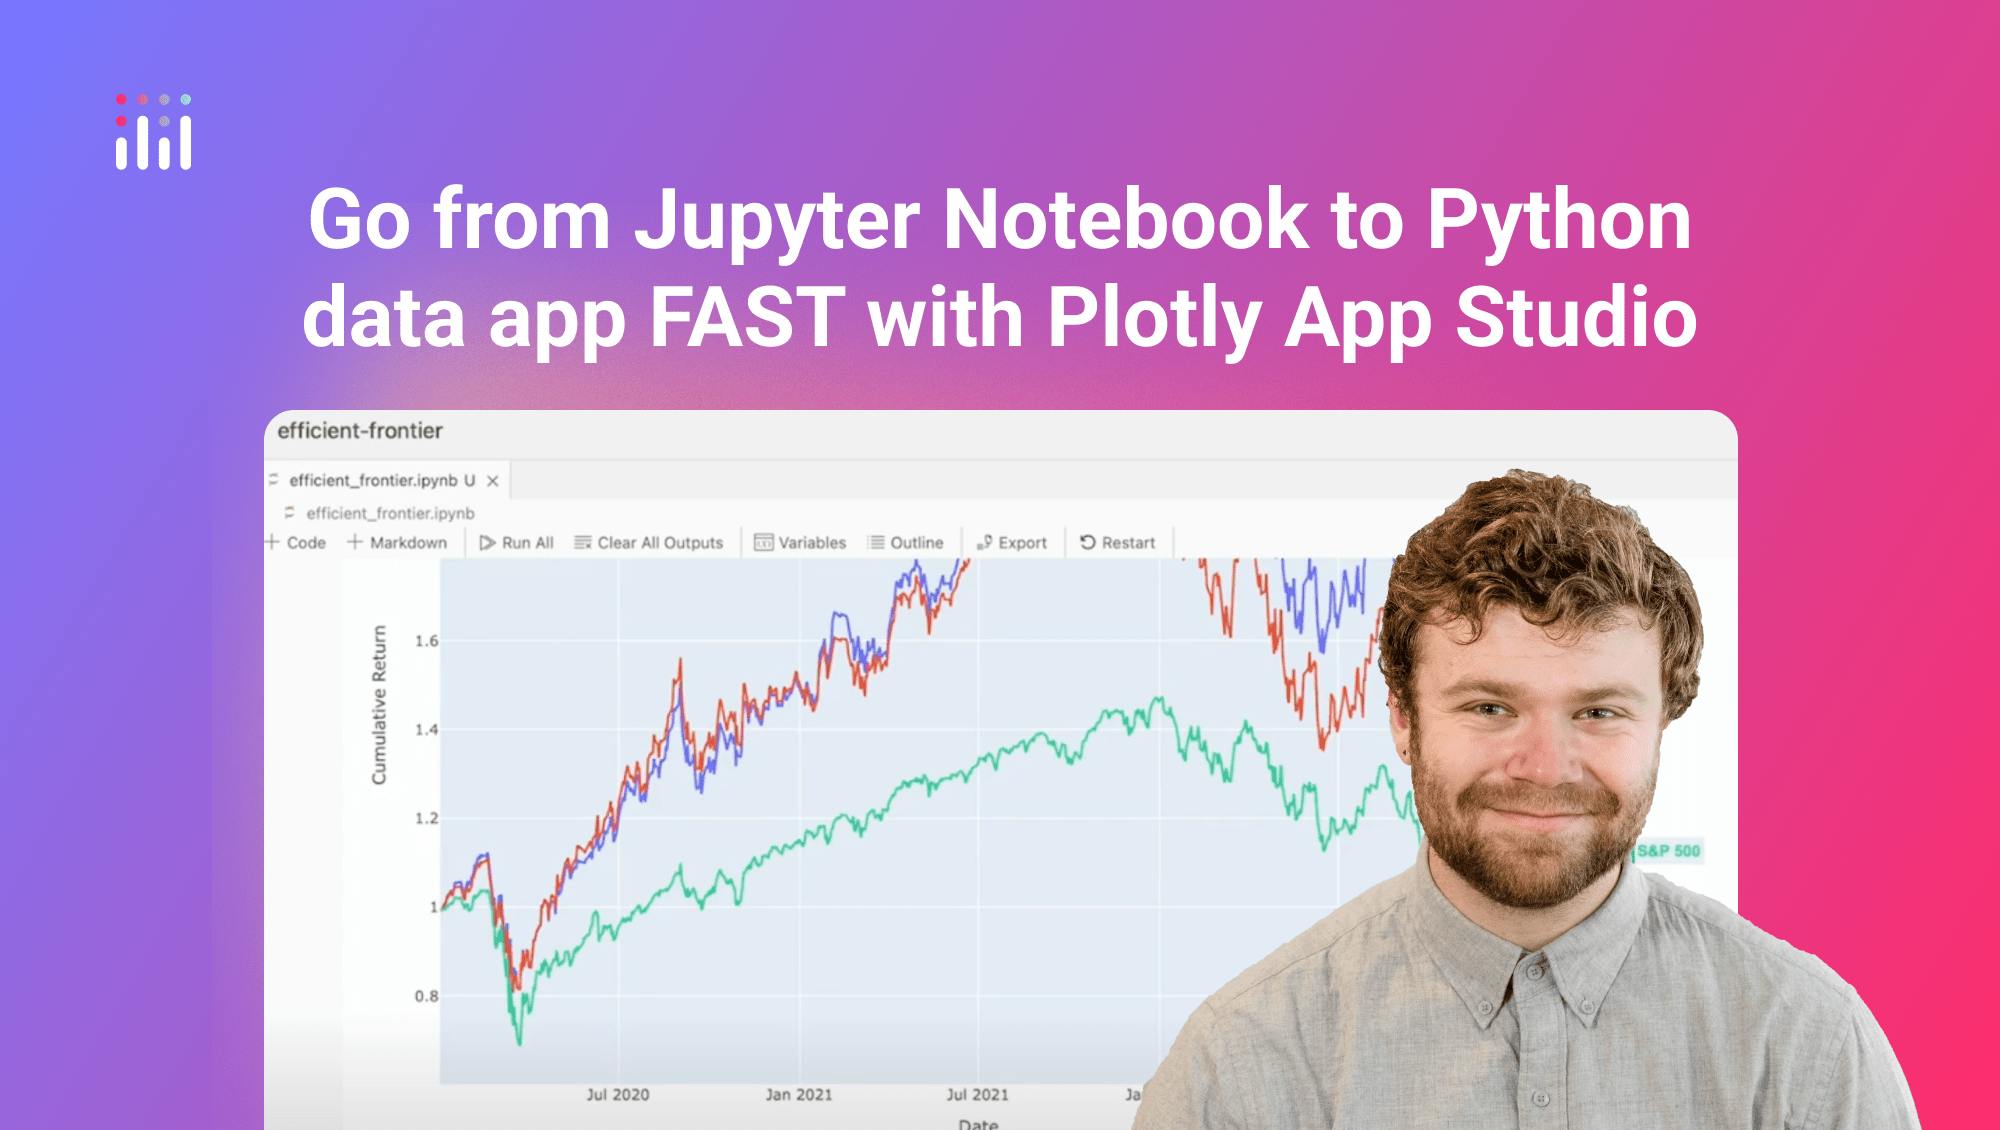
The video emphasizes speed and accessibility, showing how a raw CSV can become a working app in minutes. It also highlights deployment options, from one click publishing on Plotly Cloud to enterprise scale hosting with Dash Enterprise.
Watch the video to follow along.