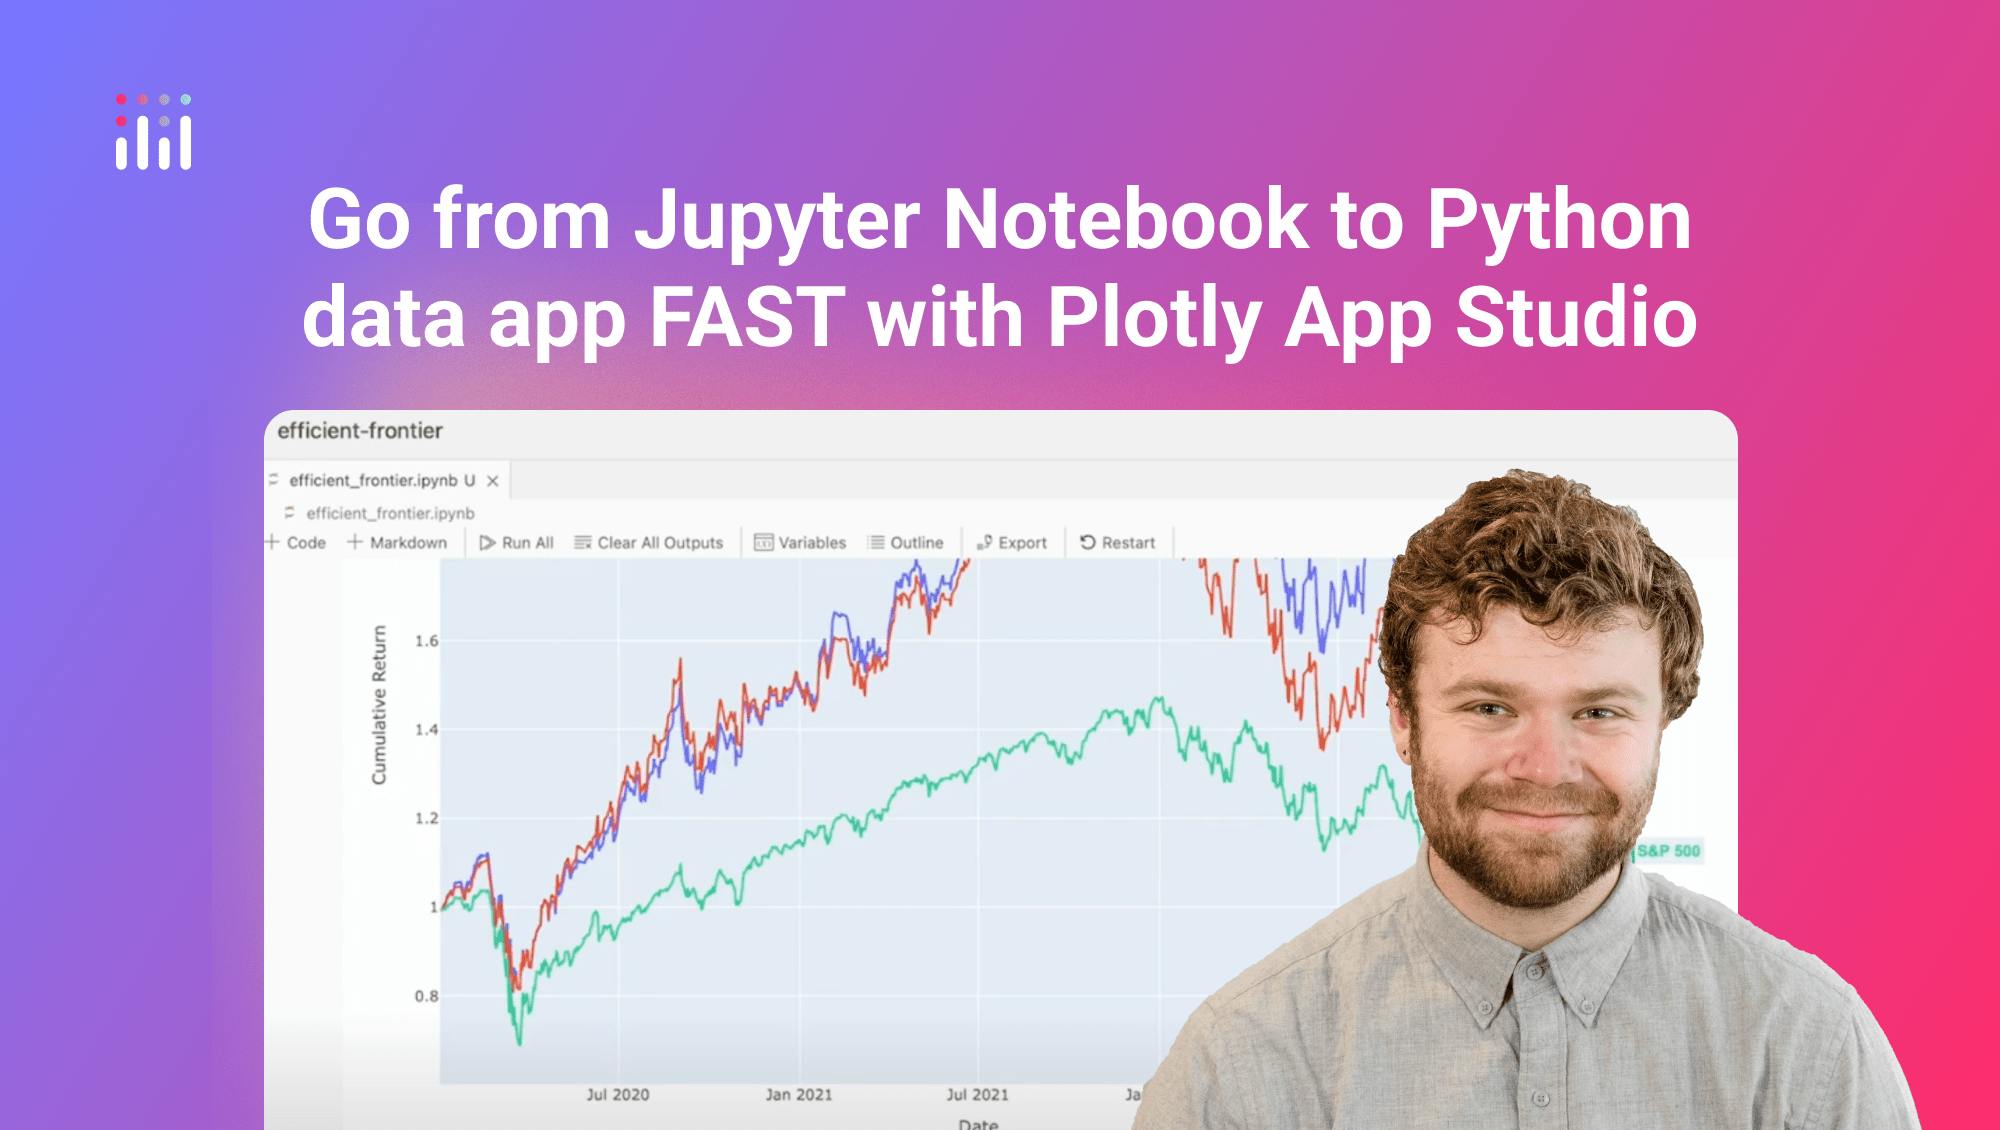
Plotly Studio In 60 Seconds

Meet the Speaker

Matt Brown
Matt Brown is a Senior Product Manager at Plotly.
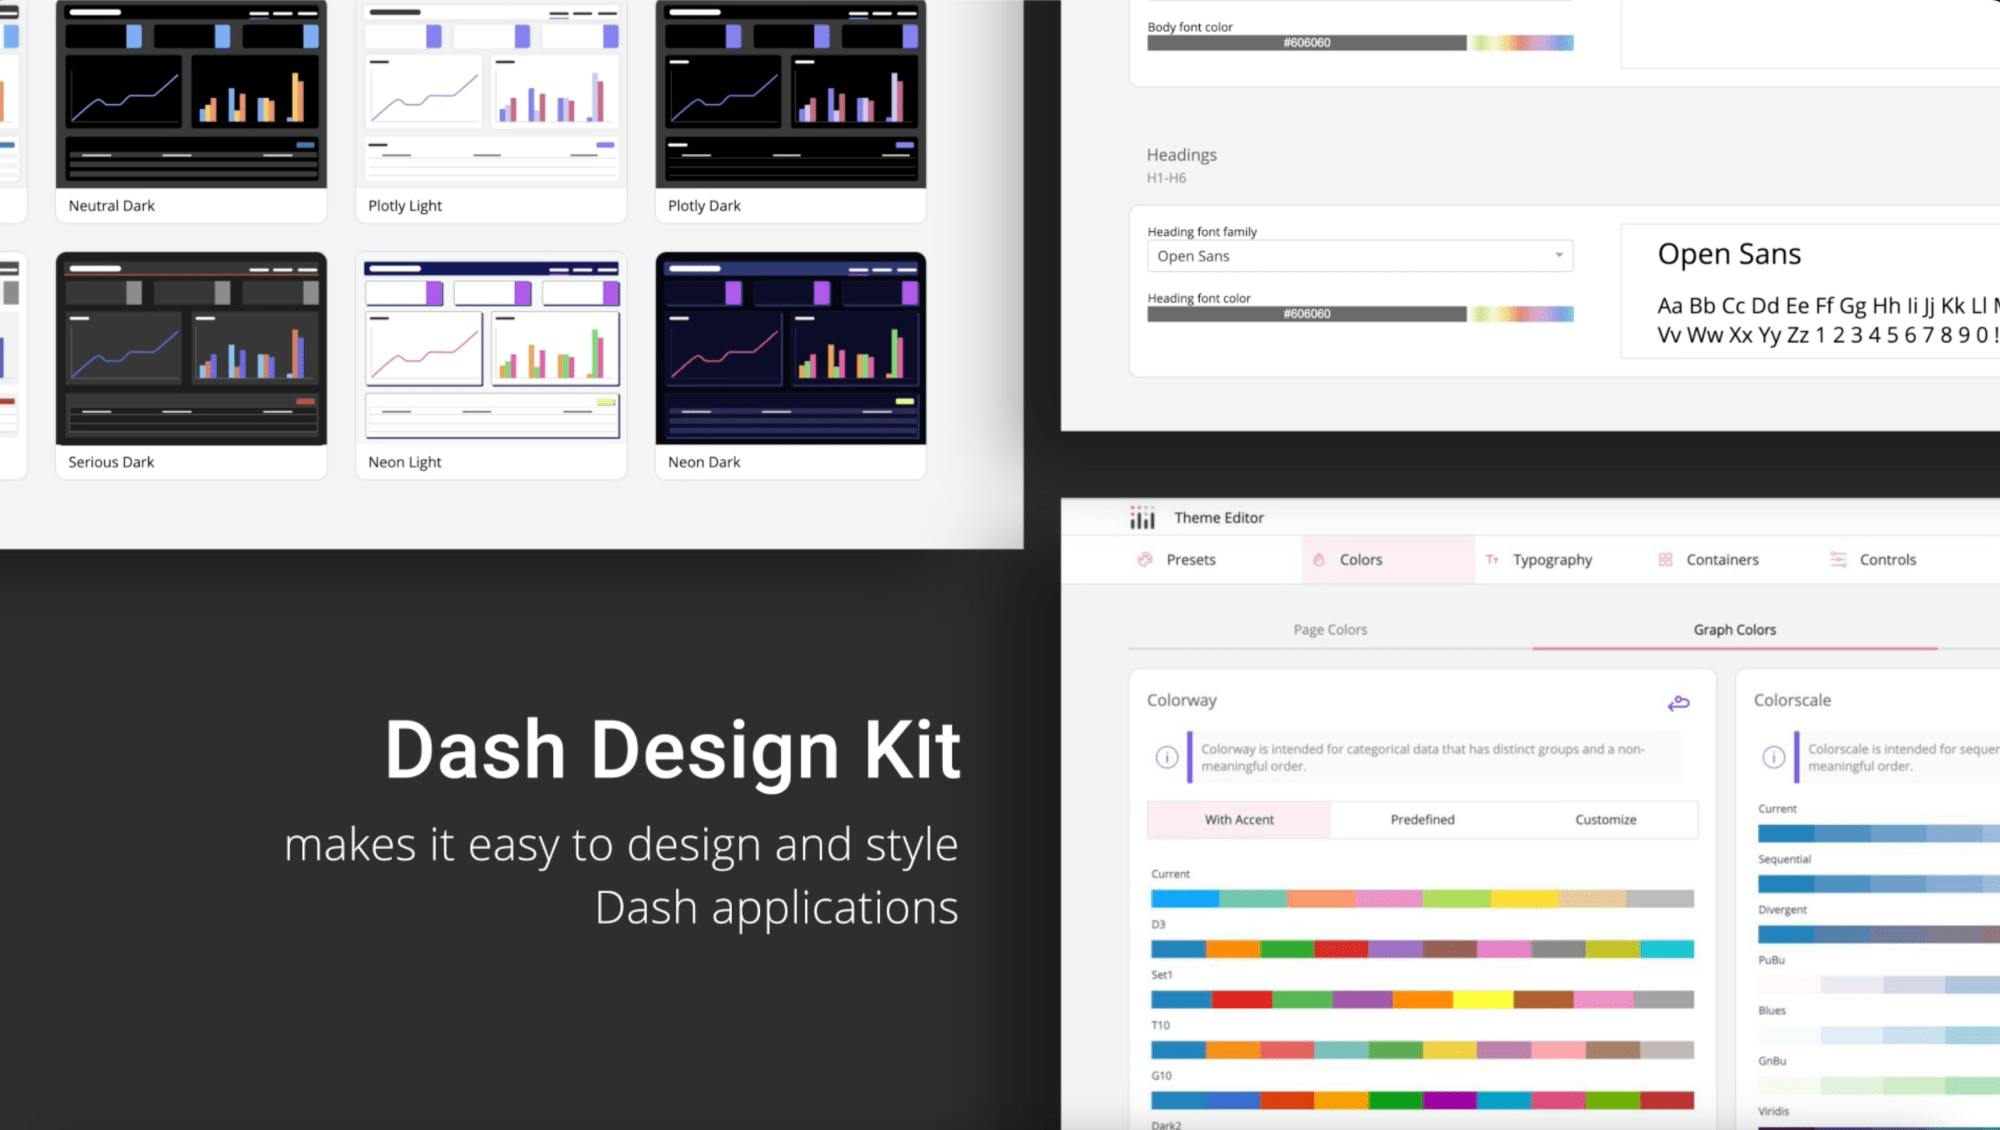
The video gives a fast walkthrough of how Plotly Studio turns raw data into a polished interactive data app in just minutes. It starts by dragging and dropping a dataset, then prompting the AI with goals or questions to generate an app outline. The outline suggests a title, description, charts, filters, and theme, all of which can be customized before the dashboard is built.
While the AI builds components, you can already interact with them. Charts and filters can be opened early for quick edits. Refinements can be made through natural language descriptions or by editing the underlying code directly for precision. New analyses are easy to add at any time using the add button, simply by describing the chart or insight you want.
Once the data app is complete, publishing is one click. Apps can be shared instantly through Plotly Cloud or Dash Enterprise, making it simple to distribute insights across a team or make them public.
Highlights covered
- Drag and drop data with instant AI analysis
- Customizable outlines for charts, filters, and themes
- Live editing of charts while the app builds
- Natural language or code level refinement
- One click publishing to Cloud or Enterprise
Watch the video to follow along, or join the next live demo to see it in action.