Plotly App Studio Demo
Meet the Speaker

Matt Brown
Matt Brown is a Senior Product Manager at Plotly.
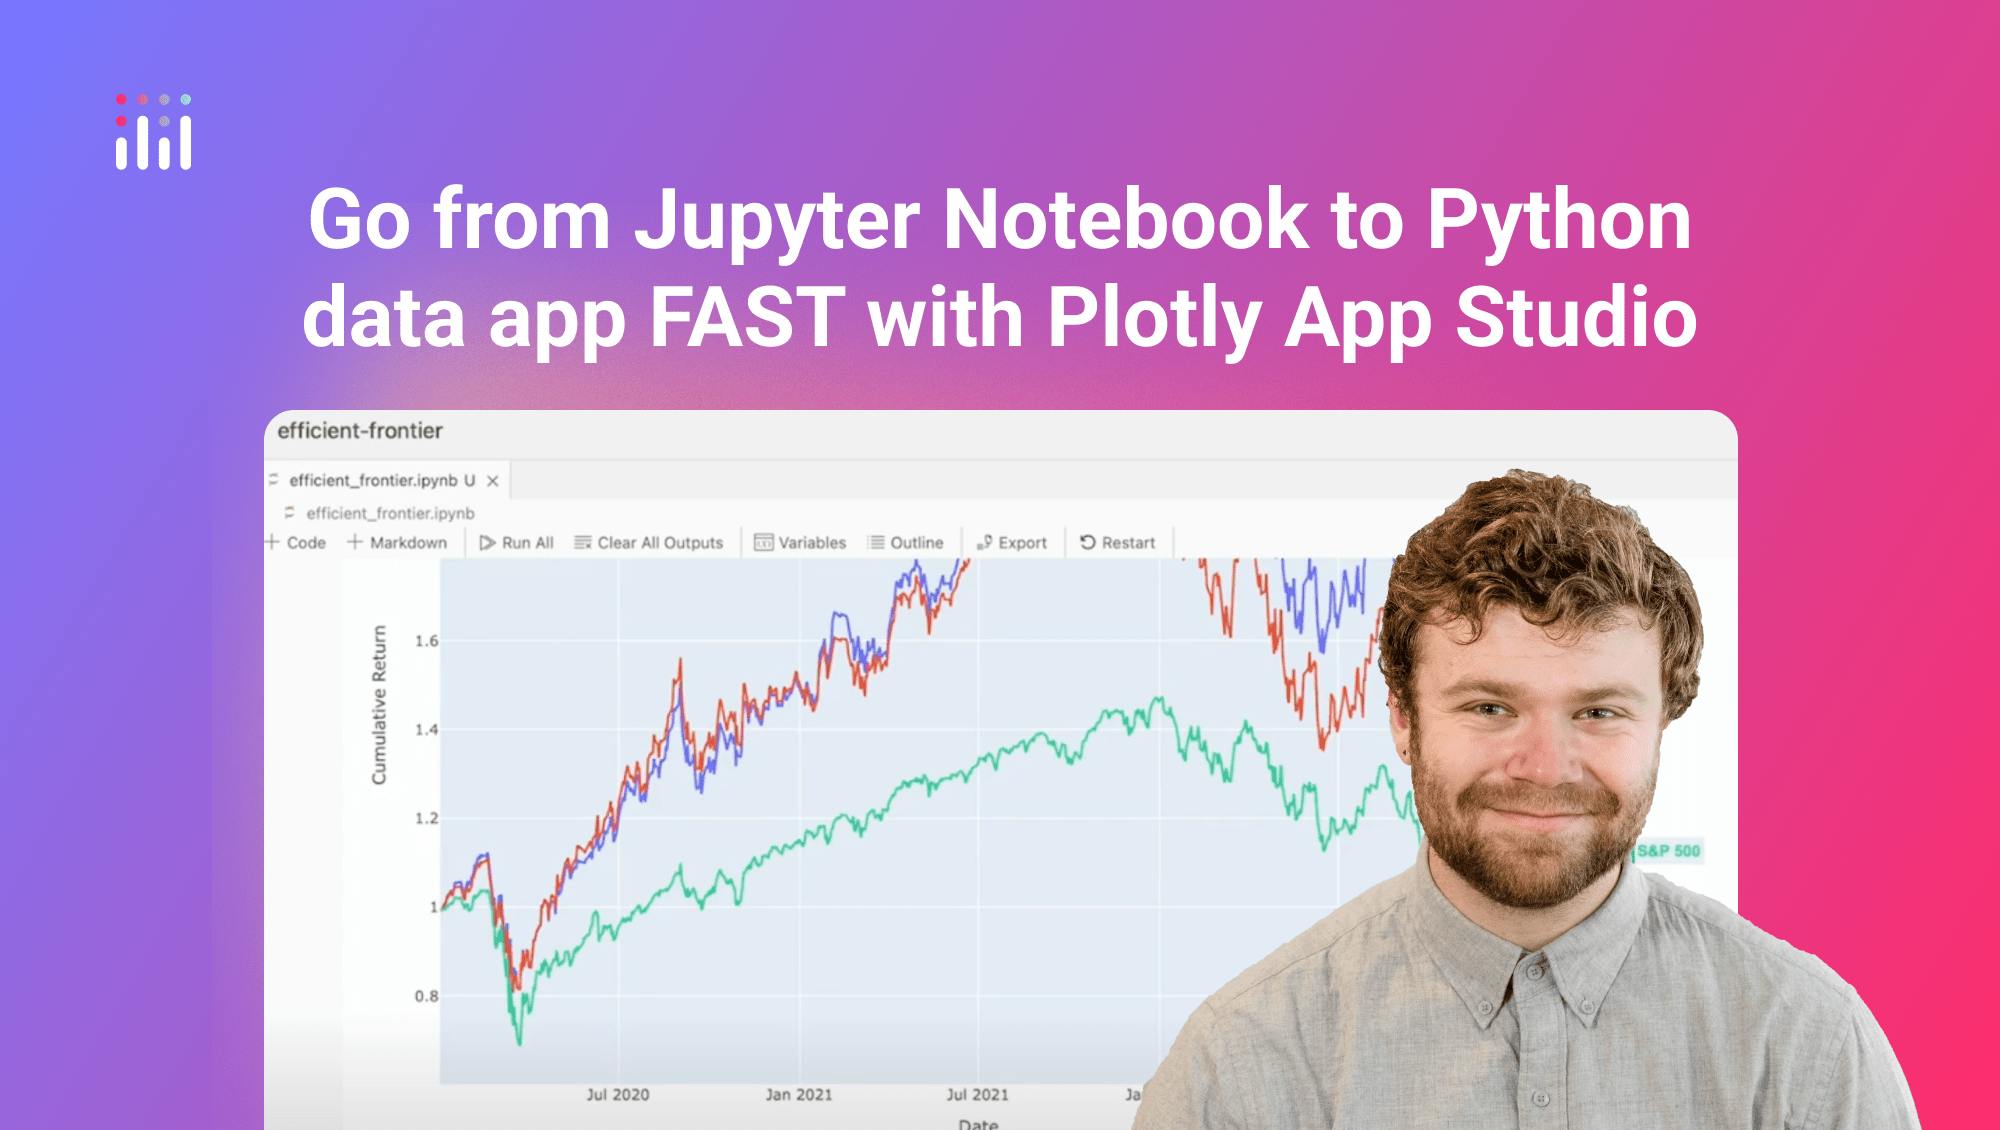
Matt Brown, Senior Product Manager at Plotly, walks through new features added to App Studio in Dash Enterprise 5.7, highlighting key upgrades that simplify building and deploying Dash apps from Jupyter Notebooks. The updates focus on ease of use, faster workflows, and more control for developers and analysts working in Python.
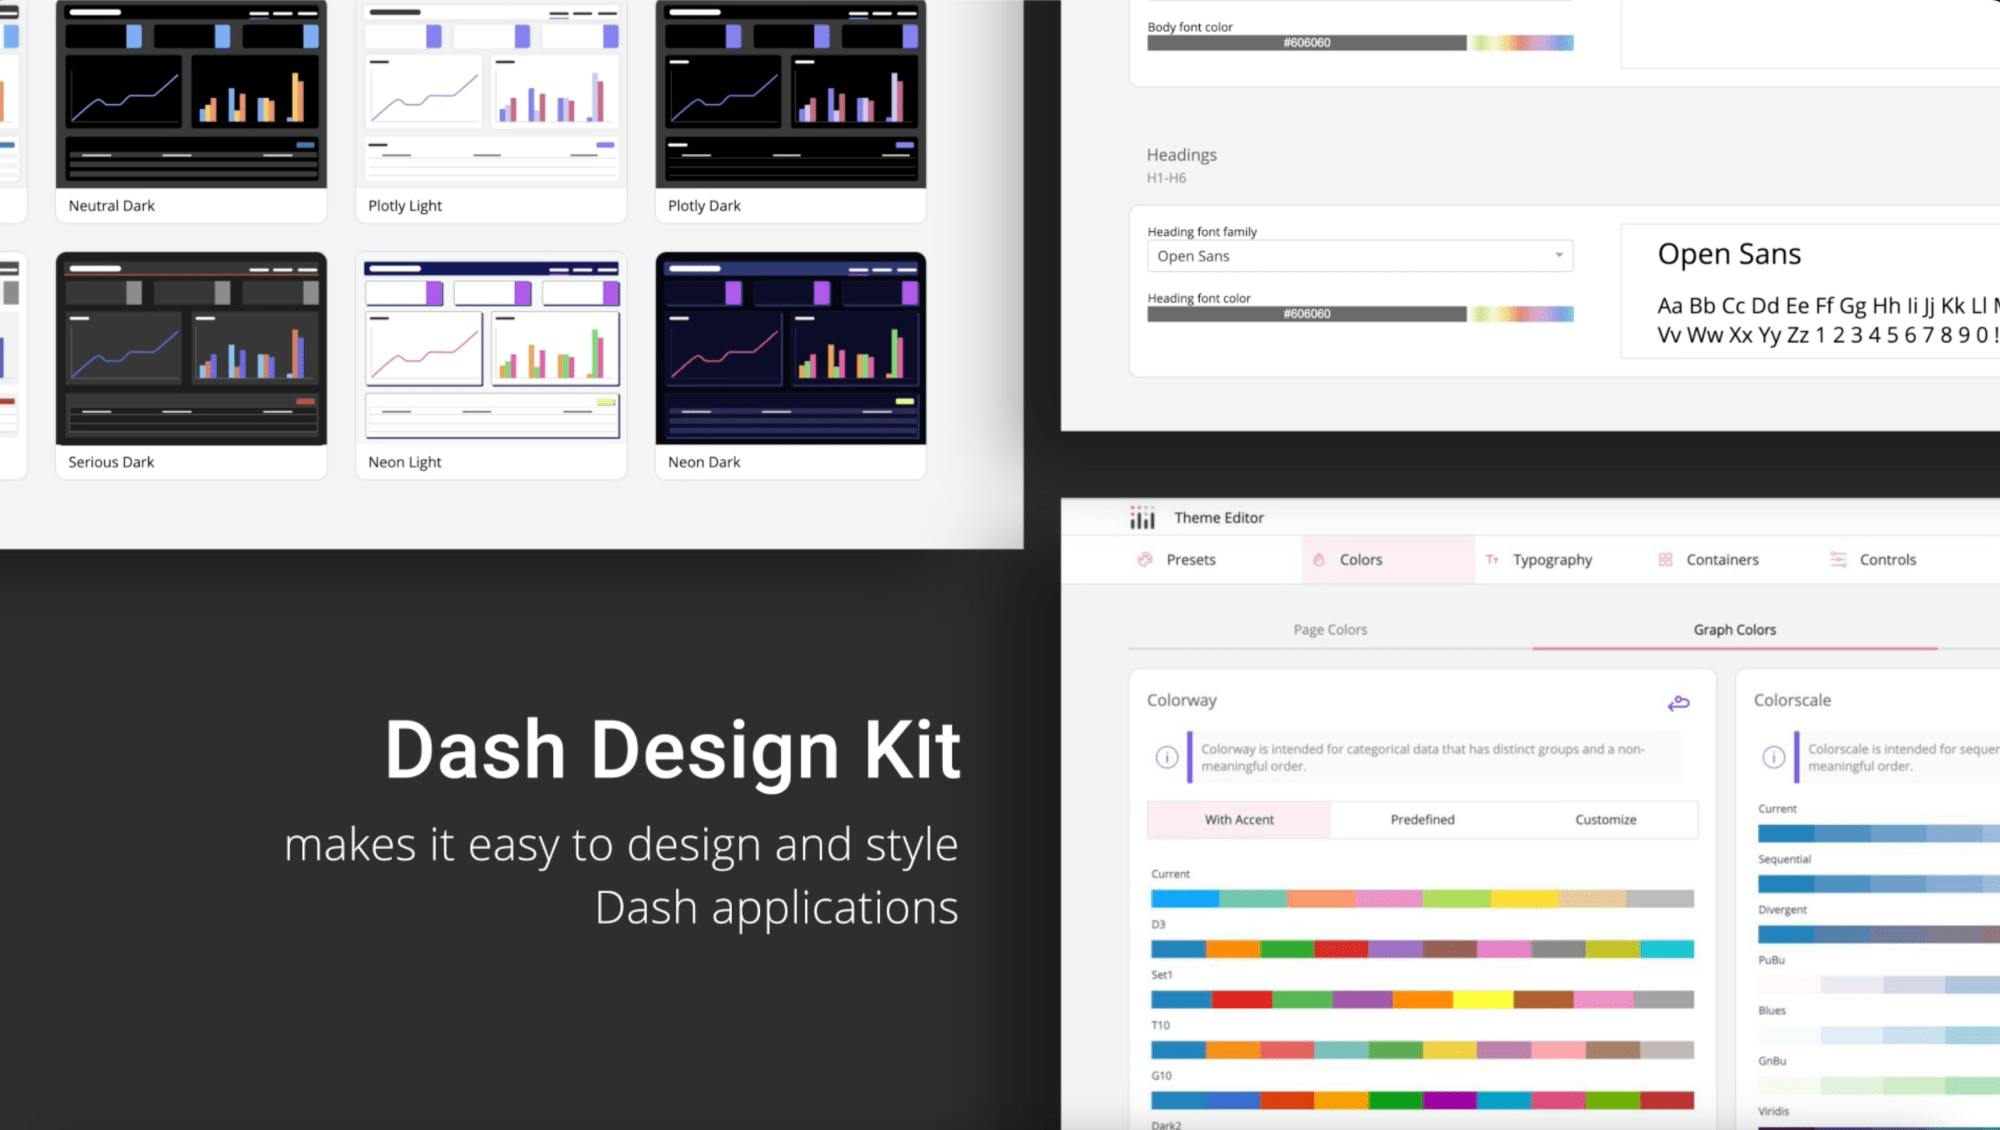
A major enhancement is the improved Explore Mode. Introduced in 5.6 for quick chart generation with Plotly Express, Explore Mode now includes a table editor with sorting, filtering, grouping, and aggregation. Users can quickly manipulate dataframes through a UI, then move directly into charting. All interactions generate reproducible code using a new transform library, which can be reviewed and inserted into the notebook.
Key improvements in Explore Mode include:
- Column-level filters and summary stats
- Drag-and-drop column selection and layout reordering
- Grouping and aggregation logic with smart defaults and custom logic
- Integrated chart editor that syncs with the transformed data
Dash Enterprise 5.7 also introduces in-place code modification and deployment. Previously, exporting code to edit a Dash app meant starting a new workspace. Now users can eject and edit code directly within the same App Studio environment and redeploy without leaving the workspace.
Additional updates include:
- Python version selection for workspaces, supporting 3.9 to 3.12
- A drag-and-drop UI for layout management
- Click-to-edit components and simplified section layout tools
The walkthrough also demonstrates how to use the code preview and app ejection features to make low-level changes, such as editing the footer HTML, and then redeploying the app with one click.
Watch the video to see a full demo of these new features and how they streamline notebook-to-app workflows.