Introduction to Dash AG Grid - DataTable in Python

Meet the Speaker

Austin Kiesewetter
Austin Kiesewetter is a Plotly community member and software engineer at Martin Engineering.
The video introduces Dash AG Grid in Python and shows ten practical configurations you can reuse. It starts with community resources including a GitHub repo and Ann Marie’s AG Grid examples, plus Plotly’s docs for props and patterns. A minimal example runs in about twenty lines, with the grid itself defined in a few lines. The presenter notes a common Mac issue and fixes it by enabling SSL. Installation is shown with pip for dash ag grid.
Highlights covered
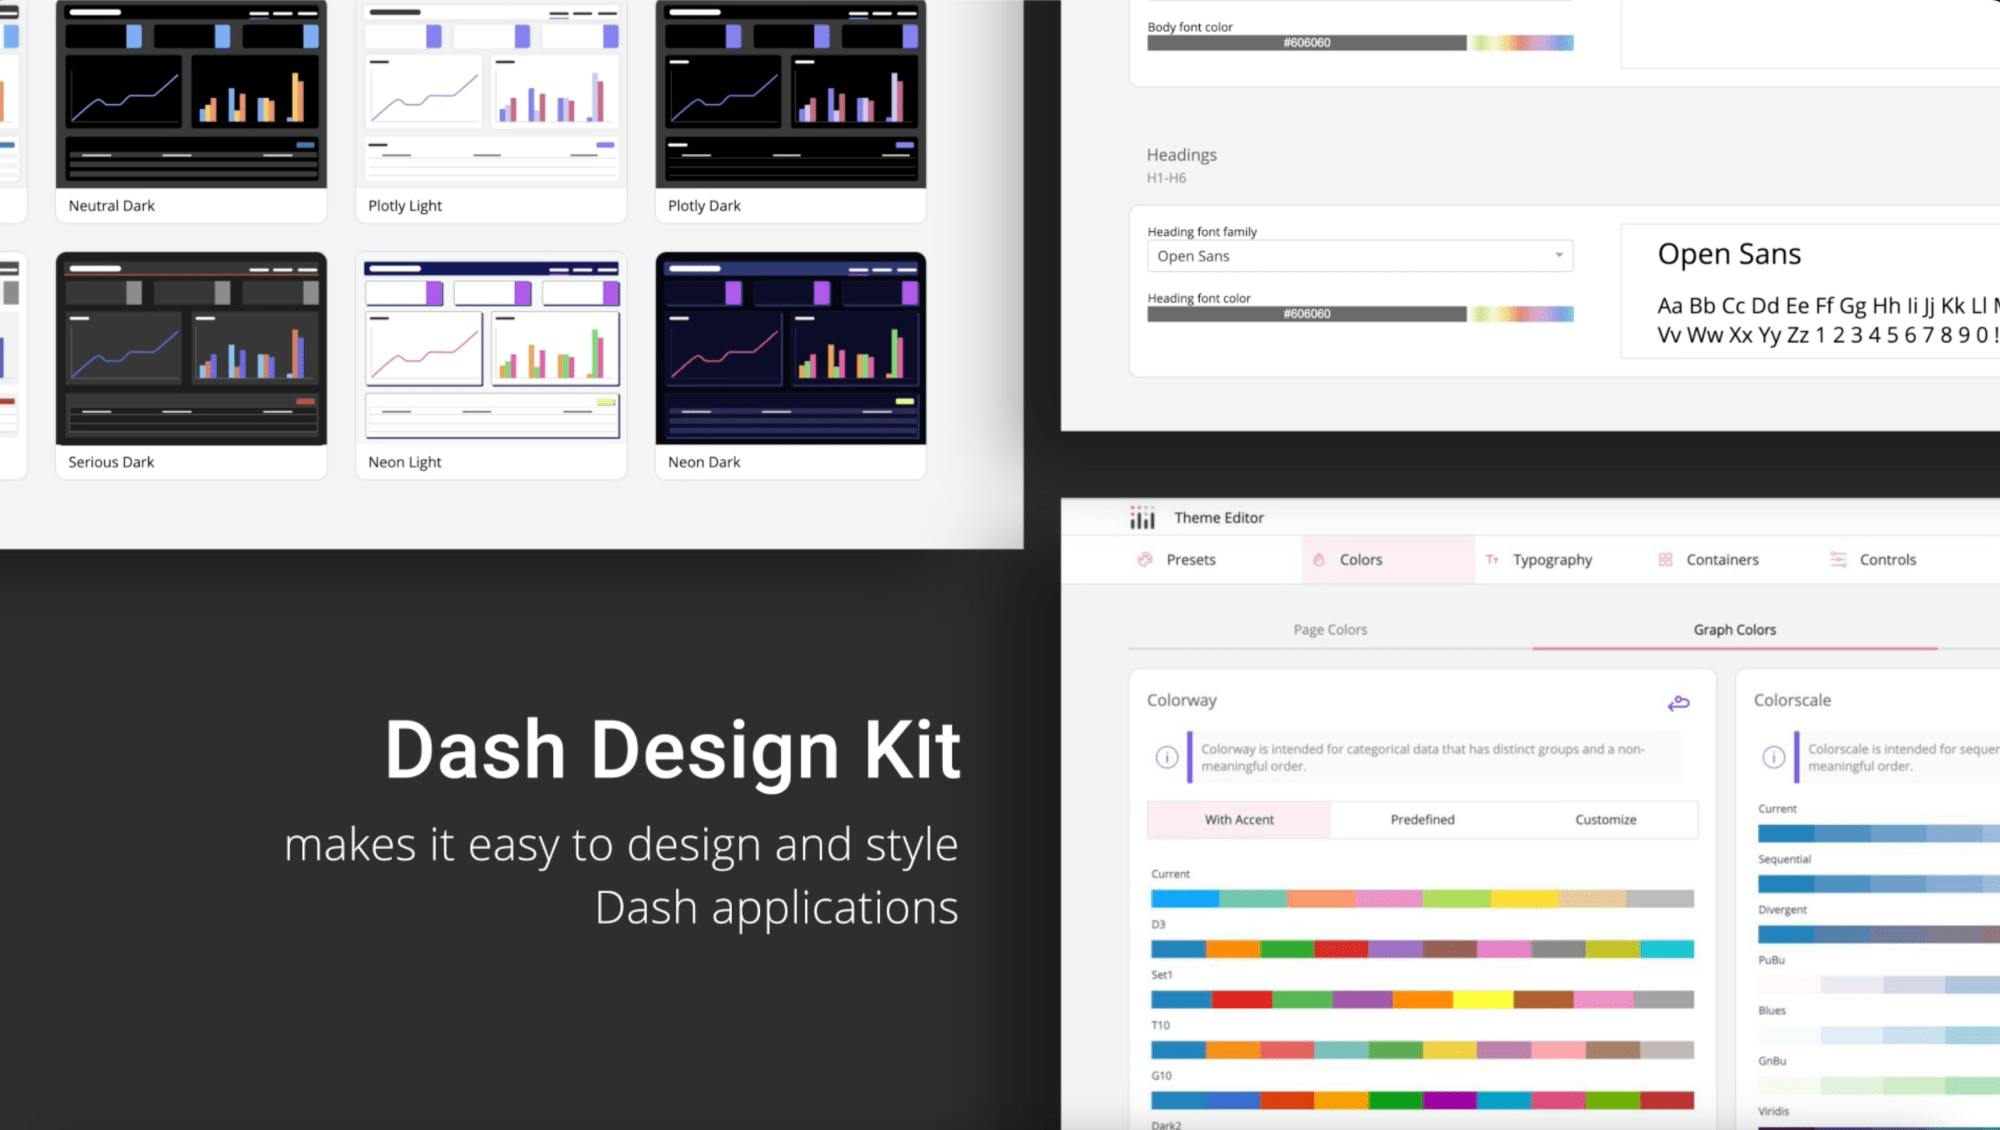
- Theme editor that switches light and dark themes and applies custom colors using a DAQ color picker
- Quick search and one click filters for tasks like finding Python developers or high earners above a salary threshold
- Financial grid that syncs row selection to a Plotly chart and uses in cell sparklines with periodic updates
- Inline editing of rows with dropdowns and text fields plus add a new task interactions
- Infinite scroll over ten thousand rows with quick search across the dataset
- Flashing update indicators for changing prices or alerts with auto update timing
- Embedded charts next to the grid including line, volume trend, and bar for daily change
- Task board that supports drag and drop across grids with a completion progress bar
- Detail view pattern that expands rows into rich cards for drilldowns
- Pivot table with drag and drop fields, filters, and rearrangeable rows and columns