
Adam Schroeder
February 12, 2025
A Tribute to the Plotly Community Champions
It amazes me every year that more than 25K people band together to form the most helpful Plotly Dash community on the internet. This number just keeps growing, as do the Dash apps, hangouts, and other contributions and events that happen within the Plotly community.
I’ve been part of this community for over five years now, starting out as a YouTuber making Plotly and Dash tutorials, and eventually becoming the community manager at Plotly. I’m incredibly lucky to witness this growth, and to meet those members of the community who go above and beyond.
We call such community members the Plotly Champions.
We’ve launched a new page to celebrate their contributions, and I’m excited to share it and the stories behind it with you. I hope this inspires more Plotly Community members to push the boundaries of what’s possible in data science and visualization with Plotly and Dash.
The Plotly Champions page, celebrating significant contributors within the Plotly community.
What makes someone a Plotly Champion?
Put simply, Plotly Champions are passionate contributors who’ve made a real, significant impact on our projects. They’ve been vocal and active forum participants, consistently supported their fellow community members, or even developed Dash components or maintained our open source libraries.
They share a common characteristic: Plotly Champions care about community first and foremost. They exchange knowledge and collaborate with others to ultimately help this passionate community grow and expand its reach. And that serves to enhance the positive impact of data science and analytics on our world.
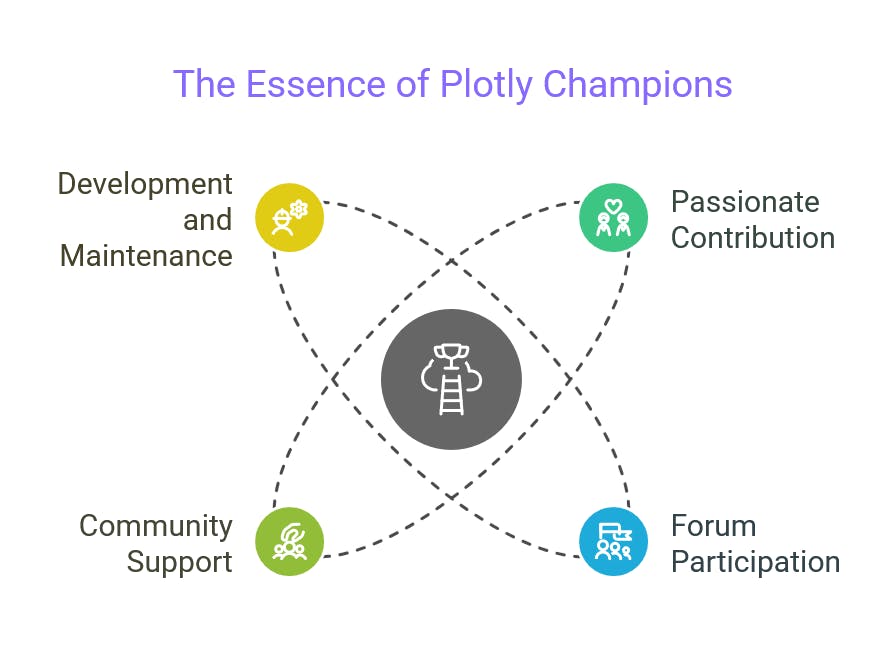
What makes someone a Plotly Champion?
How can someone become a Plotly Champion?
There’s no official way to become a Plotly Champion, but we do celebrate those Plotly community members who demonstrate significant contributions as Champions.
I’ve compiled a list of ways you can become a Plotly contributor — that’s a solid place to start. Anyone can become a contributor by commenting on GitHub issues, sharing your Dash data app examples, actively participating in the Plotly community forum, and writing technical articles or tutorials for the Plotly blog.
Celebrating the milestones achieved by our Plotly Champions
In alphabetical order, here are our current Plotly Champions and a summary of the milestones they have achieved over the course of being a community member.
Andrei Gherghescu
Andrei Gherghescu maintains the Plotly.rs Rust crate, a plotting library for Rust powered by Plotly.js that allows developers to create stunning data visualizations with ease and efficiency.
Andrei is a software engineer with a background in Control Systems Engineering, working in aerospace, robotics, and automotives. He currently works on positioning software for vehicles, in the Netherlands.
Ann Marie Ward
Ann Marie Ward is the lead maintainer of Dash Mantine Components library. She’s also an open-source advocate and contributor to the Dash ecosystem, co-authoring The Book of Dash, and contributing to the Dash code base and documentation.
Austin Kiesewetter
Austin Kiesewetter is the author of multiple open-source components for Plotly. He’s an active Plotly Community forum member as well.
Austin has a background as an entrepreneur and has helped launch four algorithmic trading-bot companies. He has also worked as an administrator of a large non-profit focused on mental health during covid. Currently, he works as a software developer at Martin Engineering.
Bryan Schroeder
Bryan Schroeder is the creator of Dash AG Grid, a high-performance and highly customizable component that wraps AG Grid, designed for creating rich datagrids. He is also an active commentator on the Plotly forum, and has contributed to projects such as Dashboard-Helper, in addition to Dash AG Grid.
Bryan is a software developer passionate about creating innovative solutions, with extensive experience in developing interactive dashboards and data visualization tools.
Carson Sievert
Carson Sievert is the maintainer of the Plotly R package and is author of plotly-r.com — his outstanding work on this package was recognized by the ASA with the 2017 Chambers Award.
Carson is a senior software engineer at Posit working on projects that bridge R & Python with the web, such as Shiny and Plotly. He has a PhD in statistics, and previously consulted with organizations such as NOAA, Sandia National Labs, and Plotly.
Kevin Schneider
Kevin Schneider is the creator and maintainer of Plotly.NET, a set of packages that provide functions for generating and rendering plotly.js charts in .NET programming languages.
Kevin is a researcher from Germany, a programmer, and a data scientist pursuing a PhD in Bioinformatics at RPTU Kaiserslautern. He develops methods for large-scale integrative data analysis and systems for biological research data management.
Roberto Moura
Roberto Moura is a maintainer of the Plotly Matlab repo, which allows users to create interactive, high-quality charts easily, improving data analysis and presentation in Matlab.
Roberto has experience in software engineering, and has worked for Google in London and Paris. He currently works as a quantitative researcher at a hedge fund.
Sébastien Didier
Sébastien Didier played an active role in enhancing the documentation for Dash AG Grid. He is also an expert at using Dash and Plotly to build interactive dashboards for monitoring AI model training.
Sébastien is an engineer based in Paris, with expertise in mechanical, industrial, and civil engineering in the nuclear and aeronautical industries. He is well-versed in Python, JavaScript, C, C++, C#, and VB.NET/VBA.
Tom Begley
Tom Begley is co-creator and lead maintainer of dash-bootstrap-components, the most popular third-party component library for Dash.
Tom is a software engineer, data scientist, and mathematician based in the UK. Currently, he is a technical lead at Cerberus Technology, and has previously worked as a machine learning engineer and as a data science researcher.
Why community is so important to data science
Data grows exponentially, and with it, data science is constantly evolving as well. Community serves as a common gathering point for data scientists and other professionals working with data.
Contributors like the Plotly Champions set an example for the rest of the community to strive towards.
Together, we achieve things with an impact beyond our screens — we can impact real-world use cases like medical research and infrastructure planning (just check out some of these Plotly customer stories for examples).
So with this post, I’d like to thank the Plotly Champions for all that they’ve done to prop up this community. And for those of you who are curious about contributing or participating in this movement, head over to the Plotly community forum to get started.