
Chris Parmer
November 13, 2026
scanpy tutorial: Harmony, marker genes and UMAP, hands-on in Dash
TL;DR
- scanpy is the Python toolkit for analyzing single-cell gene expression data, the measurements of which genes are switched on in each individual cell. Alex Wolf, Philipp Angerer and Fabian Theis's lab started it in 2017, and the scverse community maintains it today, with Philipp Angerer as lead developer.
- Version 1.13 came out on November 13, 2026. Its headline features are Harmony batch integration built into scanpy, a new Wilcoxon method that finds marker genes about 27 times faster, and UMAP that runs in parallel.
- There are three breaking changes, and many old parameters are deprecated ahead of scanpy 2.0, which you can preview with one setting.
- With scanpy and Dash you can build apps like a cell atlas browser for a target discovery team, a clinical trial app that tracks immune cells before and after treatment, or a quality control monitor for a sequencing lab.
What is scanpy?
Every cell in your body carries the same DNA, but each one switches on a different set of genes, and that's what makes a T cell different from a neuron. Single-cell RNA sequencing (scRNA-seq) counts the RNA molecules from each gene in thousands or millions of individual cells, so you get a big table with one row per cell and one column per gene. Drug companies use it to find which cells a disease changes, to check where a drug target is active, and to see how immune cells respond in clinical trial samples.
scanpy turns that table into answers. It's a Python package for every step from raw counts to figures, and it's built on AnnData, a file format and Python object that holds the counts together with everything you learn about each cell and gene. Its README says it "efficiently deals with datasets of more than one million cells". Here are three things you'd do with it, shown on a real public dataset of 239,696 blood cells from five COVID-19 studies. First, a look at that data.
The data: 239,696 blood cells from five COVID-19 studies
Where it comes from. CZ CELLxGENE Discover, run by the Chan Zuckerberg Initiative, is a free library of published single-cell datasets, all stored in the same format. We used its COVID-19 Immune Atlas, which a team put together for a 2021 iScience paper from five studies published in 2020 (in Nature Medicine, Science Immunology, Science, Cell and Nature Communications). Each lab took blood from healthy donors and COVID-19 patients, separated out the white blood cells (PBMCs) and sequenced them one cell at a time. Together that's 97 samples from 78 donors: 103,804 cells from healthy donors, 71,443 from severe COVID-19 and 64,449 from mild cases or recovery.
What format it's in. It's one 1.8 GB .h5ad file, which is an AnnData object saved to disk. Inside are four main parts:
- X, the expression values the atlas authors processed, and raw.X, the original counts of RNA molecules per gene per cell
- obs, a table with one row per cell: study, donor, disease, cell type, genes detected and more
- var, a table with one row per gene, with Ensembl IDs (like ENSG00000118271) and gene names (like LYZ)
- obsm, the authors' own PCA, t-SNE and UMAP coordinates
How to load it. Download the file and open it with anndata, which comes with scanpy. backed="r" leaves the big matrices on disk until you ask for them, so opening the file doesn't fill your memory:
# curl -O https://datasets.cellxgene.cziscience.com/904c928e-b671-41b2-9354-7256e7dd68fa.h5adimport anndata as adadata = ad.read_h5ad("904c928e-b671-41b2-9354-7256e7dd68fa.h5ad", backed="r")print(adata)
AnnData object with n_obs × n_vars = 239696 × 23337 backed at '904c928e-...h5ad'obs: 'Dataset', 'sample', 'disease_original', 'disease_general', 'COVID-19 Condition','Lineage', 'Cell.group', 'Cell.class', 'n_genes', 'n_counts', 'percent_mito', ...var: 'n_cells', 'feature_is_filtered', 'feature_name', 'feature_reference', ...uns: 'citation', 'data sources', 'organism', 'title', ...obsm: 'X_pca', 'X_tsne', 'X_umap'
Loading everything into memory needs a bigger machine: X and raw.X each hold 371,860,127 nonzero values. On our 16 GB machine we read only the raw counts and the two tables (see "Running scanpy on Plotly Cloud and Dash Enterprise" below).
What it looks like. Here are six cells from obs, one per cell type:
Study
Donor
Disease
Cell type
Technology
Genes detected
Arunachalam (Science)
cov10
COVID-19 severe
Platelet
10x 3' v3
419
Arunachalam (Science)
cov11
COVID-19 severe
NK cell
10x 3' v3
1,926
Guo (Nature Communications)
P1
COVID-19 severe
B cell
10x 3' v2
604
Lee (Science Immunology)
Normal 4
Healthy
CD14+ monocyte
10x 3' v3
2,916
Schulte-Schrepping (Cell)
C19-CB-0021
COVID-19 severe
Neutrophil
10x 3' v3
992
Schulte-Schrepping (Cell)
one_Ten
Healthy
CD4+ T cell
10x 3' v3
2,239
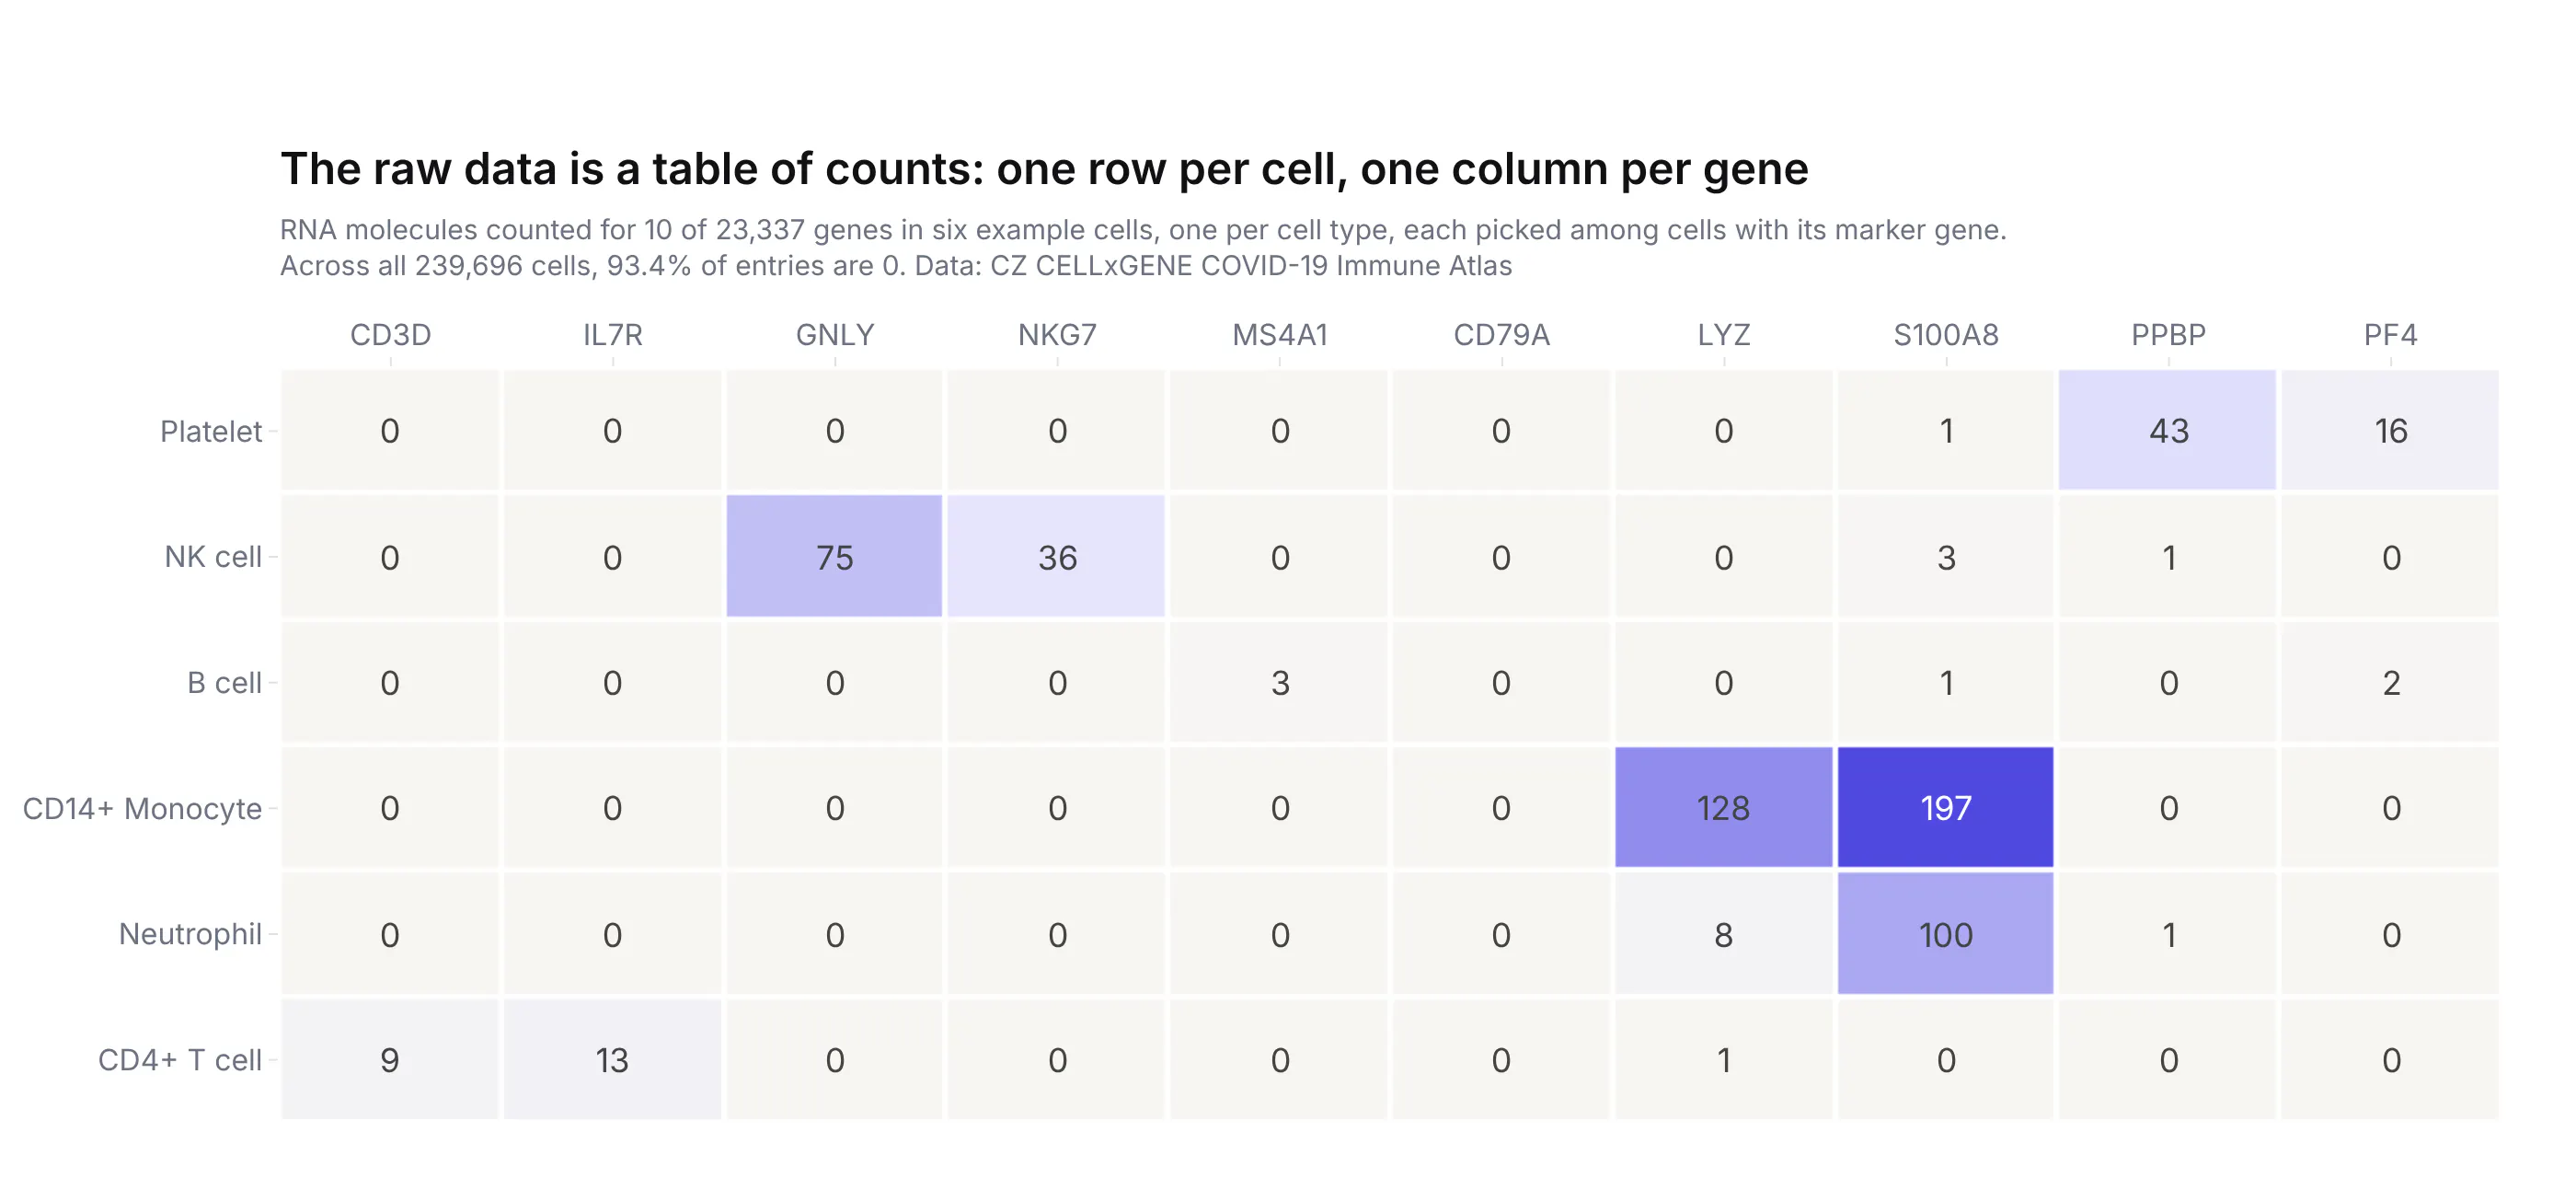
And here are their raw counts for 10 of the 23,337 genes. Most entries are zero (93.4% across the whole file), and each cell type lights up a different set of genes, which is what the rest of the analysis builds on.
Three things you can do with scanpy
Check the quality of every cell
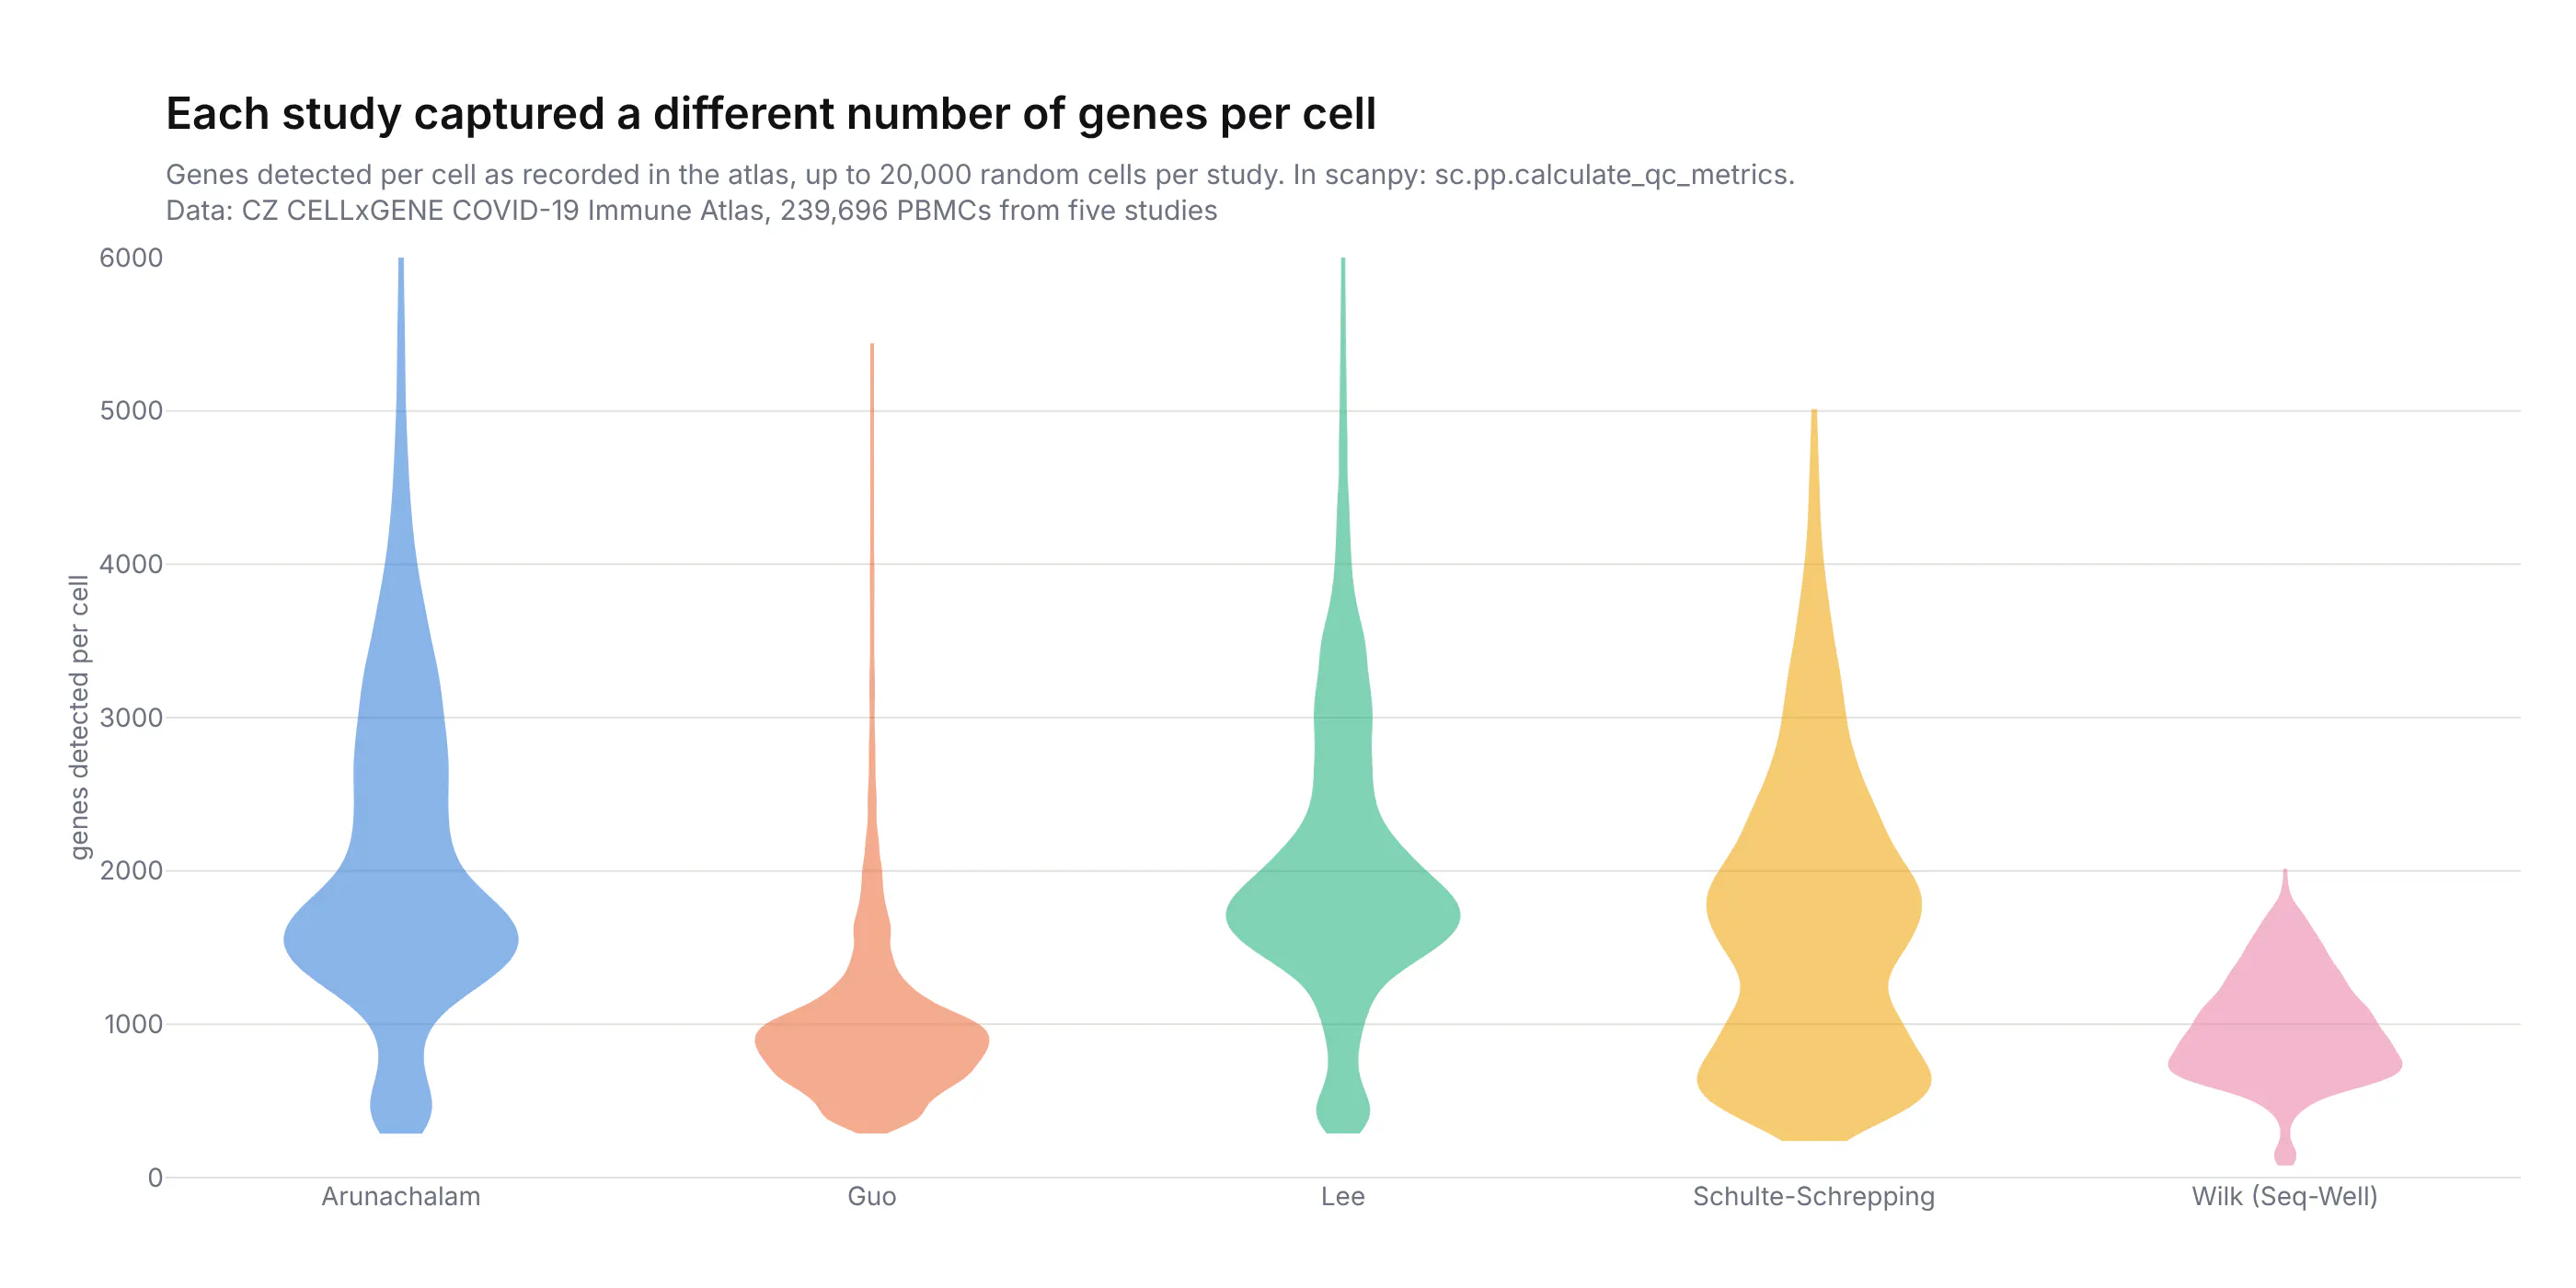
Before any analysis, scanpy counts how many genes each cell shows and flags cells that look empty or damaged, so you can filter them out.
import scanpy as scqc = sc.pp.calculate_qc_metrics(adata, percent_top=None, log1p=False) # per-cell and per-gene tablessc.pp.filter_cells(adata, min_genes=200)
How to read this chart:
- Each violin is one study, and it's wider where more of that study's cells detected that many genes.
- The box marks the middle half of the cells and the line inside it the median, so the Guo and Wilk studies (medians of 889 and 938 genes) caught fewer genes per cell than the other three (1,604 to 1,849).
Draw a map of all your cells
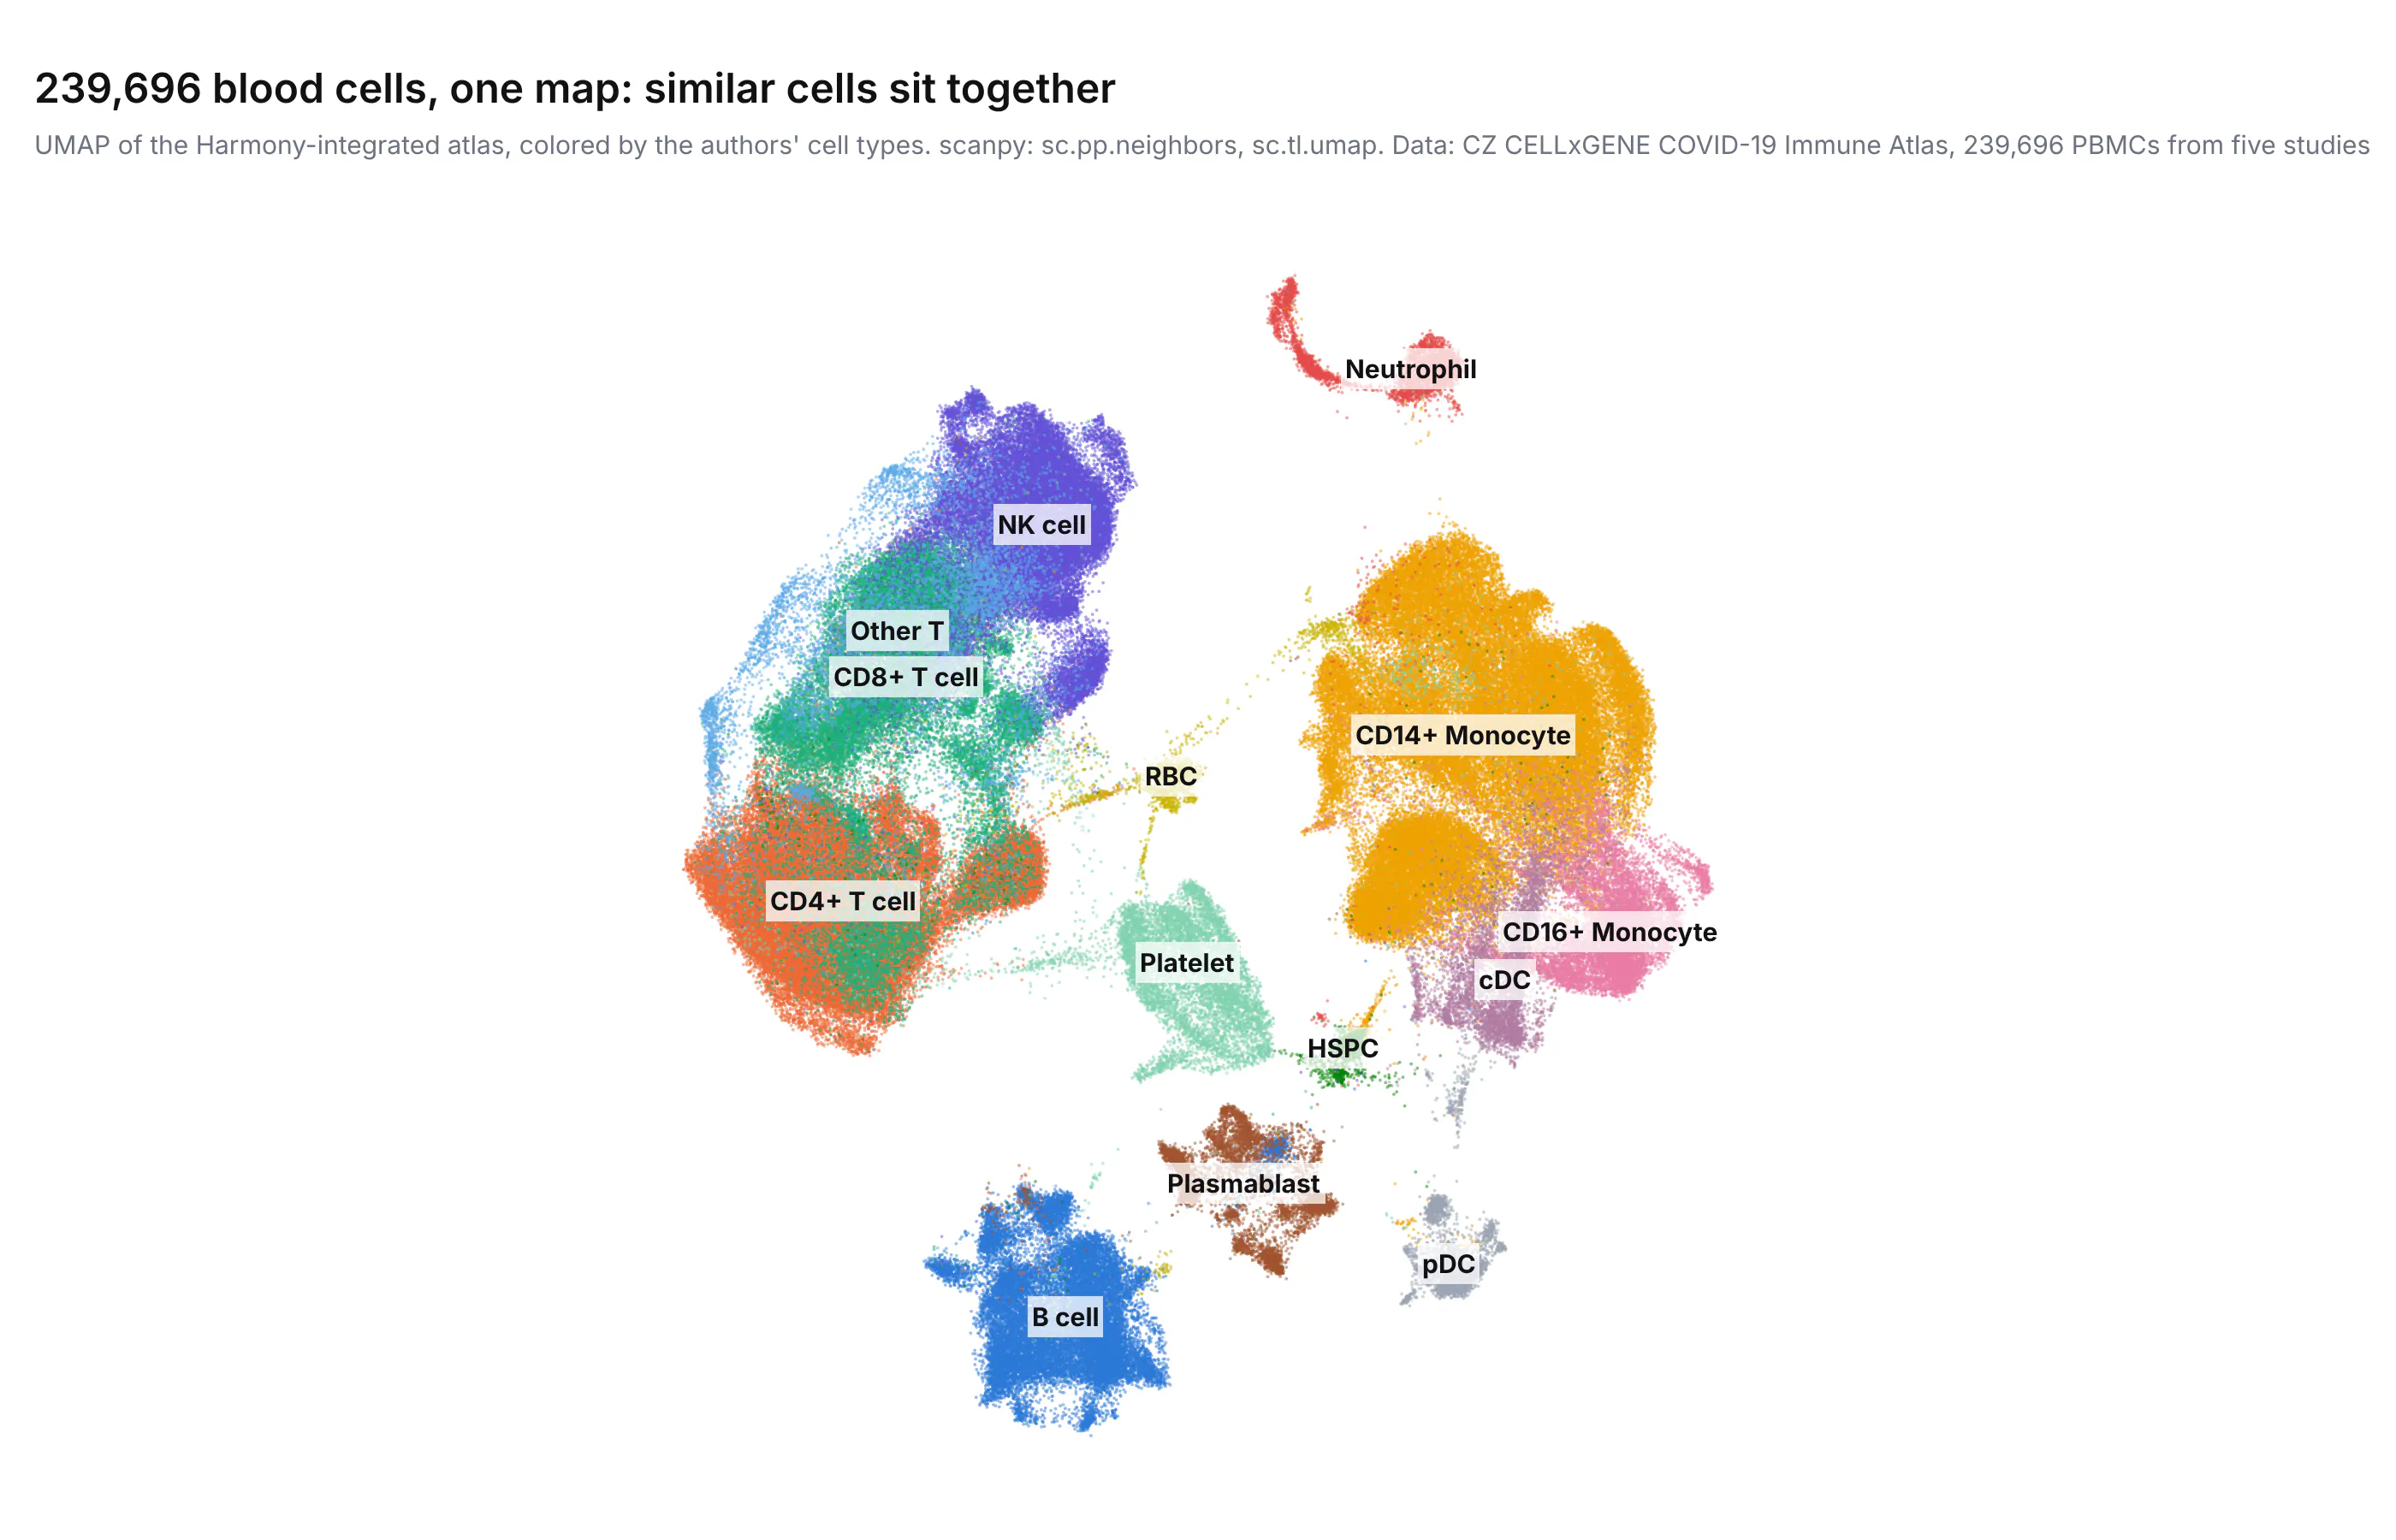
scanpy compresses thousands of genes into a 2D map (a UMAP) where cells with similar gene activity sit close together, and groups them into clusters, so cell types show up as islands.
sc.pp.normalize_total(adata, target_sum=1e4)sc.pp.log1p(adata)sc.pp.highly_variable_genes(adata, n_top_genes=2000)sc.pp.pca(adata)sc.pp.neighbors(adata)sc.tl.umap(adata)sc.tl.leiden(adata, flavor="igraph", n_iterations=2) # clusters
How to read this chart:
- Each dot is one cell, and cells with similar gene activity sit close together, so each island is a group of similar cells.
- Colors and labels are the cell types the study authors assigned. The axes have no units, and only the closeness of cells means something, not the exact distance between islands.
Find the genes that define each cell type
scanpy compares each group of cells with all the others and ranks the genes that set it apart, which is how you name a cluster or check where a gene is active.
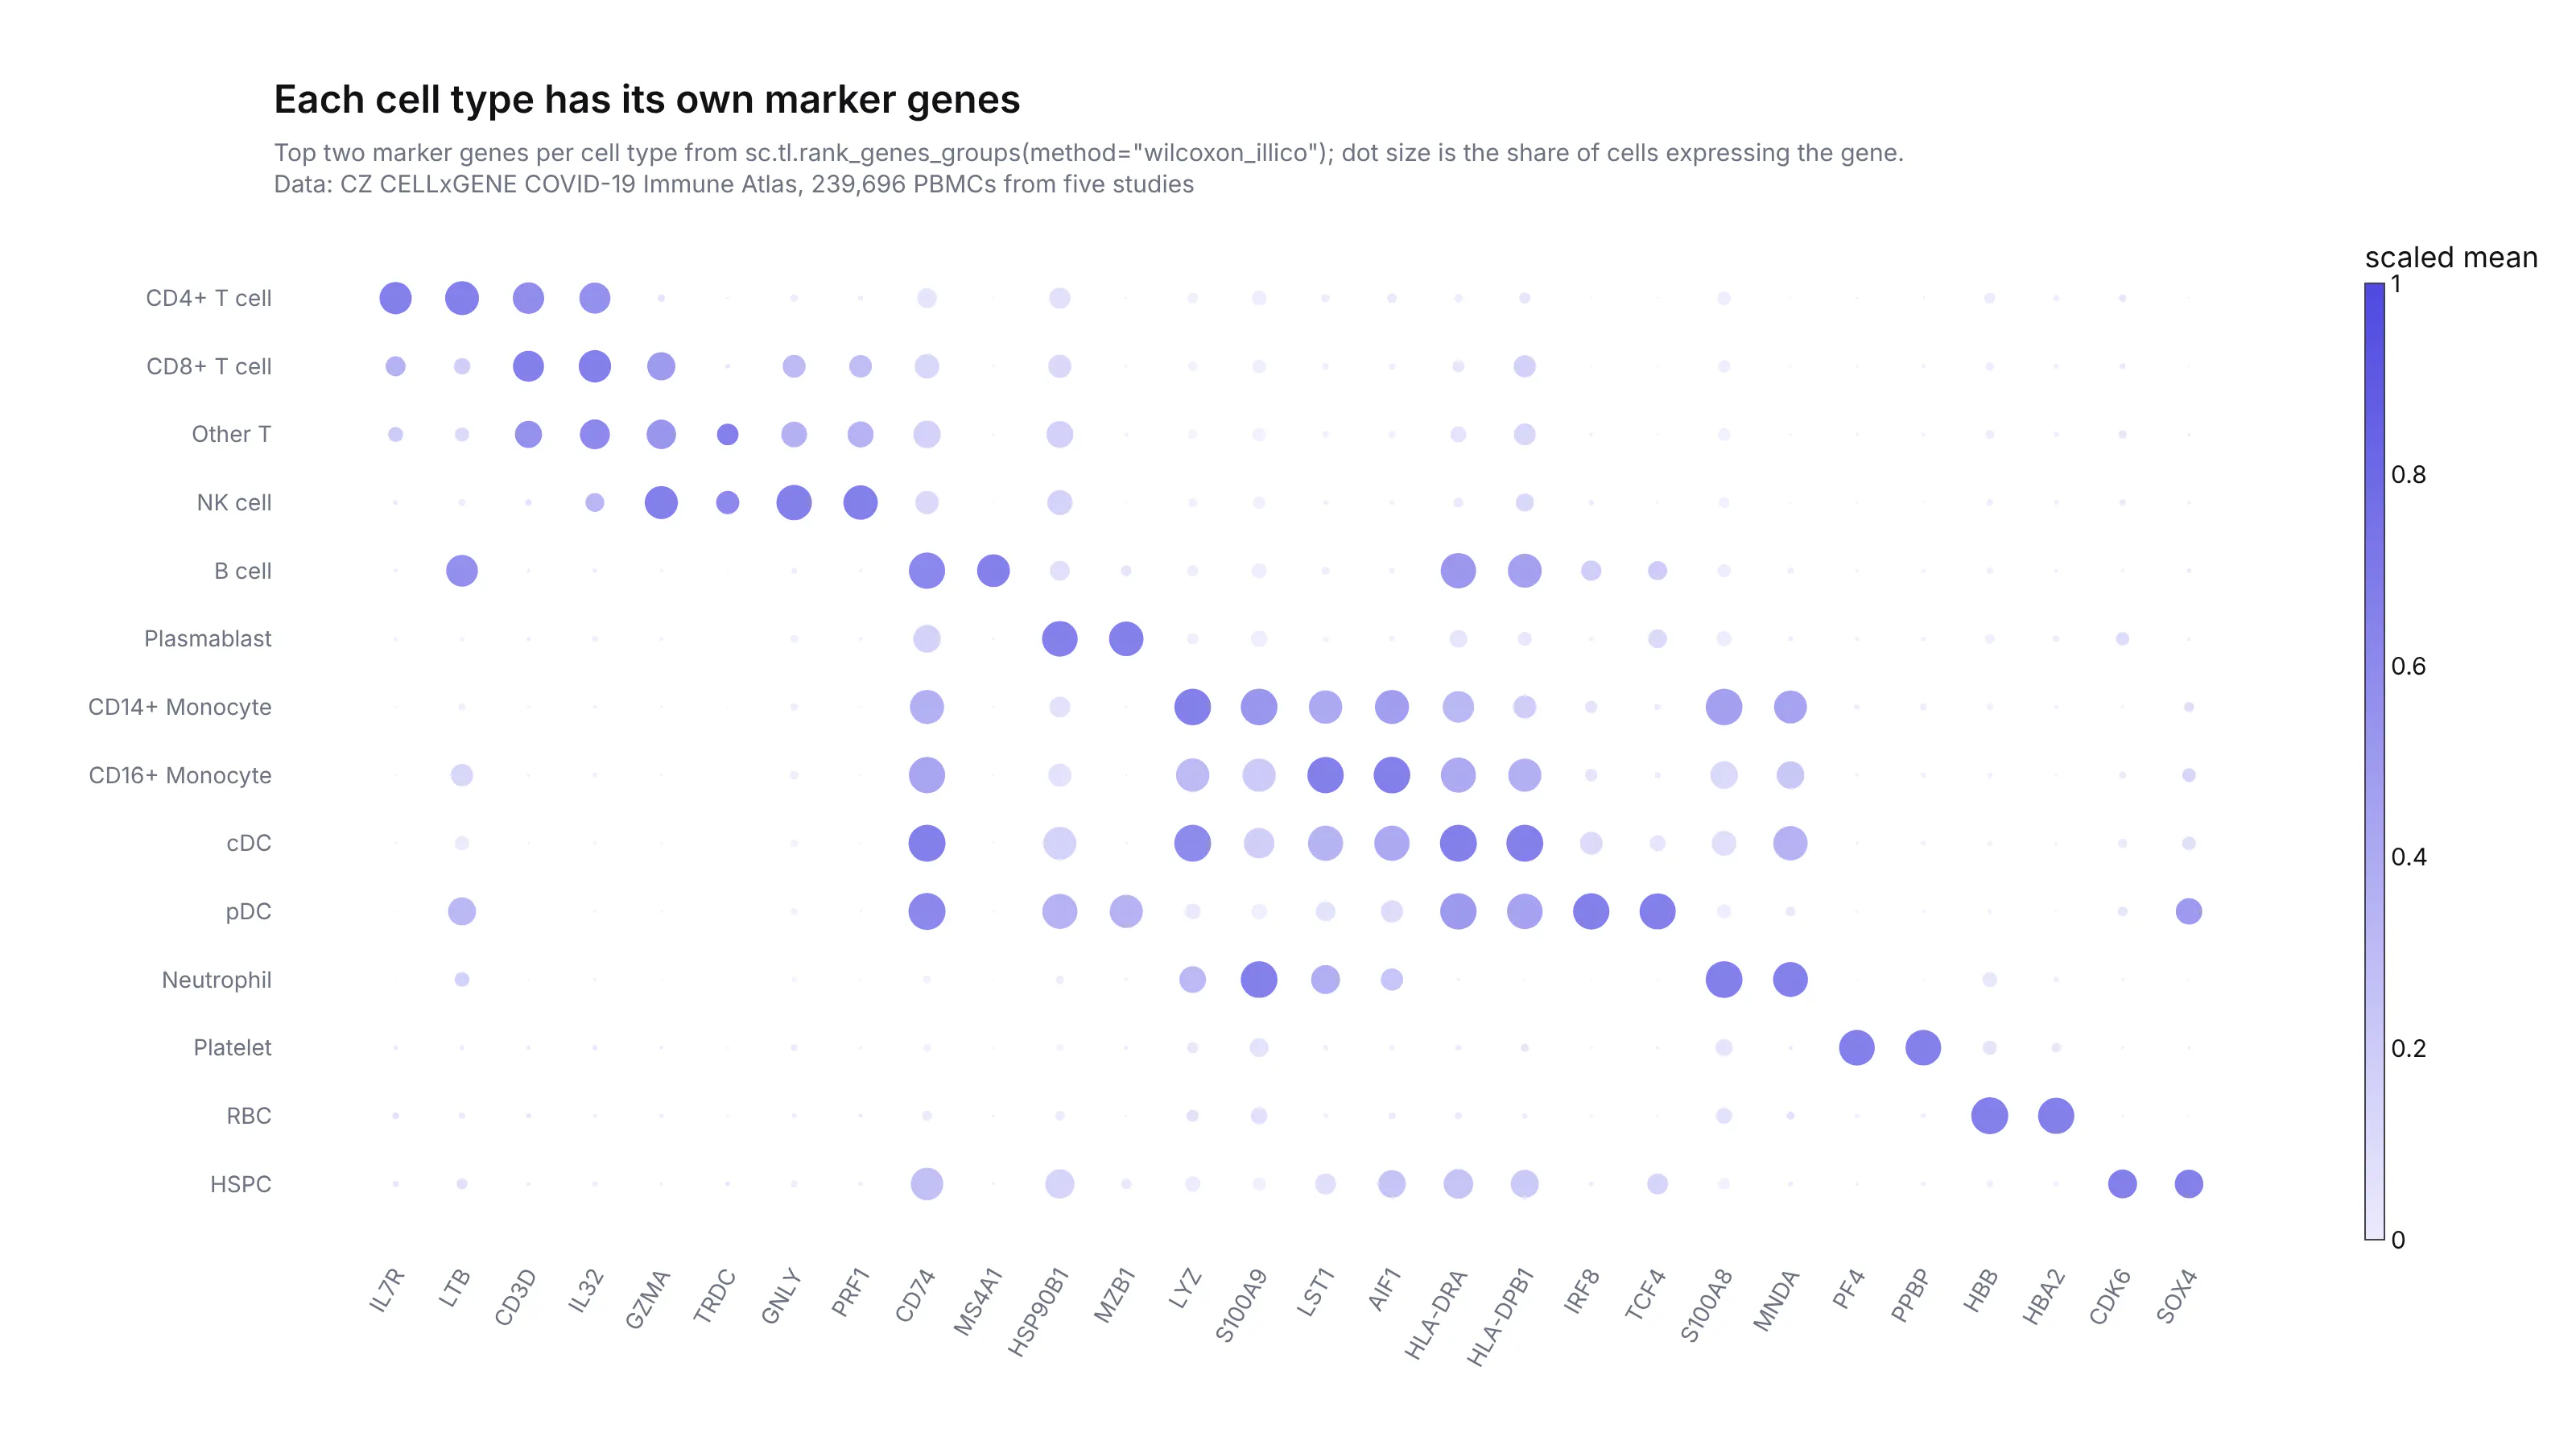
sc.tl.rank_genes_groups(adata, "cell_type", method="wilcoxon_illico")sc.get.rank_genes_groups_df(adata, group="B cell").head()
How to read this chart:
- Each row is a cell type and each column a gene, ordered so each cell type's two marker genes sit next to each other along the diagonal.
- A bigger dot means more cells of that type have the gene, and a darker dot means more of it per cell, compared with that gene's highest value.
- Read across a row to see what sets a cell type apart, or down a column to see where a gene is active.
LYZ is active in 98.9% of CD14+ monocytes and MS4A1 in 88.4% of B cells, which is why biologists use them to recognize those cells.
scanpy also does trajectory analysis (following cells as they change from one state to another), cell cycle scoring, doublet detection and spatial plotting, and it's the hub of the scverse ecosystem, alongside packages like scvi-tools for deep-learning models and squidpy for spatial data.
What's new in scanpy 1.13
Version 1.13 is a big release, with 249 commits since 1.12.5. These are its headline features:
- Harmony is built in. Harmony removes the technical differences between batches of samples (from different labs, days or machines) so you can analyze them together. It used to need a separate package through sc.external, and now it's sc.pp.harmony_integrate.
- Marker genes with wilcoxon_illico. A new method for sc.tl.rank_genes_groups, built on the illico library, gives the same results as the classic Wilcoxon test in a fraction of the time.
- Parallel UMAP. Pass rng=None to sc.tl.umap and it uses all your CPU cores.
- A preview of scanpy 2.0. scanpy.settings.preset = "scanpy-v2-preview" switches on the defaults planned for 2.0, and a new use and out style says exactly where each function reads and writes its data.
pip install -U scanpy
The demo app: Atlas Lab
We built a Dash app called Atlas Lab that uses these features on the COVID-19 Immune Atlas from CZ CELLxGENE, which combines 239,696 peripheral blood mononuclear cells (PBMCs, the white blood cells in a blood sample) from 78 donors in five published studies. We deployed it to Plotly Cloud. Here's what it does.
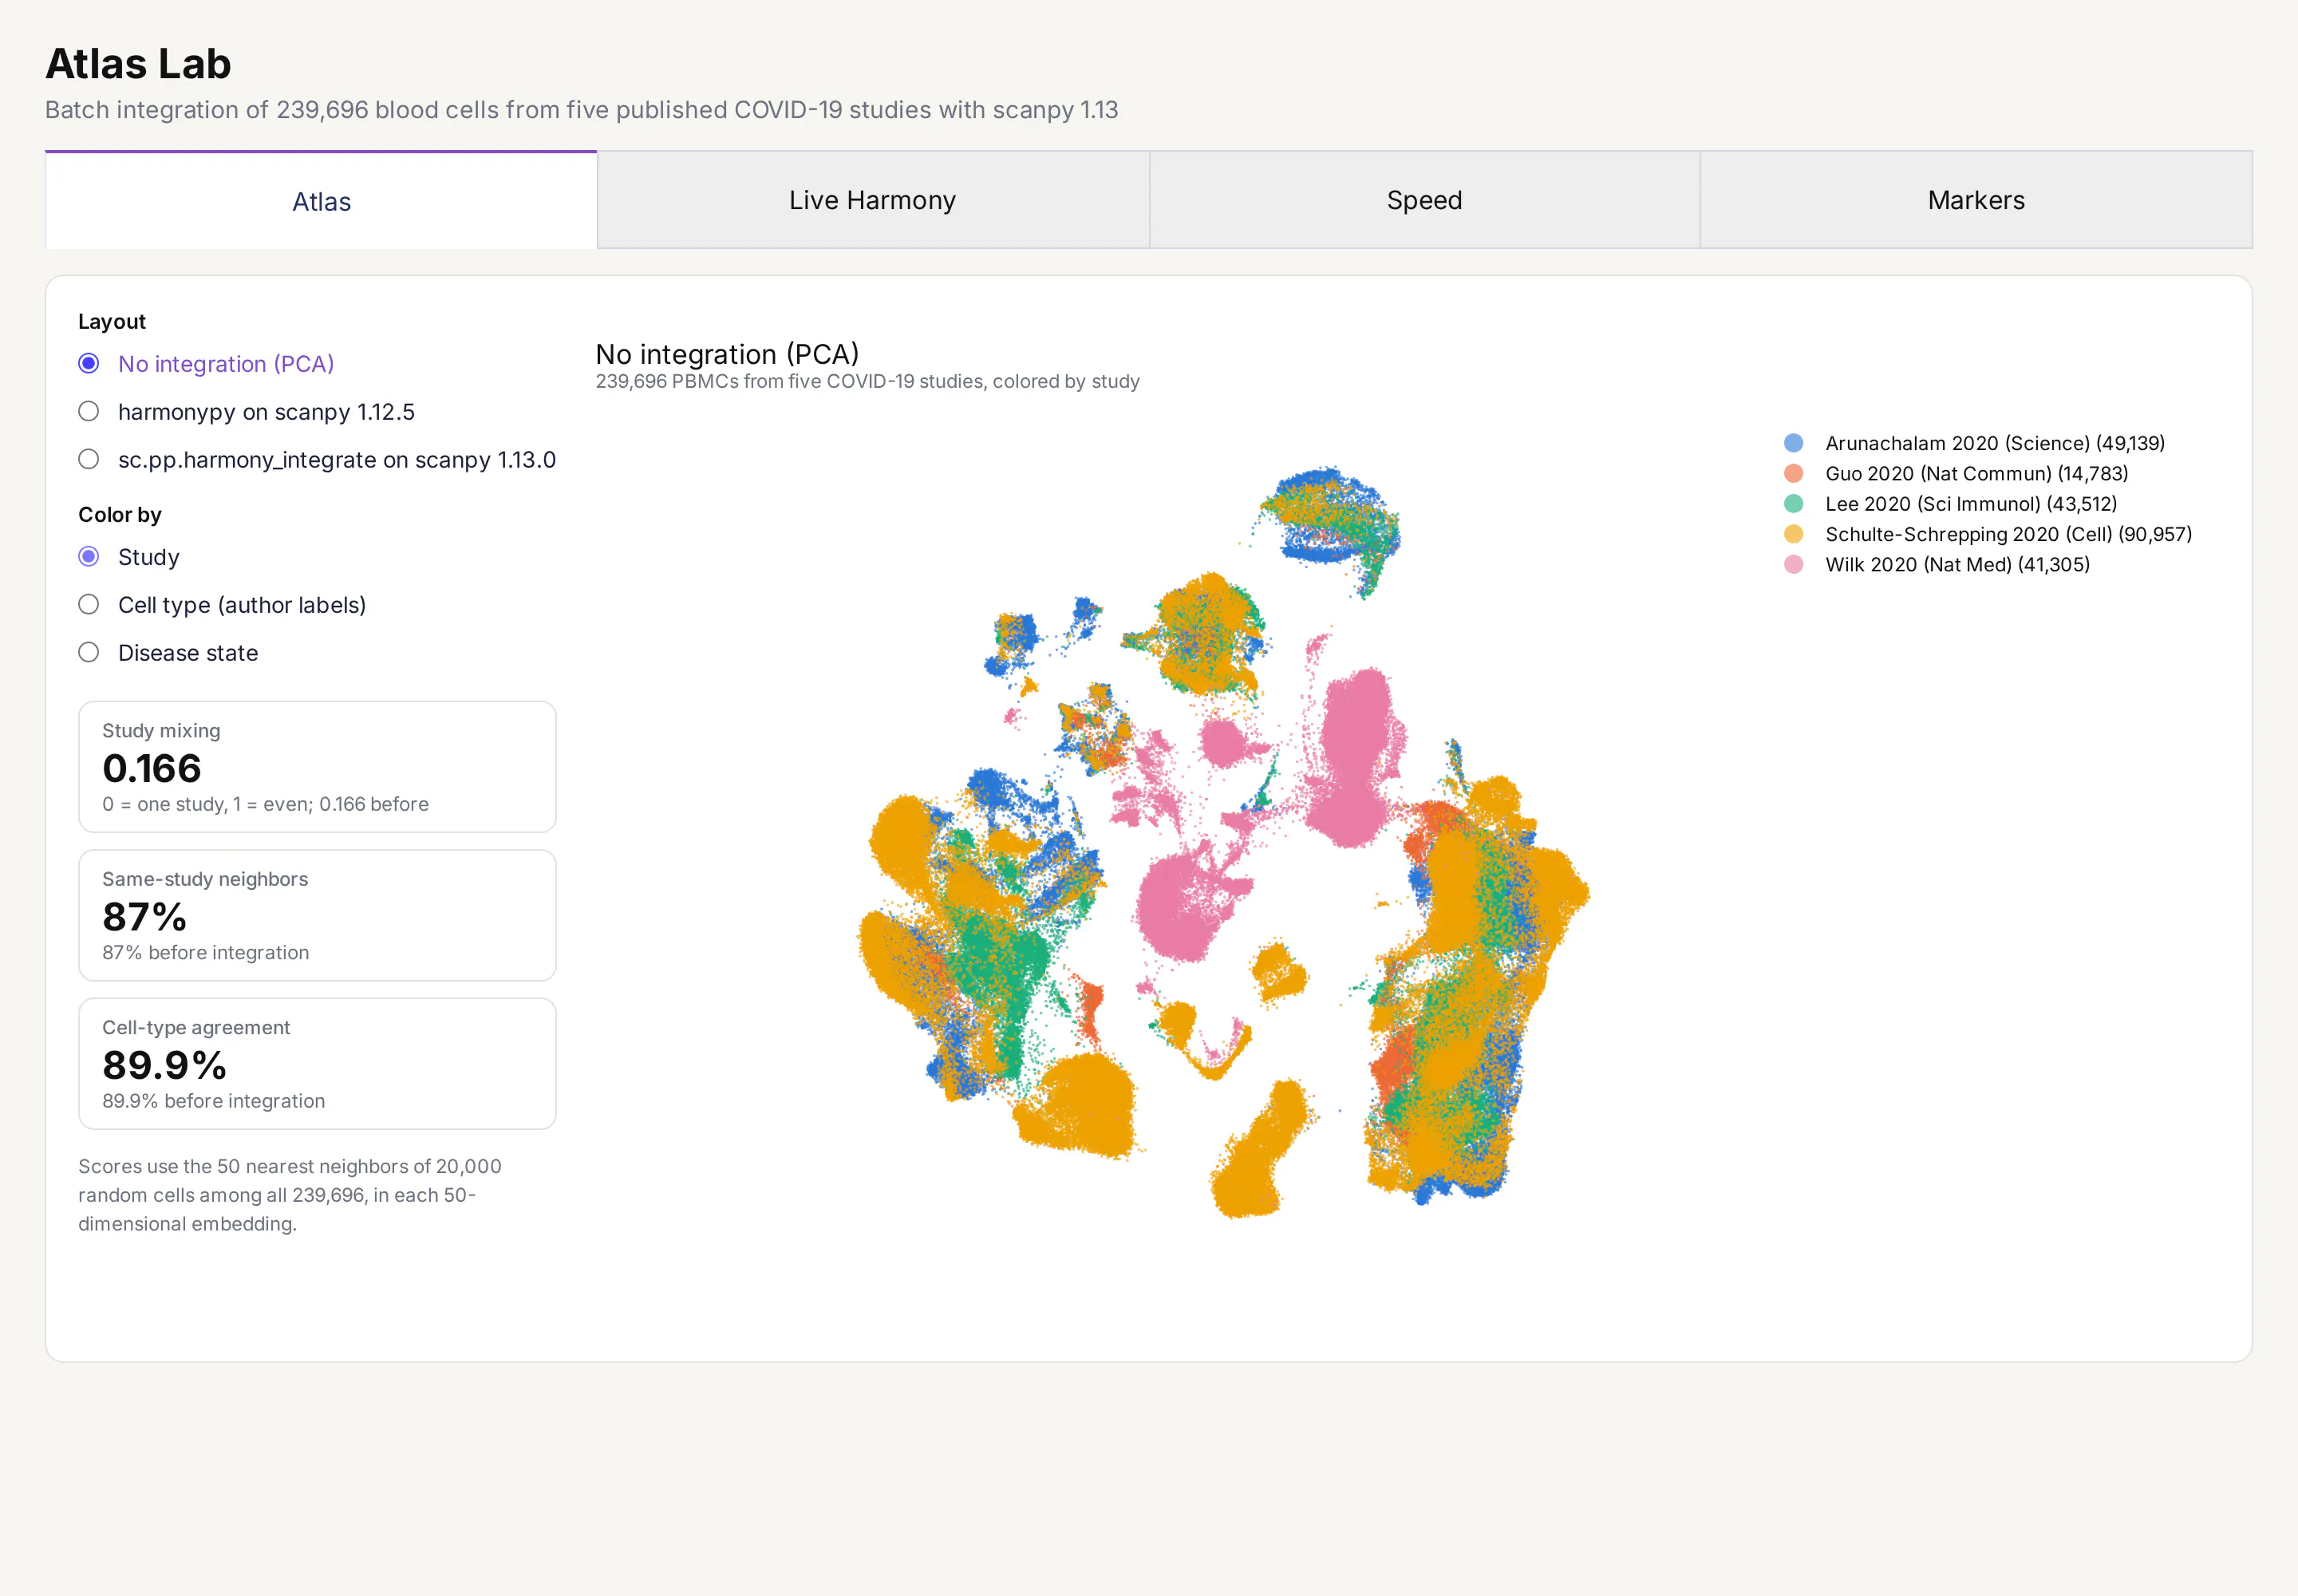
Before integration, each study forms its own islands on the map, even for the same cell type, because each lab's equipment and chemistry leave a fingerprint on the data. The cards on the left score how mixed the studies are.
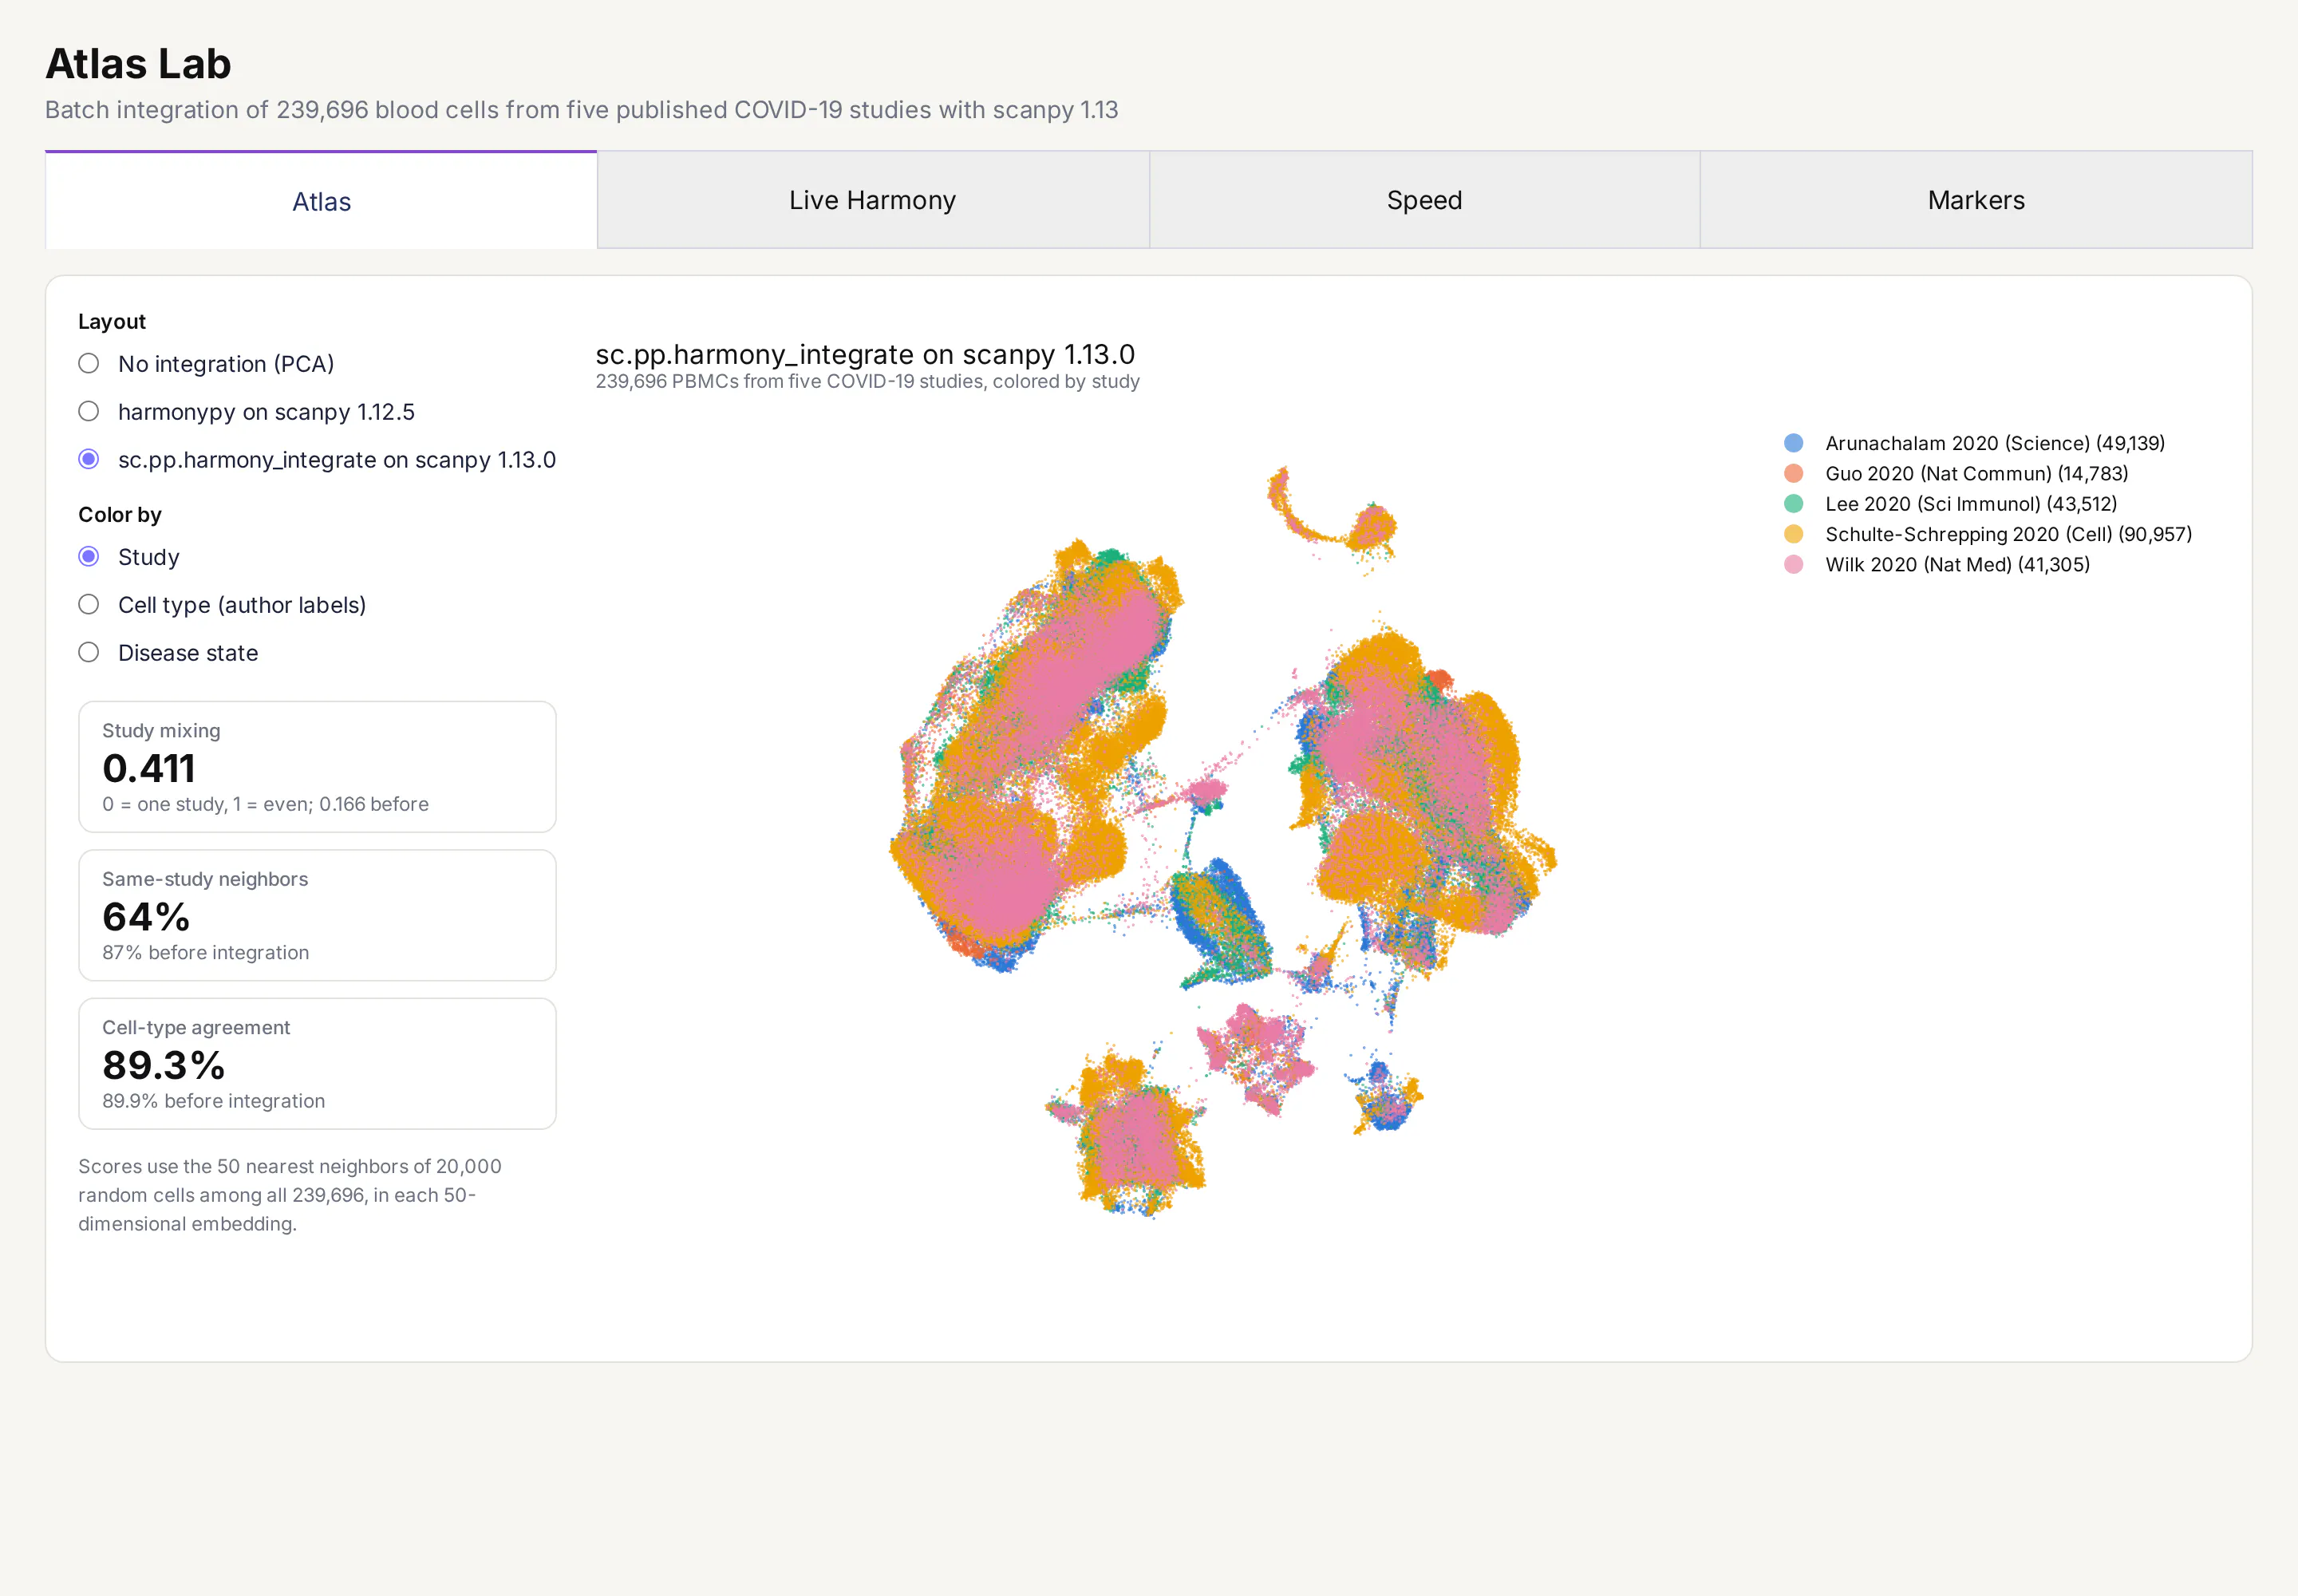
After sc.pp.harmony_integrate, the studies overlap. The share of each cell's neighbors that come from its own study dropped from 87% to 64%, while the share with the same cell type barely moved (89.9% to 89.3%).
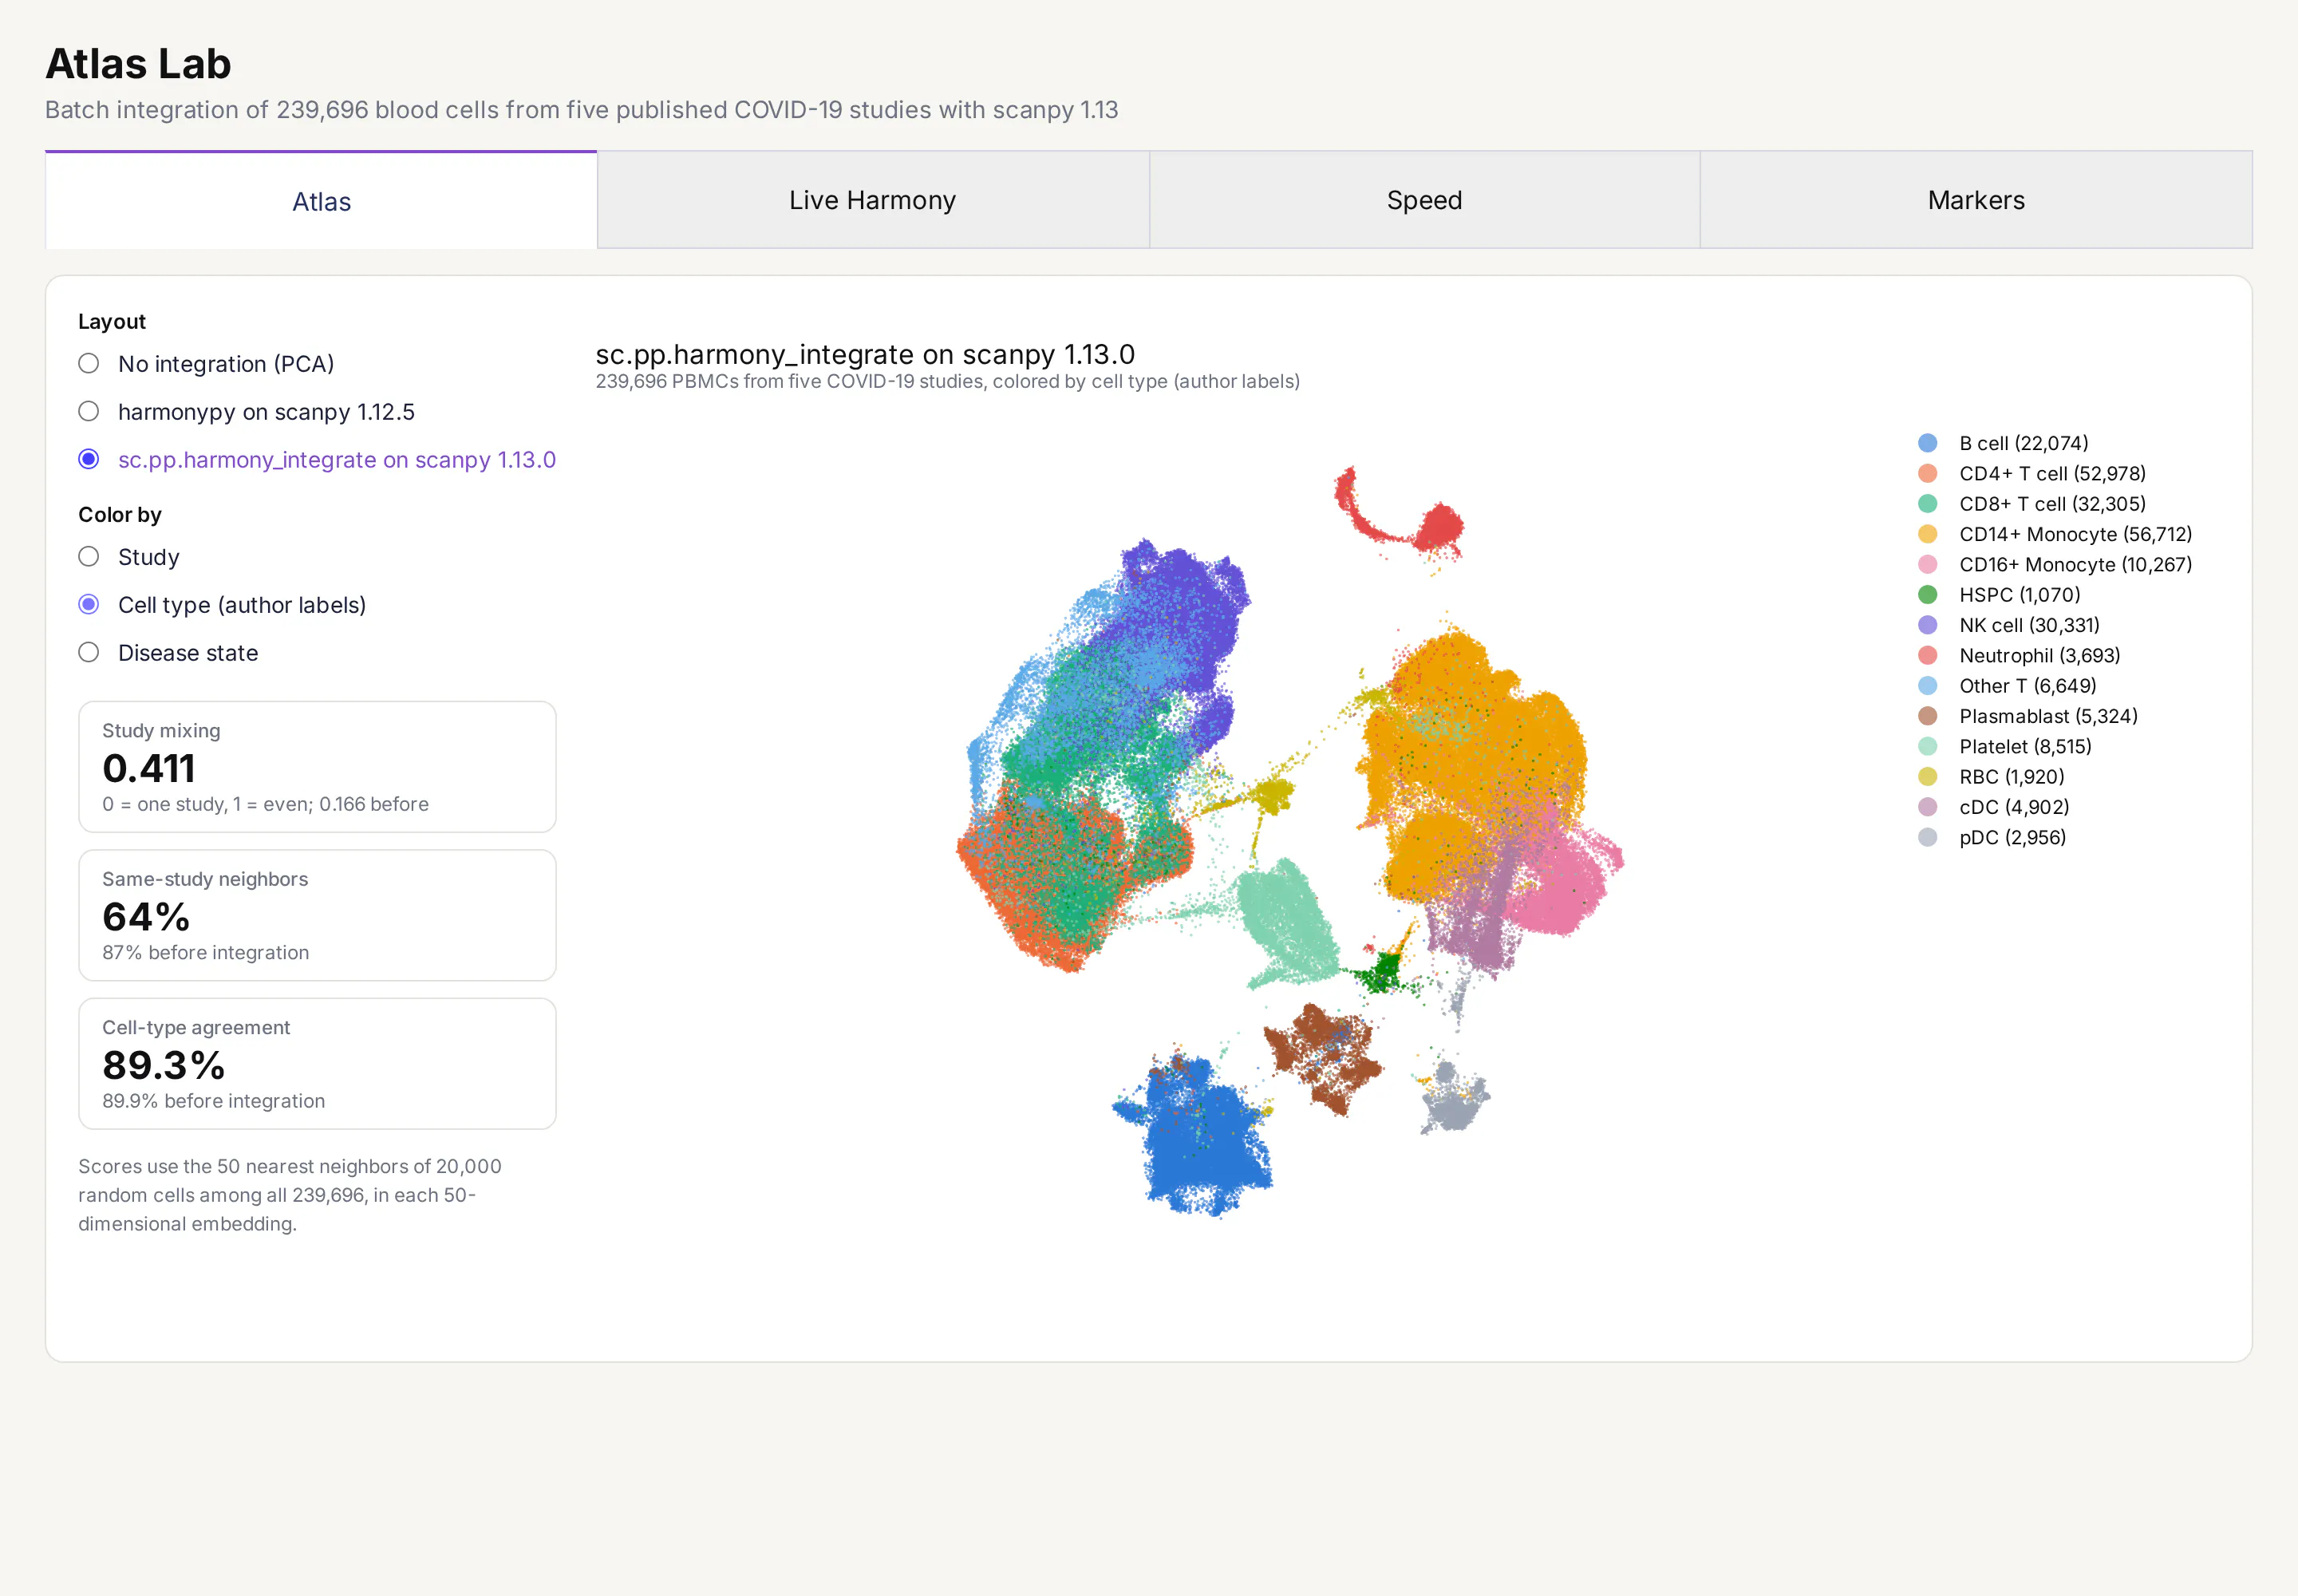
Colored by cell type, the same map shows that integration kept T cells, monocytes, B cells and the rarer types in their own groups.
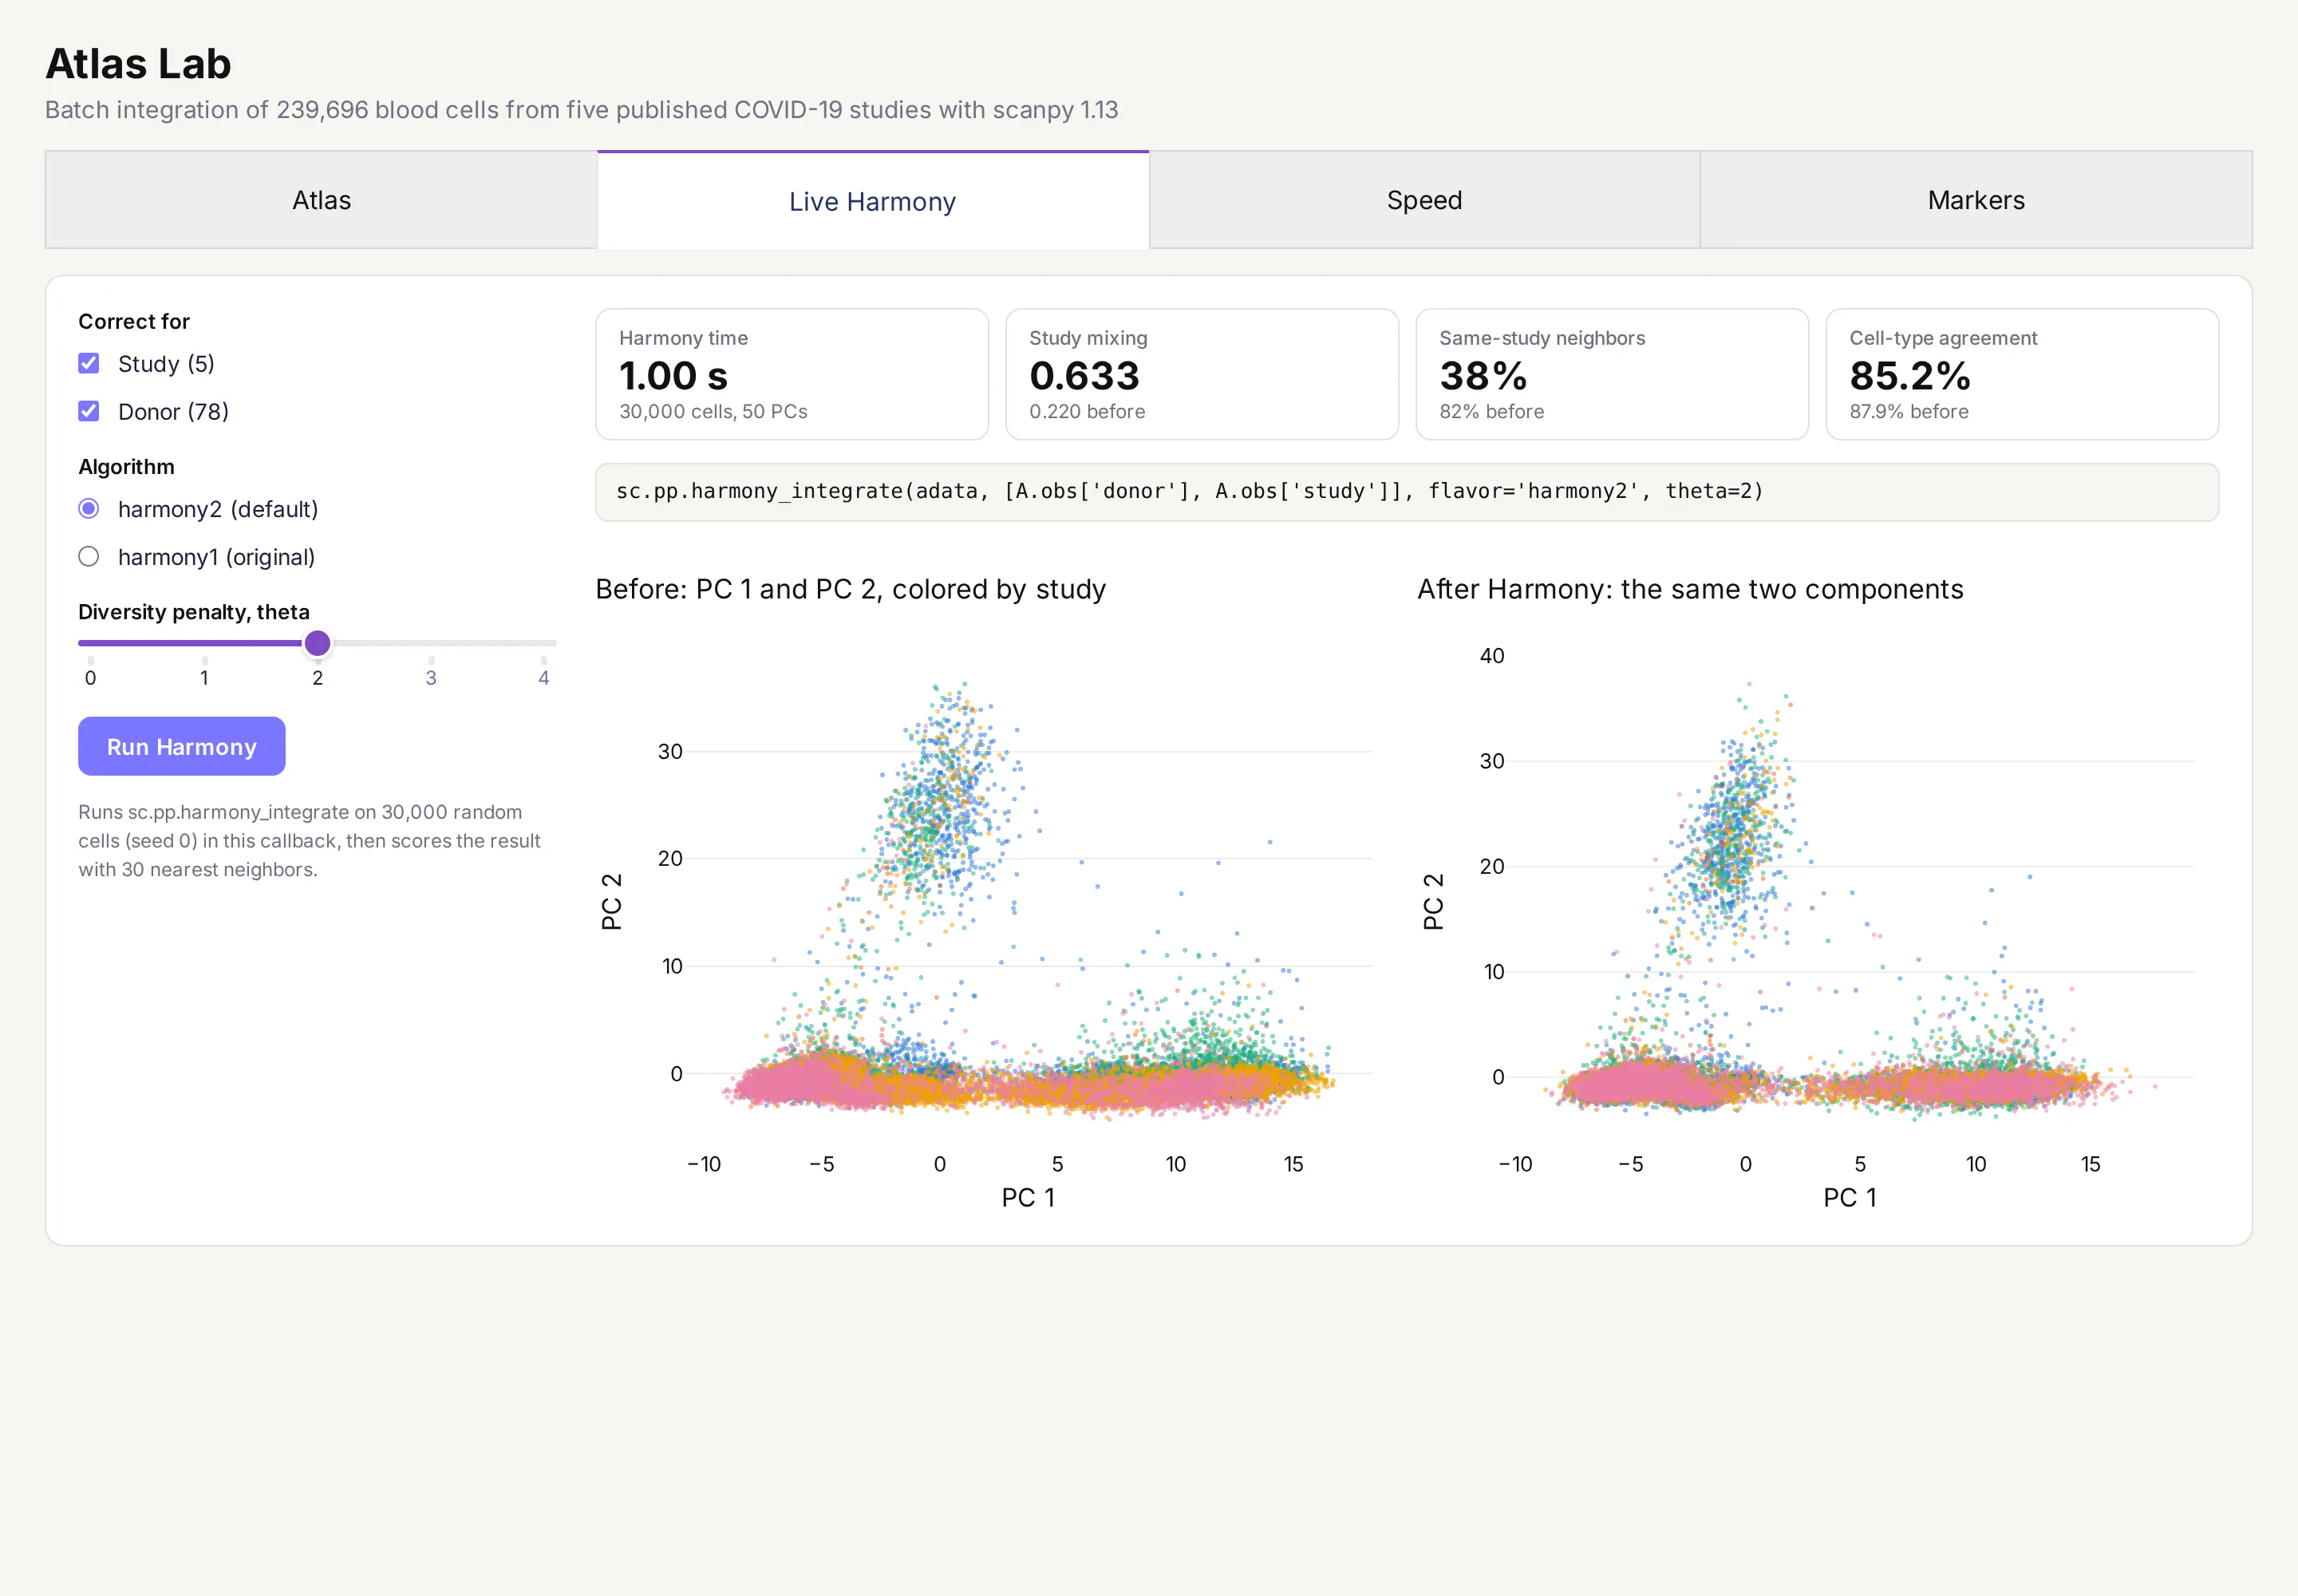
The Live Harmony tab runs sc.pp.harmony_integrate inside a Dash callback on 30,000 cells, with the batch variables and settings you pick, and scores the result. Correcting for study and donor together took 1.00 s on our machine.
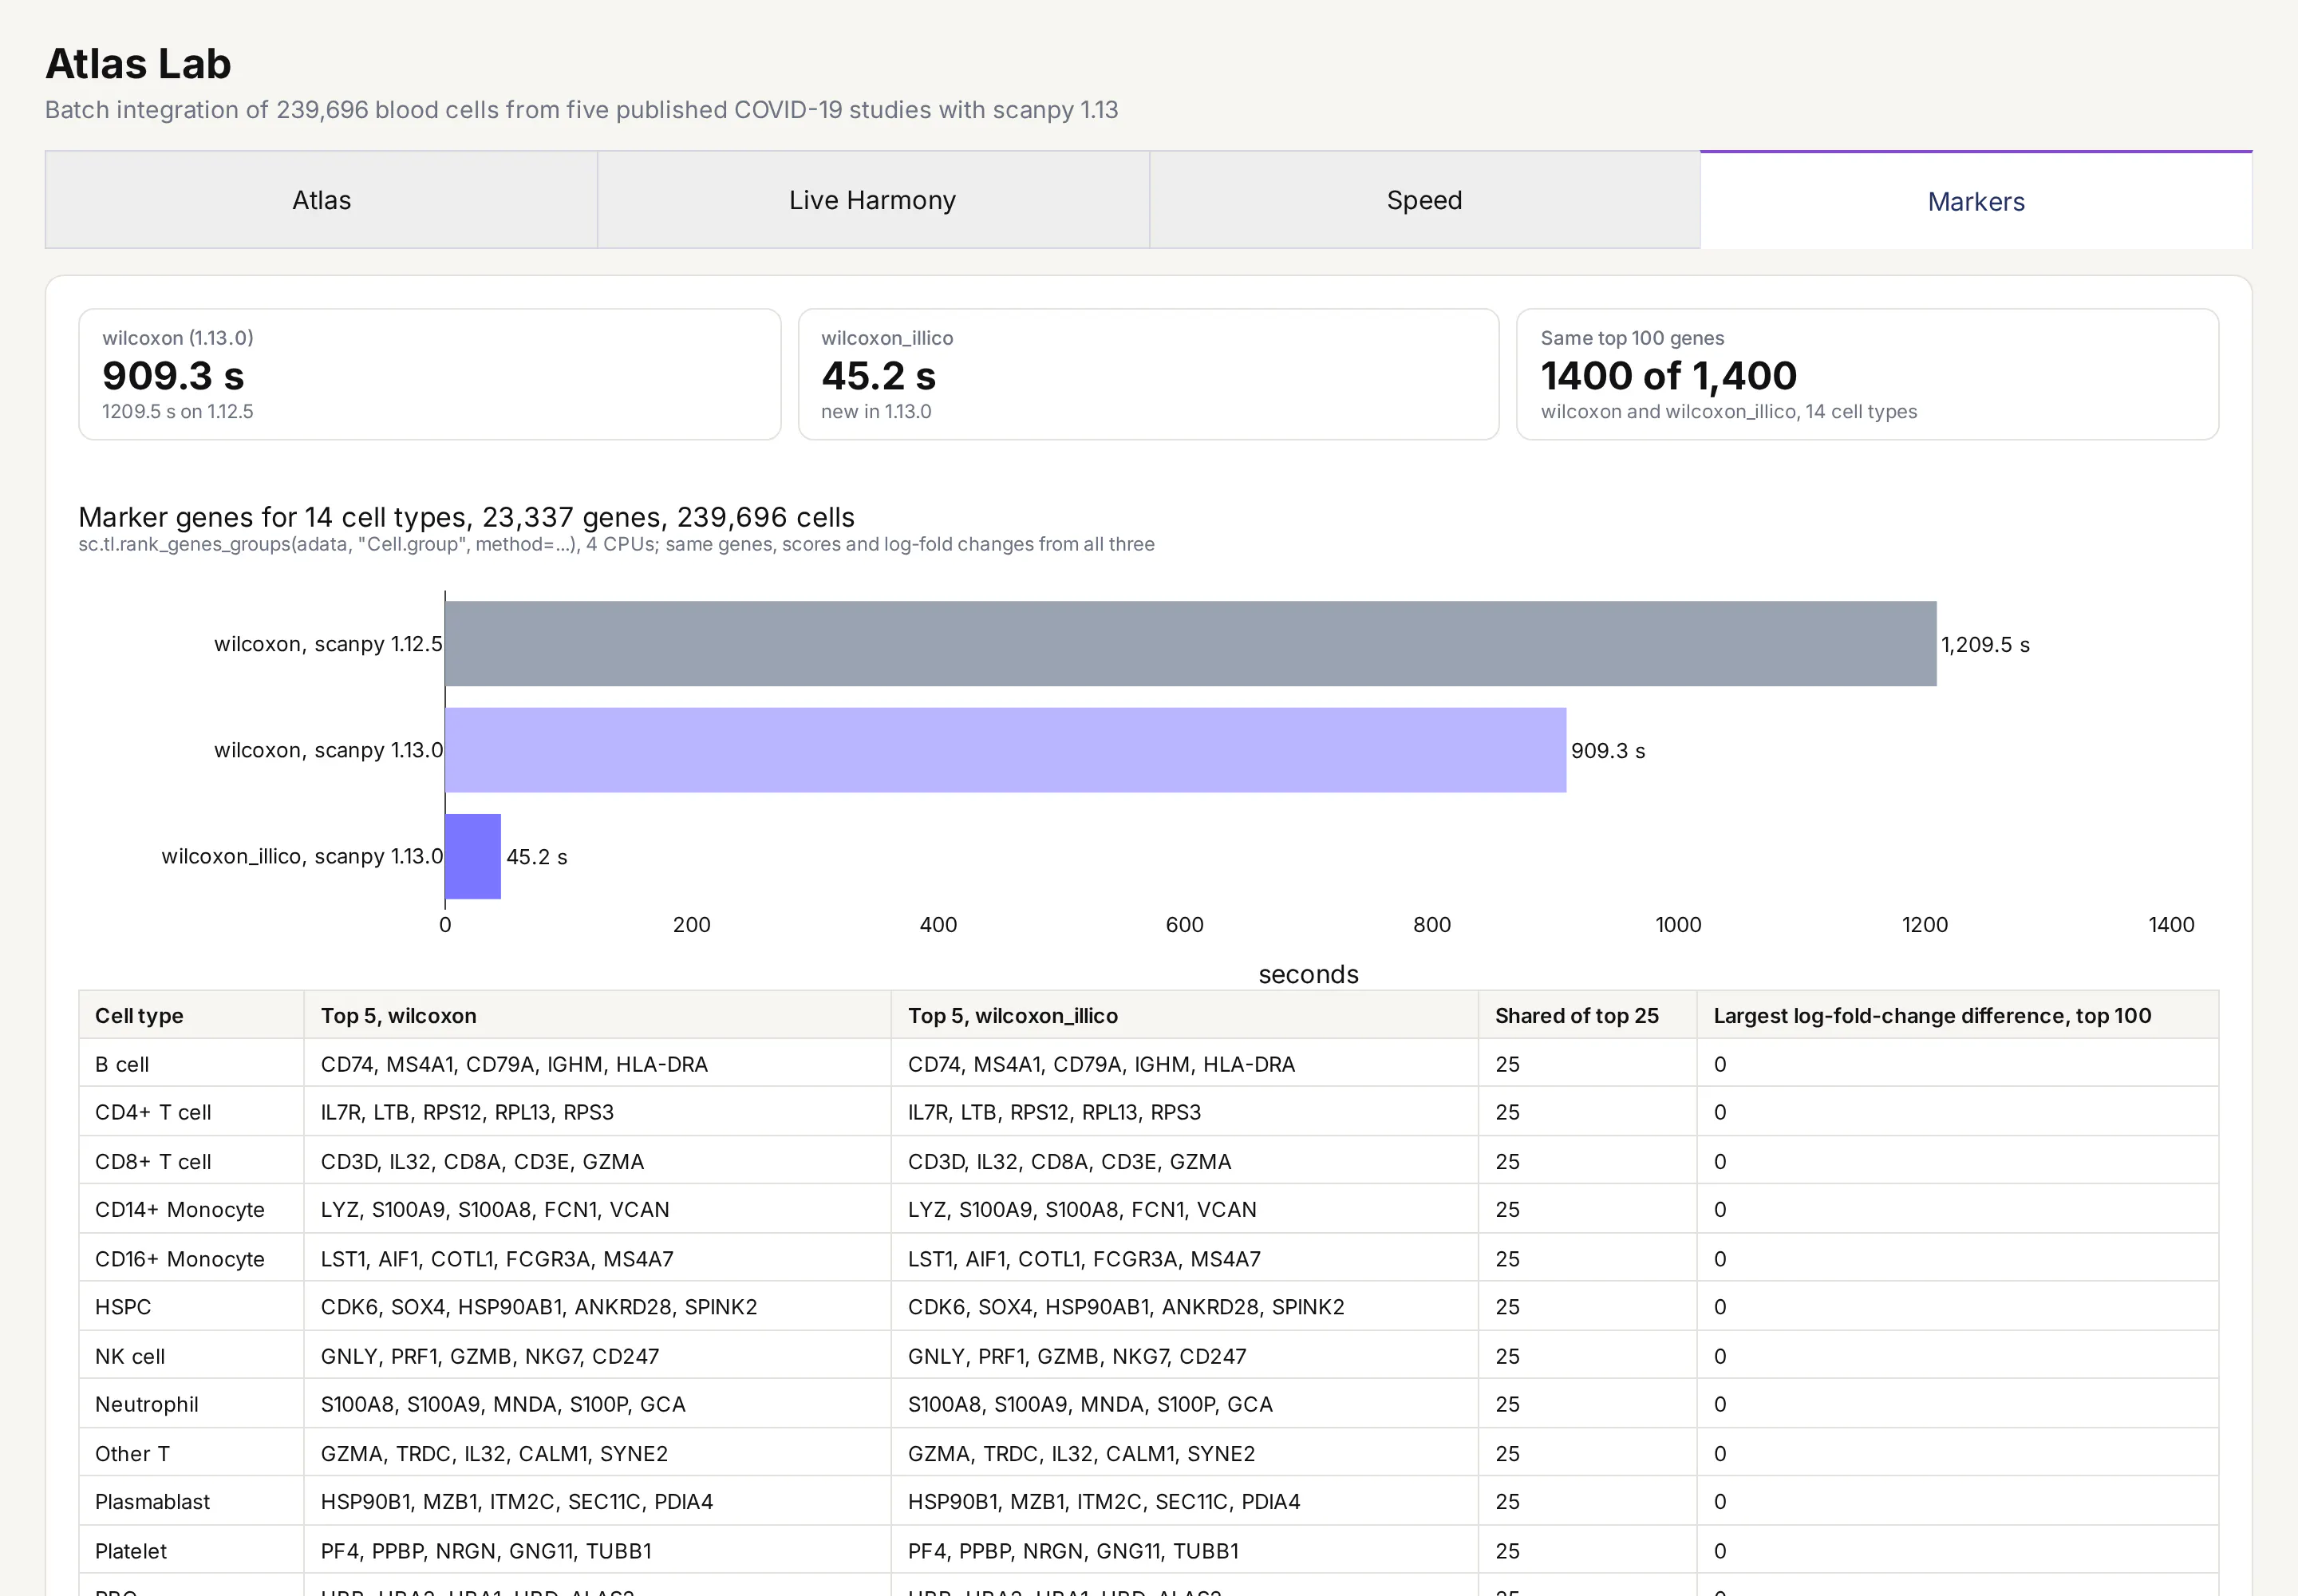
The Markers tab puts the classic Wilcoxon test and wilcoxon_illico side by side, with the top genes each one found for every cell type.
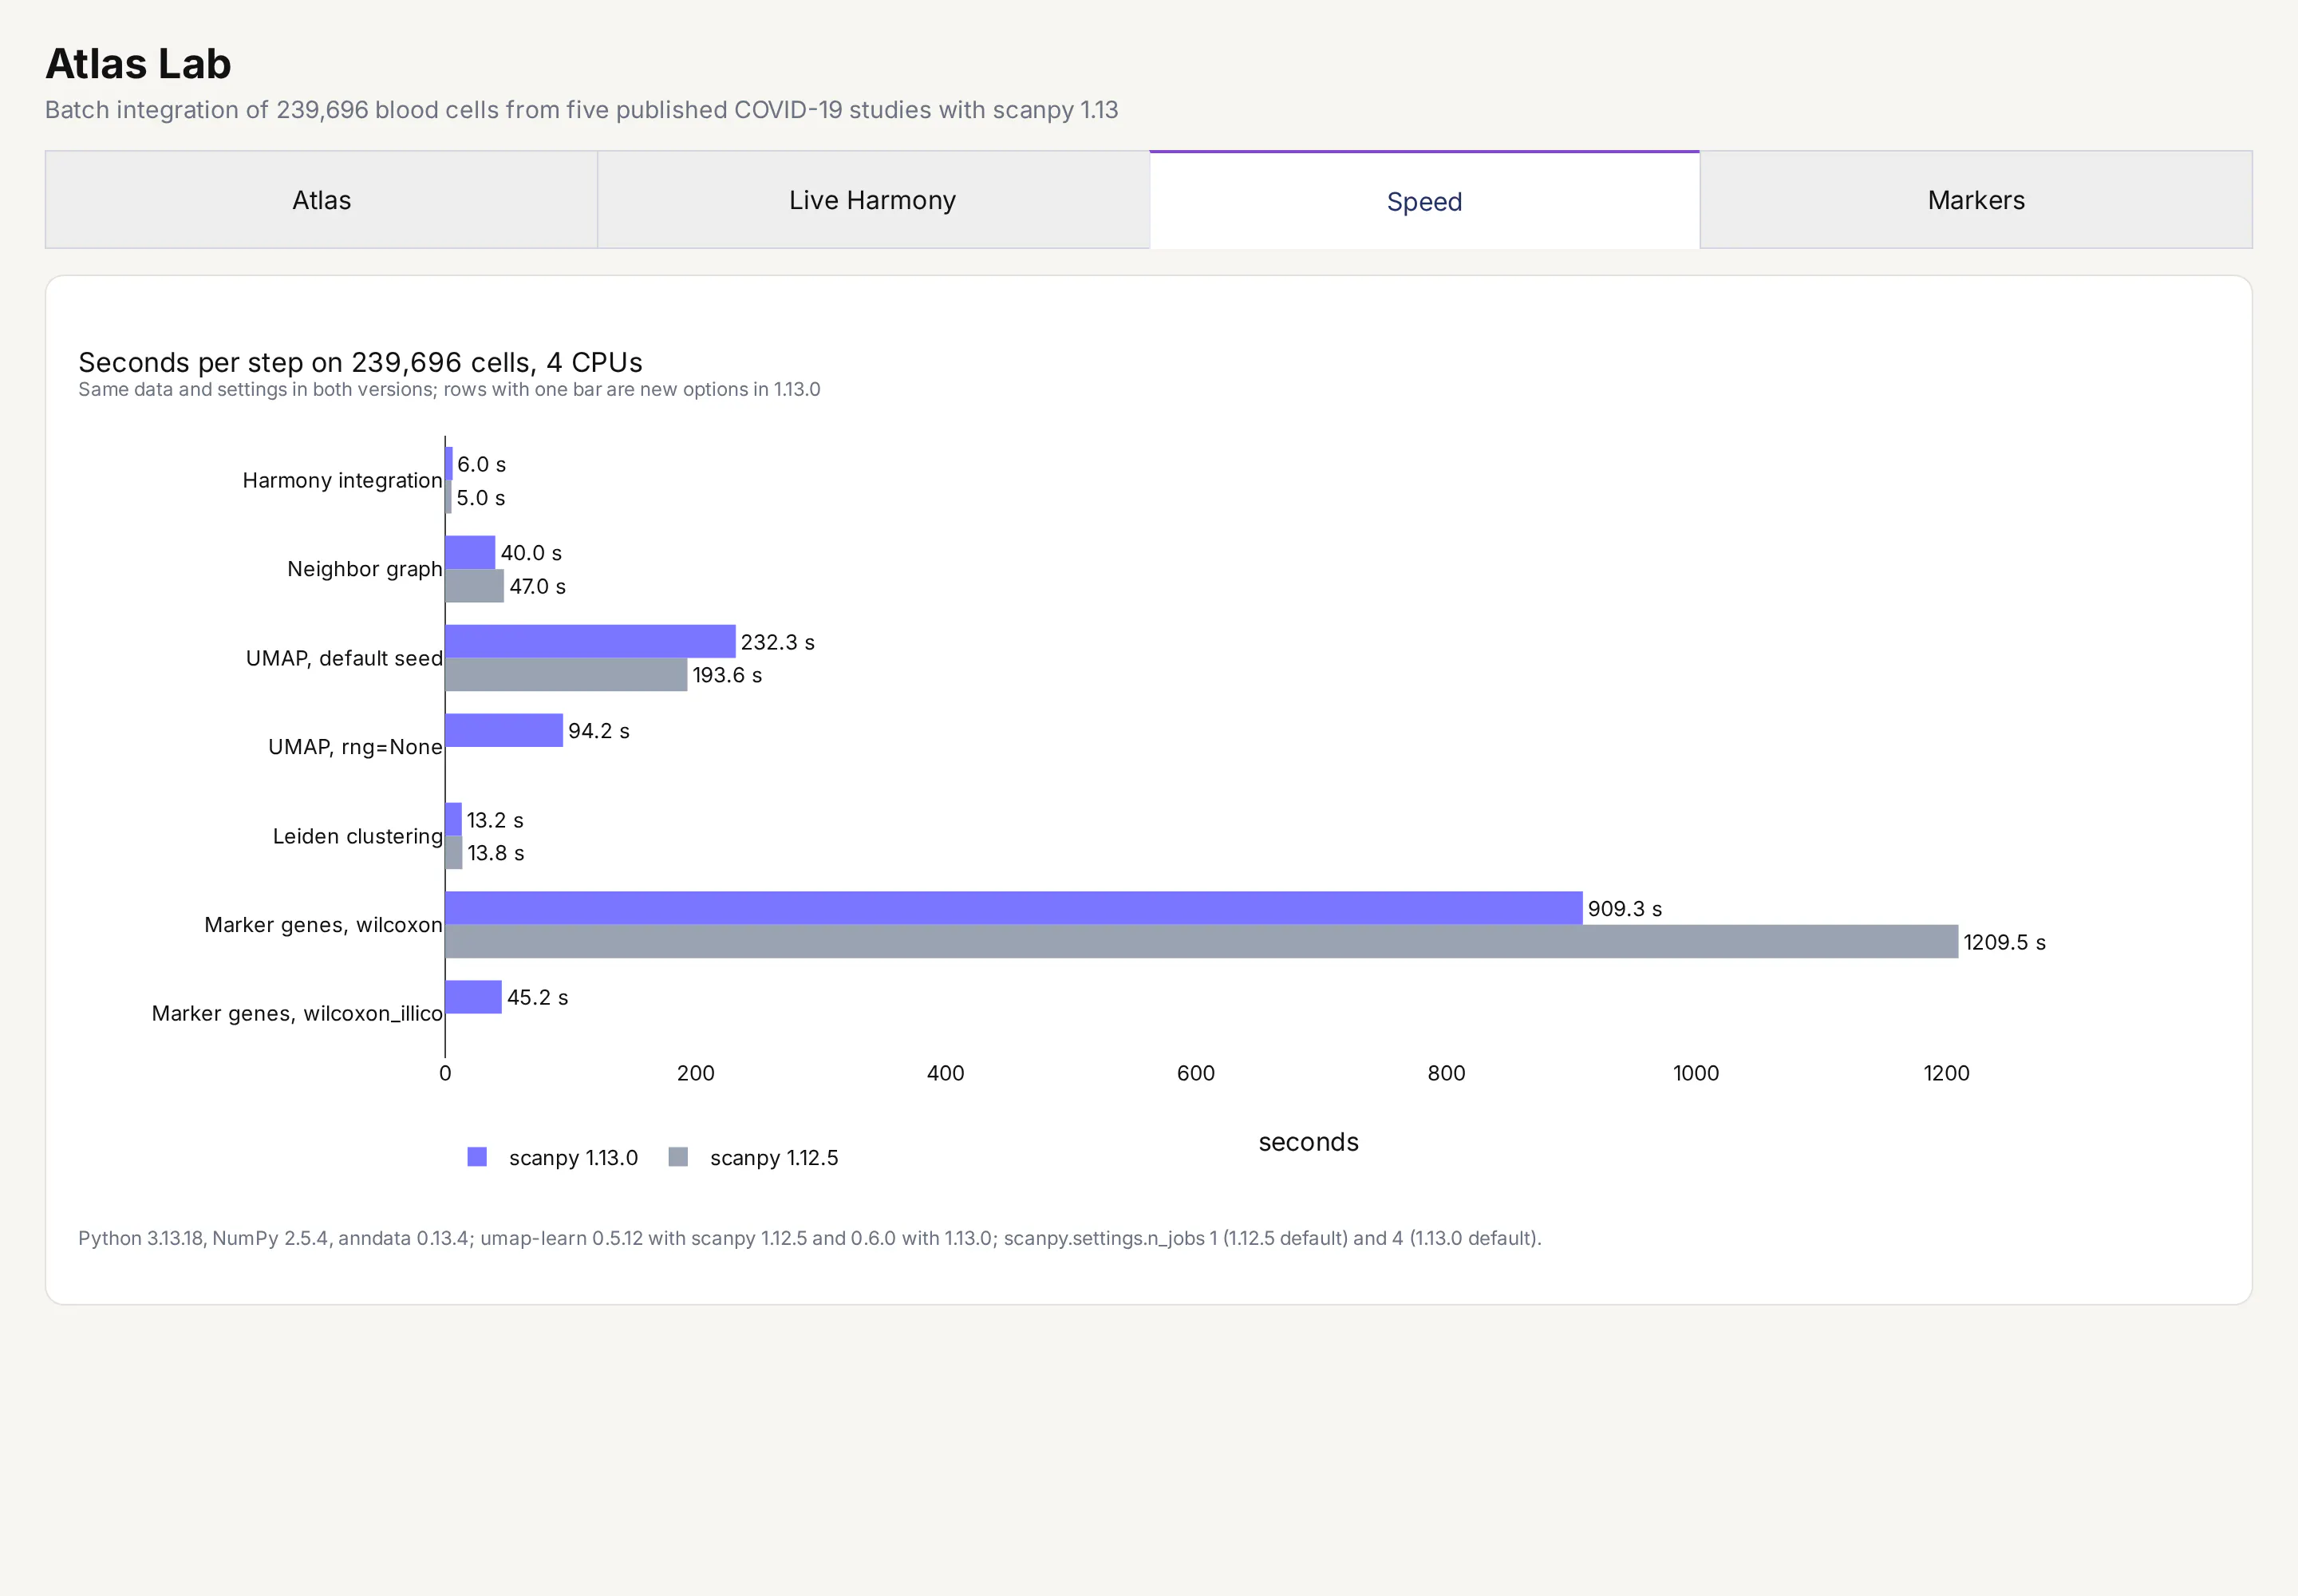
The Speed tab shows how long each step took on scanpy 1.12.5 and 1.13.0 with the same data and settings.
Putting the new features to the test
We ran the same pipeline on scanpy 1.12.5 and 1.13.0 on a Linux machine with four CPUs and 16 GB of memory (Python 3.13, NumPy 2.5.4, anndata 0.13.4), starting from the same principal components, and checked each new result against the old one.
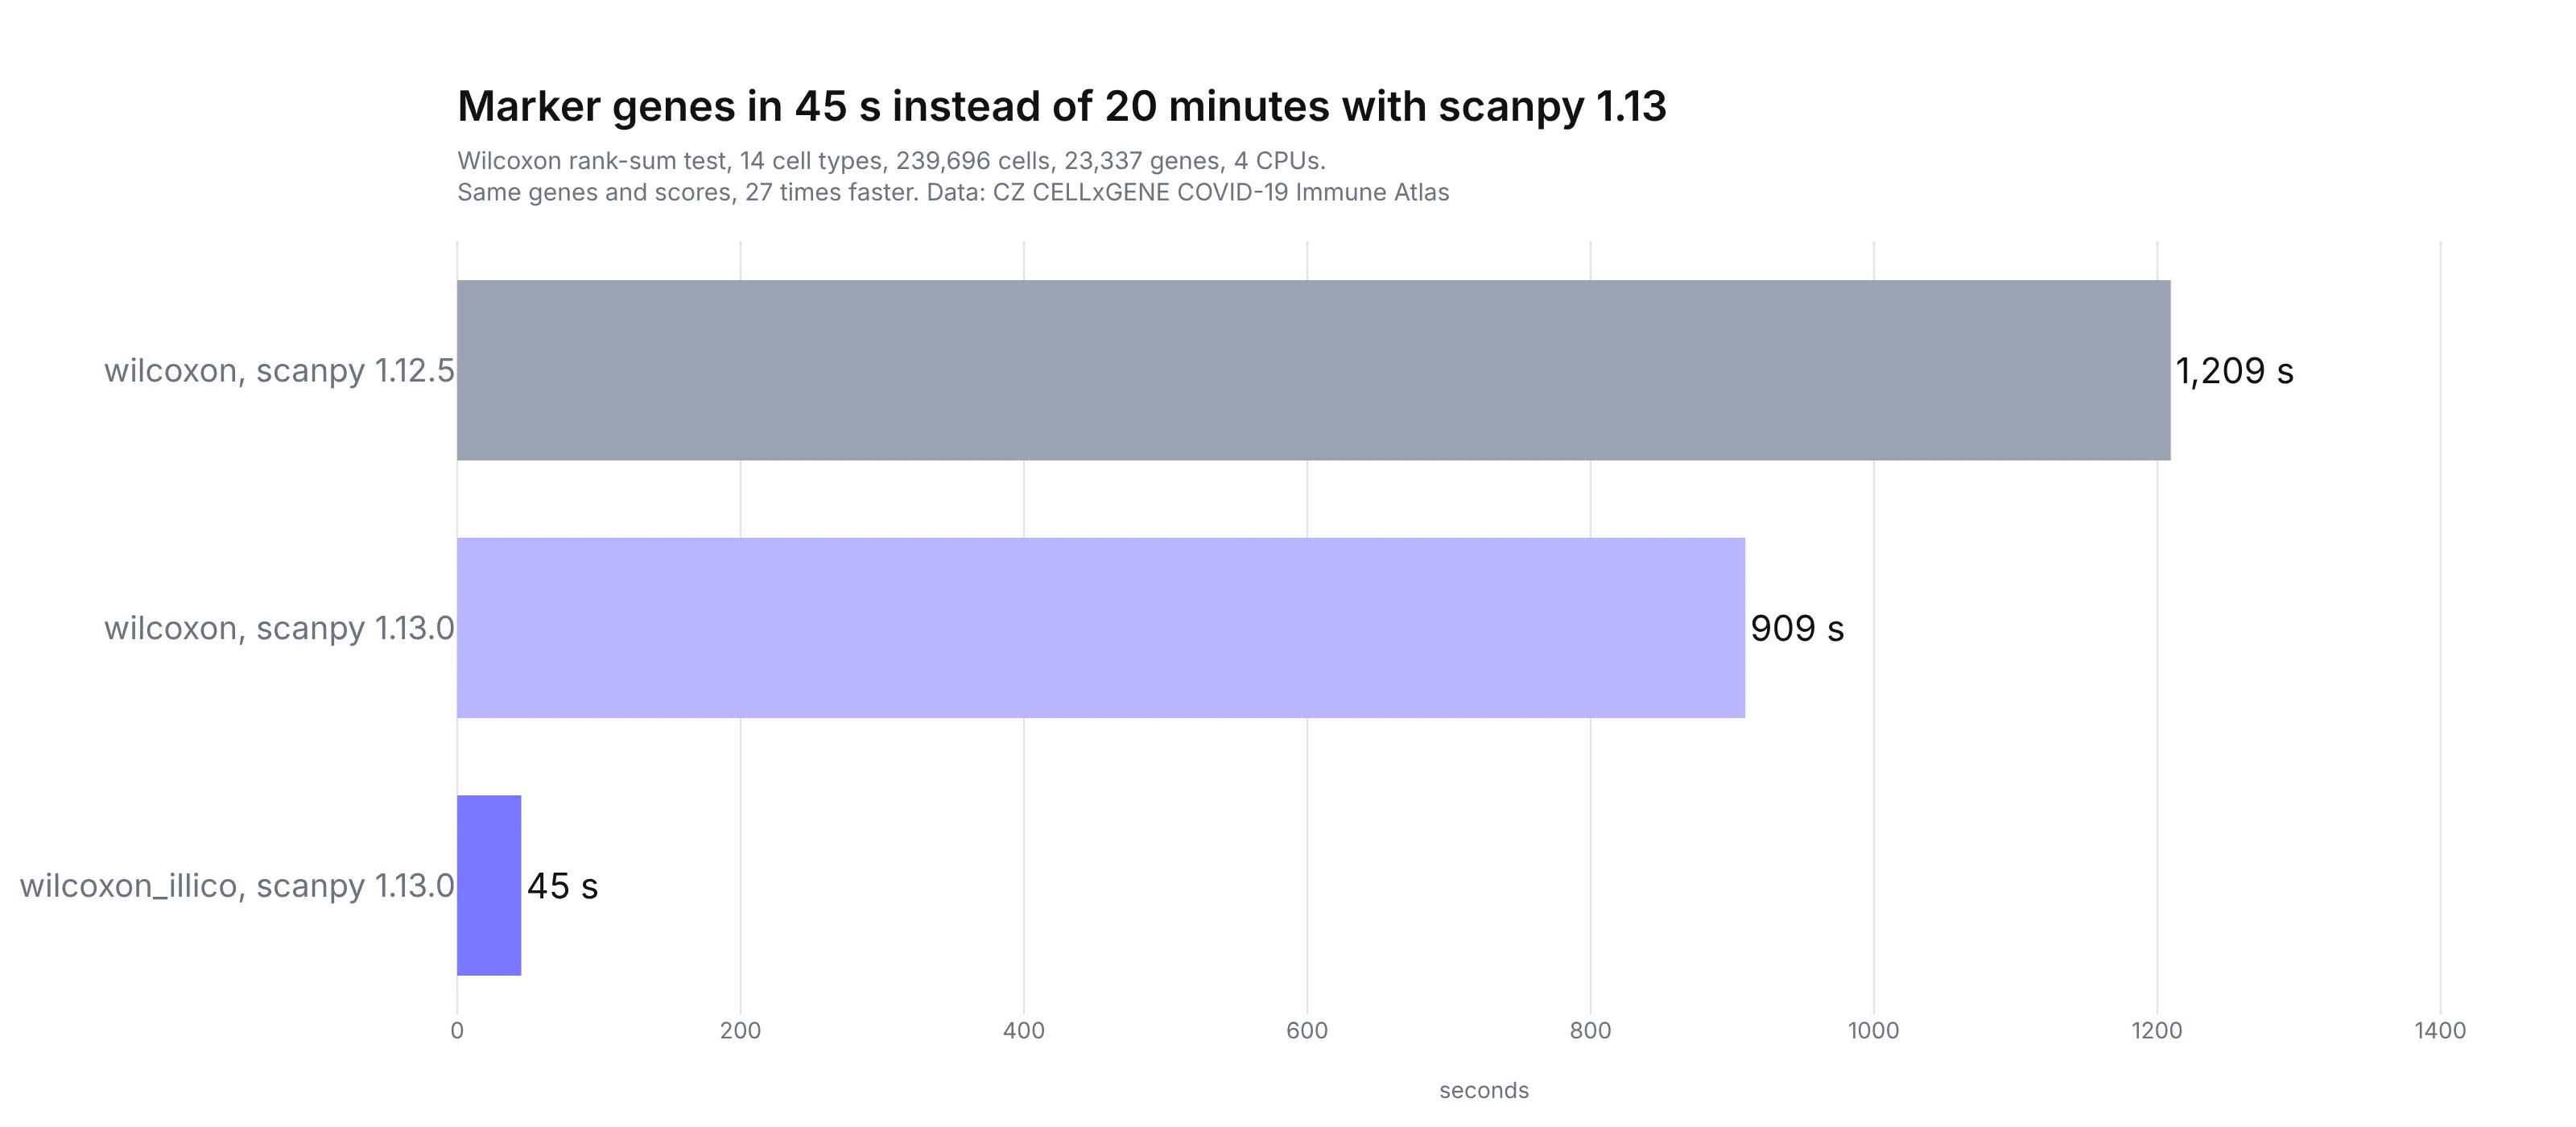
Marker genes: same answer, 27 times faster. For 14 cell types, 23,337 genes and 239,696 cells, method="wilcoxon" took 1,209.5 s on 1.12.5 and 909.3 s on 1.13.0 (where the default scanpy.settings.n_jobs went from one to four), and method="wilcoxon_illico" took 45.2 s. All 1,400 top-100 genes (100 for each of the 14 cell types) were the same and in the same order, and the scores and log-fold changes matched exactly.
Harmony: same answer as before. scanpy 1.12.5 users ran Harmony through the separate harmonypy package. On our data, the built-in function and harmonypy 2.1.0 gave nearly the same result, and their nearest neighbors overlapped by 95%:
Embedding
Study mixing (0 to 1)
Neighbors from the same study
Same cell type as neighbors
No integration
0.166
86.6%
89.9%
harmonypy 2.1.0 (scanpy 1.12.5)
0.416
63.1%
89.3%
sc.pp.harmony_integrate, default
0.411
63.7%
89.3%
sc.pp.harmony_integrate(flavor="harmony1")
0.432
62.0%
89.1%
The release notes say the new numba code made Harmony 6 to 13 times faster, and pull request #4424 measures that against scanpy's own earlier version from the 1.13 pre-releases. Against harmonypy 2.1.0, which is itself fast C++, we measured about the same speed: 5.42 s for scanpy and 4.55 s for harmonypy once warmed up. The original Harmony algorithm (flavor="harmony1") took 45.02 s.
UMAP: about twice as fast with rng=None. UMAP took 193.6 s on 1.12.5 and 94.2 s on 1.13.0 with rng=None. With the default fixed seed, which keeps the picture the same on every run, 1.13.0 took 232.3 s. That's from umap-learn 0.6.0, because the same scanpy with umap-learn 0.5.12 took 186.7 s.
The whole pipeline. Harmony, the neighbor graph, UMAP, Leiden clustering and marker genes took 1,468.8 s (24.5 minutes) on 1.12.5 with its defaults, and 198.7 s (3.3 minutes) on 1.13.0 with rng=None and wilcoxon_illico.
The full changelog
There's a lot more in 1.13. Here are a few lines from the scanpy 1.13.0 release notes, which go on to list dozens more features, performance work and fixes (the names in brackets are the contributors behind each change):
1.13.0 2026-11-13Breaking changes- Remove compatibility helper for passing parameters positionally (P Angerer, #3984)- Remove use_highly_variable parameter to scanpy.pp.pca andscanpy.experimental.pp.normalize_pearson_residuals_pca (P Angerer, #4039)- Remove 'rapids' flavor for scanpy.pp.neighbors, scanpy.tl.louvain, scanpy.tl.umap (P Angerer, #4052)Features- Add scanpy.settings.preset setting with the new preset scanpy.Preset.ScanpyV2Preview (P Angerer, #3653)- Add scanpy.pp.harmony_integrate with Harmony1 and Harmony2 support for batch correction(S Dicks, P Angerer, #3953)- Introduce blazing-fast illico as a new wilcoxon method in scanpy.tl.rank_genes_groups (I Gold)- Add scanpy.pp.bbknn, a native implementation of batch balanced kNN (S Dicks, #4306)...
Before you upgrade, note that sc.pp.filter_genes_dispersion and sc.pp.normalize_per_cell are gone, reading and writing functions moved to scanpy.io, and copy, inplace, use_rep, batch_key and use_raw are deprecated, with warnings that tell you what to use instead.
Running scanpy on Plotly Cloud and Dash Enterprise
These are the things we learned deploying Atlas Lab, and they apply the same way on Dash Enterprise.
- Compute the heavy steps ahead of time. Preprocessing and UMAP on 239,696 cells took minutes and about 7.6 GB of memory, so we ran them once and shipped the results with the app as Parquet files. The app runs the fast steps, like Harmony on 30,000 cells, live in callbacks.
- Warm up numba when the app starts. scanpy's new Harmony is compiled by numba the first time it runs. On Plotly Cloud the first call took 45.4 s and the next took 8.3 s, so the app makes one call when it boots, before anyone opens the page.
- Add tbb if scanpy runs outside the main thread. scanpy's numba code drops to a slow single-threaded mode when it's called from a background thread and numba has no thread-safe library to use. Add tbb to requirements.txt, and load libtbb.so.12 from the environment's lib/ folder with ctypes before importing scanpy (our app shows how). Dash callbacks under the default gunicorn workers run on the main thread, so they aren't affected.
- Give long callbacks time. We set gunicorn's worker timeout to 180 s in a gunicorn.conf.py next to app.py, because the default 30 s is too short for a first numba compile.
- Pin compatible versions if you stay on 1.12. scanpy 1.12.5 doesn't work with umap-learn 0.6.0 (pin umap-learn<0.6), and its sc.external.pp.harmony_integrate fails with harmonypy 2.x. scanpy 1.13 works with both.
Prompts to build it yourself
You can build these apps with a coding agent. These are the prompts that describe what we made.
The three charts at the top of this post:
Download the CZ CELLxGENE "COVID-19 Immune Atlas: Integration of 5 public COVID-19 PBMCsingle-cell datasets" h5ad. With scanpy 1.13 and Plotly, make three charts:1. Violin plots of genes detected per cell for each of the five studies (obs "Dataset").2. A UMAP of all cells after sc.pp.harmony_integrate on the study, colored by obs "Cell.group",with each cell type's name at its median position.3. A dot plot of the top two marker genes per cell type fromsc.tl.rank_genes_groups(method="wilcoxon_illico"): dot size is the share of cells expressingthe gene, color is the mean expression scaled per gene.Read only raw/X, obs and var (the file is large), and normalize the counts yourself.
The Atlas Lab app:
Build a Dash app called Atlas Lab that shows batch integration of a single-cell atlas withscanpy 1.13, using the same COVID-19 Immune Atlas.Offline: normalize_total to 1e4, log1p, 2,000 highly variable genes per study, PCA with 50components, sc.pp.harmony_integrate(adata, A.obs["Dataset"]), neighbors and UMAP (rng=None) onthe result, and UMAP on the uncorrected PCA. Save the UMAP coordinates and labels for every cell,and 30,000 random cells with their 50 PCs, as Parquet.Tabs:1. Atlas: a Scattergl UMAP of every cell, with radios for the layout (before or after Harmony)and the color (study, cell type, disease), and cards that score study mixing and cell-typeagreement with the 50 nearest neighbors.2. Live Harmony: checkboxes for the batch variables (study, donor), harmony2 or harmony1, atheta slider and a Run button that runs sc.pp.harmony_integrate on the 30,000 cells in thecallback and shows PC 1 against PC 2 before and after.3. Speed and 4. Markers: charts and tables from a benchmark of rank_genes_groups with wilcoxonand wilcoxon_illico.Run Harmony once at startup to warm up numba, add tbb to requirements.txt and set gunicorn'stimeout to 180 s. Use Inter, a light theme and the Plotly brand purple.
FAQ
Glossary
Single-cell RNA sequencing (scRNA-seq). A lab method that counts the RNA molecules from each gene in each individual cell, which shows which genes each cell has switched on.
AnnData. The Python object and .h5ad file format scanpy works with. It holds the cells-by-genes table plus tables of information about the cells (obs) and genes (var).
PBMC. Peripheral blood mononuclear cells, the white blood cells you get from an ordinary blood sample, such as T cells, B cells, NK cells and monocytes.
Raw counts. The number of RNA molecules from each gene counted in each cell, before any processing.
Normalization. Scaling each cell's counts to the same total (we used 10,000) and taking the log, so cells sequenced more deeply don't look more active.
CZ CELLxGENE Discover. The Chan Zuckerberg Initiative's free library of published single-cell datasets, all in the same .h5ad format.
Principal component analysis (PCA). A way to summarize thousands of genes as a few dozen numbers per cell (principal components) that keep most of the differences between cells.
Batch effect. Differences in the data that come from how samples were processed (a different lab, day or machine) rather than from biology.
Harmony. A method from a 2019 Nature Methods paper by Korsunsky and colleagues that removes batch effects. It groups cells into clusters and nudges each cell's principal components until every cluster contains a fair mix of batches. Harmony2 is a newer version of the algorithm and the default in scanpy 1.13.
UMAP. Uniform Manifold Approximation and Projection, a method that draws high-dimensional data as a 2D map where similar cells sit close together.
Leiden clustering. A method that splits the graph of nearest-neighbor cells into groups (clusters) that usually correspond to cell types.
Marker genes. Genes that are much more active in one group of cells than in the rest, used to name cell types.
Wilcoxon rank-sum test. A statistical test that compares two groups by the ranks of their values, so it doesn't assume the data follows a bell curve. scanpy uses it to rank marker genes.
numba. A Python library that compiles Python functions to fast machine code the first time they run.