
Priyaanka Arora
September 26, 2025
Highlights From the Rise of Vibe Analytics
Data analytics is shifting beneath our feet, and it’s a vibe.
At Plotly's recent webinar, we showcased the debut of our new tools, Plotly Studio and Plotly Cloud, that will forever change how you work with data. We featured an expert panel talking about the new phenomenon of vibe analytics. Is it hype, or the go-to way to analyze your data? We covered that, and more in this webinar.
Here’s a quick recap in case you missed it.
The rise of vibe analytics
Our early research is showing us that more than 50% of developers now use AI for data analysis, yet only 18% trust AI-generated code for production. This gap reveals the core challenge facing data teams today.
Enter vibe analytics, Plotly's vision for a new era where AI goes beyond being a chatbot to actually building complete data applications for you. It’s not science fiction: try Plotly Studio here and make your AI-generated data app for free.
Vibe analytics skips drag-and-drop (*cough* BI) for something more useful: natural language commands that generate sophisticated, code-backed analytics. And you can even skip the natural language prompts if you’d like. Generate an app with your data, and nothing but your data.
This was AI-generated by Plotly Studio + a csv.
How Plotly Studio takes you from CSV to data app in a snap
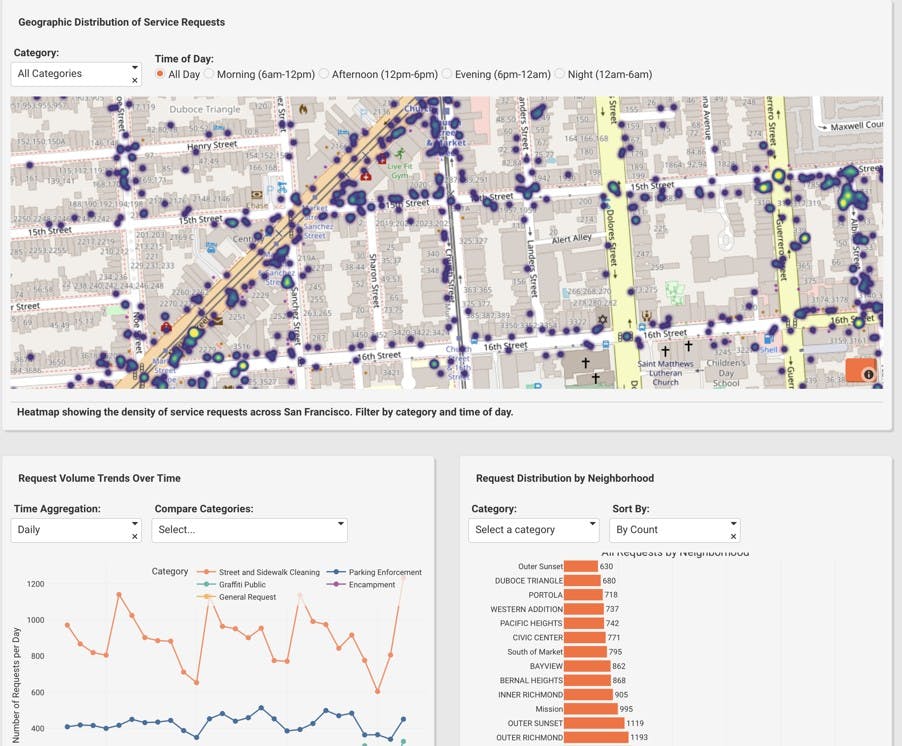
The star of the show was our demo of Plotly Studio. Plotly’s Senior Engineering Manager, Matt Brown, uploaded a CSV file of bee observations and generated a complete data application in under two minutes. The result was bee-utiful: a fully interactive app with global filters, geospatial mapping, data cards, and drill-down capabilities.
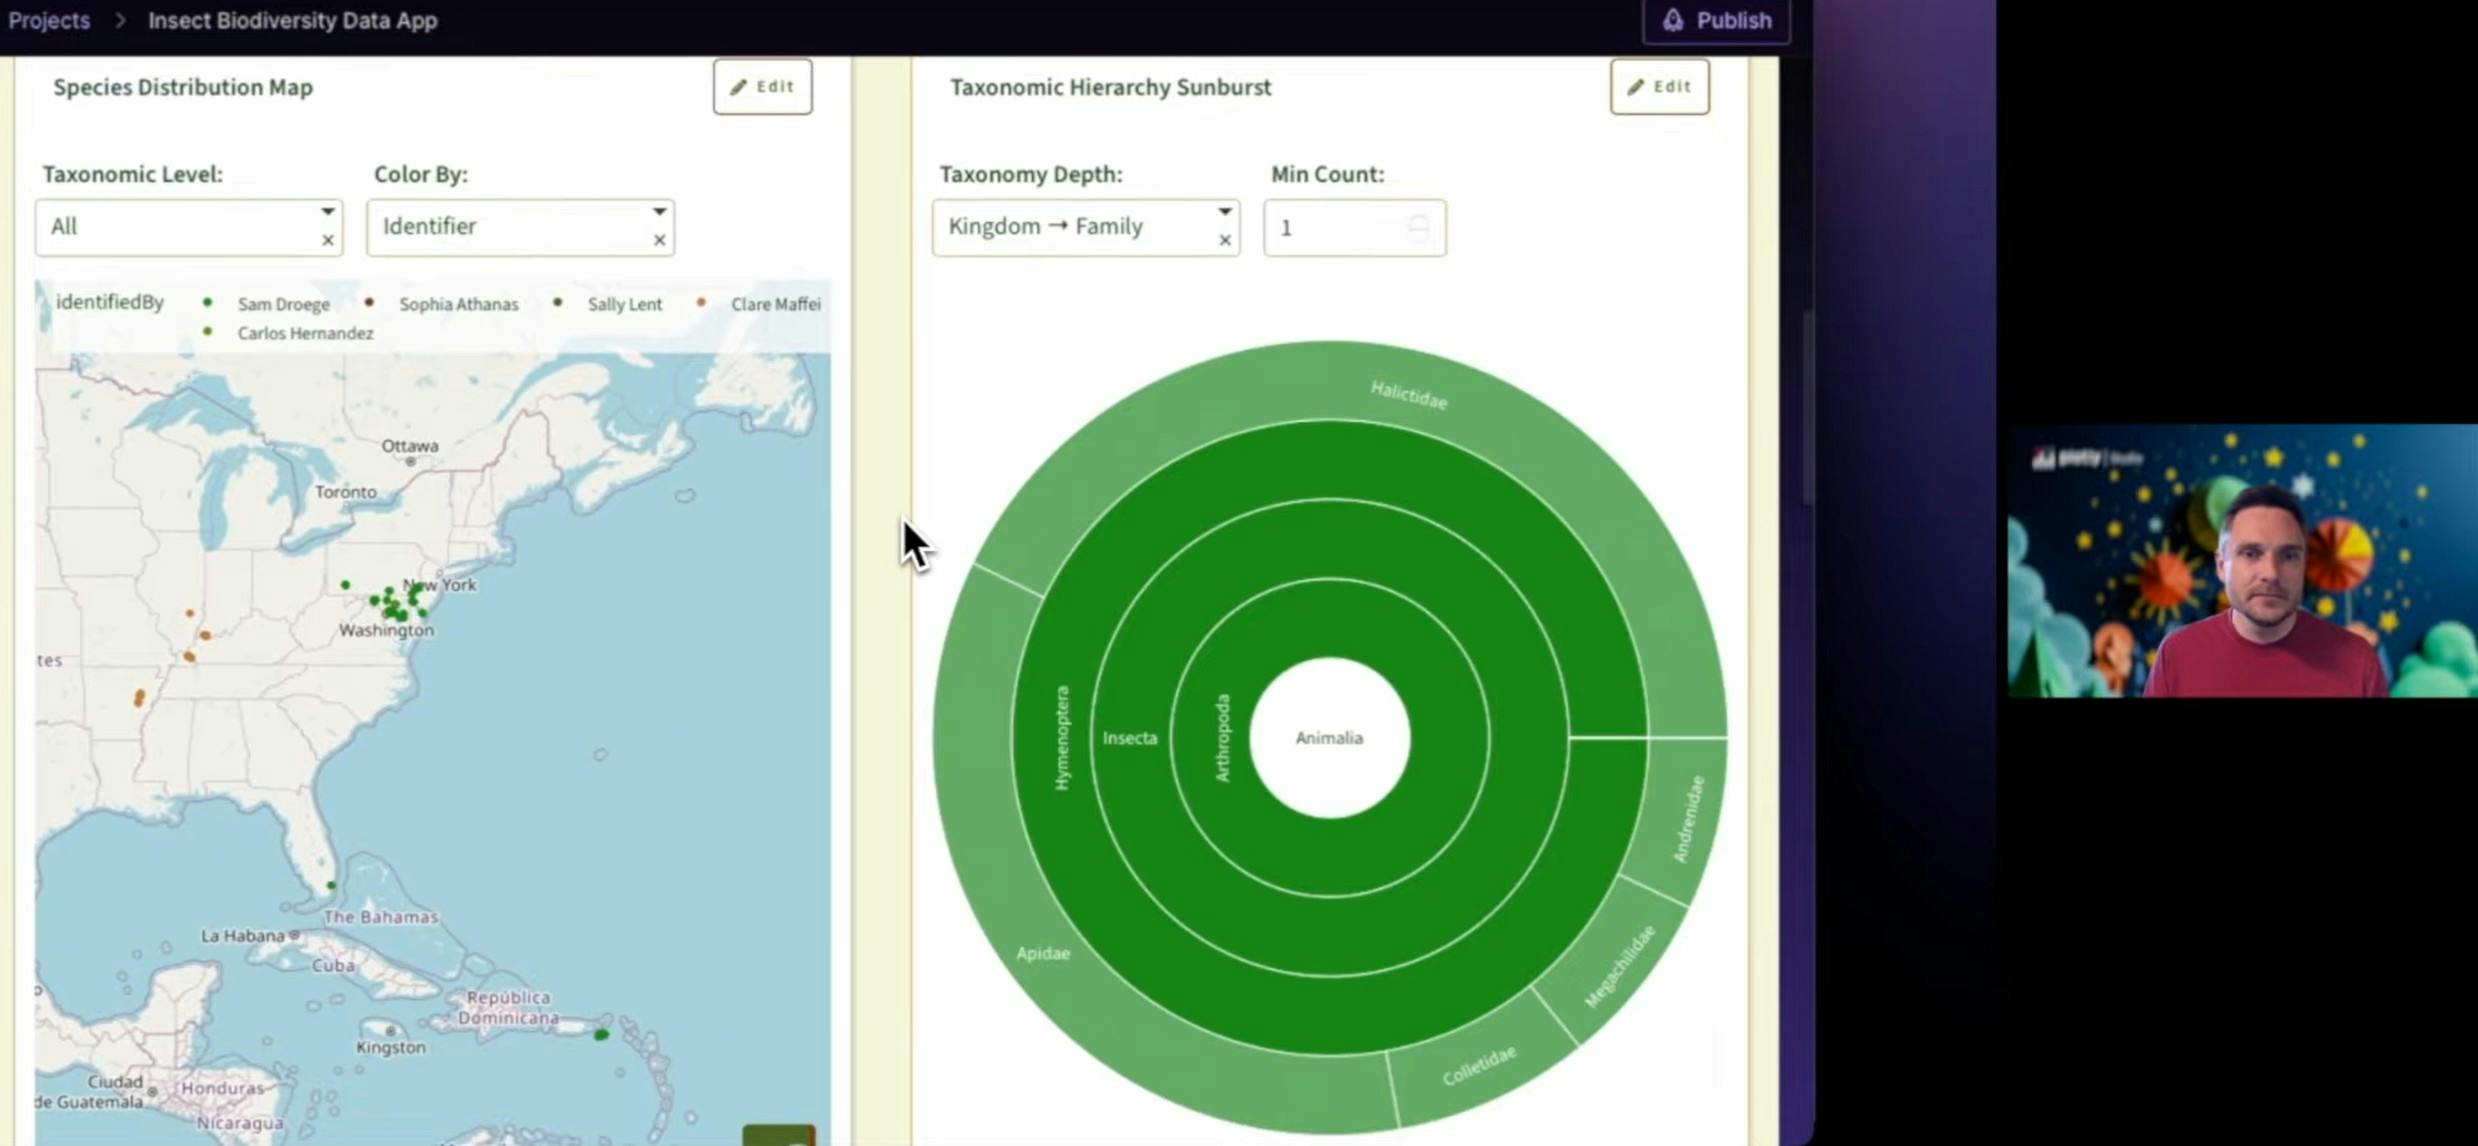
What made this particularly compelling was the editing experience. When Matt wanted to add a timeline view by collector, he simply typed his request in natural language. Within seconds, the data app regenerated with the new functionality. Learn more about Plotly Studio.
The academic perspective on vibe analytics
Class is in session. Michael Schrage from MIT Sloan provided crucial context, distinguishing between "vibe coding" (which generates code artifacts) and "vibe analytics" (which generates insights and interpretations). His key insight: the goal is a little different to creating software objects. Vibe analytics is the act of generating actionable insights that move business metrics.
Schrage emphasized that this approach enables "improvisation for insight", which is the ability to explore data at the speed of thought rather than being constrained by technical implementation barriers. Follow Michael Schrage’s vibe analytics research here.
Telecom analytics with Broadband Insights
Patrick Hutto from Broadband Insights offered a practical perspective on how Dash Enterprise and Plotly Studio solve real business problems. His company serves smaller telecom operators who lack the massive data science teams of AT&T or Verizon.
For them, Plotly Studio transforms what used to be days of development work into minutes of natural language interaction. The impact enables true self-service analytics where business stakeholders can explore their own data without waiting for custom reports. Read the Broadband Insights user story.
Code-backed intelligence
Throughout the webinar, one principle remained constant: AI generates the code, but code performs the analysis. This architecture ensures deterministic results while maintaining the flexibility that comes from natural language interaction.
As Chris Parmer, our CPO, noted, we’re not trying to replace data scientists, but rather we’re augmenting their capabilities and extending advanced analytics to a much broader audience.
Roadmap for days
Our roadmap is looking at three key areas of development for Plotly Studio:
- Enterprise data connectivity: Moving beyond CSV files to connect with databases, APIs, and SaaS platforms like Salesforce through AI-powered natural language queries
- Enhanced collaboration: Making the creation process as collaborative as the final applications, with shared specs and multi-user editing capabilities
- Advanced verifiability: New interfaces for validating AI-generated data transformations, addressing the trust gap that exists with coding with AI
View the roadmap and vote on your favorite ideas.
The bigger picture with Brian Julius, BI expert
This webinar showcased our new product features, yes, but we uncovered a bigger picture. We believe we have reached a fundamental shift in how we think about data accessibility. The traditional barrier between technical and non-technical users is dissolving, replaced by a shared language of business questions and data-driven answers. The person asking the smartest questions about your data can now build the answers.

“We're done making dashboards for everything. People just want to ask questions and get answers.” - Brian Julius, 6x LinkedIn Top Voice in data analytics and AI
Brian Julius from Enterprise DNA captured this well during his discussion with Chris Parmer: we're moving away from an era where everything becomes a dashboard toward more targeted, question-driven analytics. Follow Brian for great content and a welcome break from AI slop on LinkedIn.
What vibe analytics means for data teams
The implications are significant. Data teams can focus less on routine report generation and more on complex analytical challenges. Business stakeholders gain direct access to their data without lengthy request cycles. Organizations can democratize analytics without sacrificing technical rigor.
And we have a way for you to practice! The Analytics Vibe-a-Thon is our new hackathon challenge that invites you to explore these possibilities firsthand. It's an opportunity to see how natural language can reshape the relationship between questions and insights. Register here, and yes there’s cash prizes.
We think the webinar made one thing clear: the future of analytics combines human expertise and AI in ways that make both more powerful.
Judge for yourself, watch the webinar.