
Chris Parmer
October 23, 2026
The Golden State Valkyries in 18 Plotly charts
The Golden State Valkyries are in the WNBA Finals in their second season. No franchise in league history has made the Finals that fast. They went 32–12 (32 wins, 12 losses) with the best defense in the league, beat Dallas and swept Las Vegas (won every game of the series), and took Game 1 from Atlanta. Atlanta has won the two games since, and Game 4 is Saturday in Atlanta. They've sold out every game in their season.
I live and work out of San Francisco and I'm a huge fan. I worked with Opus 5.5 in Claude Code to make Plotly charts about their season: some classic sports charts, and some court graphics that look more like they came out of a design studio than a stats site. The box score (the basic per-game stats like points, rebounds and assists) and advanced stats come from Basketball-Reference. The shot locations come from ESPN's play-by-play feed (a log of every event in every game), which has an x/y position for every one of the roughly 7,000 field goal attempts (every shot except free throws) in the Valkyries' 53 games.
All of these are plotly.js, in the team's colors: Valkyrie Violet, black and gold. Each chart is one fixed-size figure with its title, legend and source inside it, so it reads fine on its own when it gets shared. As in 19 extraordinary charts made with Opus 5.5 and Plotly, there's a note under each chart on how it's built.
TL;DR
- The Valkyries went 32–12 with the best defensive rating in the WNBA: 100.6 points allowed per 100 possessions (a possession is one team's turn with the ball). They ranked 1st in seven of nine team stats we lined up against the league.
- Every shot chart is built from ESPN shot coordinates and drawn in Plotly with nothing but scatter markers and layout shapes. There is no court or hexbin trace involved.
- Opponents shot 31.3% on corner threes (three-pointers from the corners, the shortest three-point shot) against Golden State, 4.6 percentage points under league average.
Every game, by margin
Data: Basketball-Reference game log
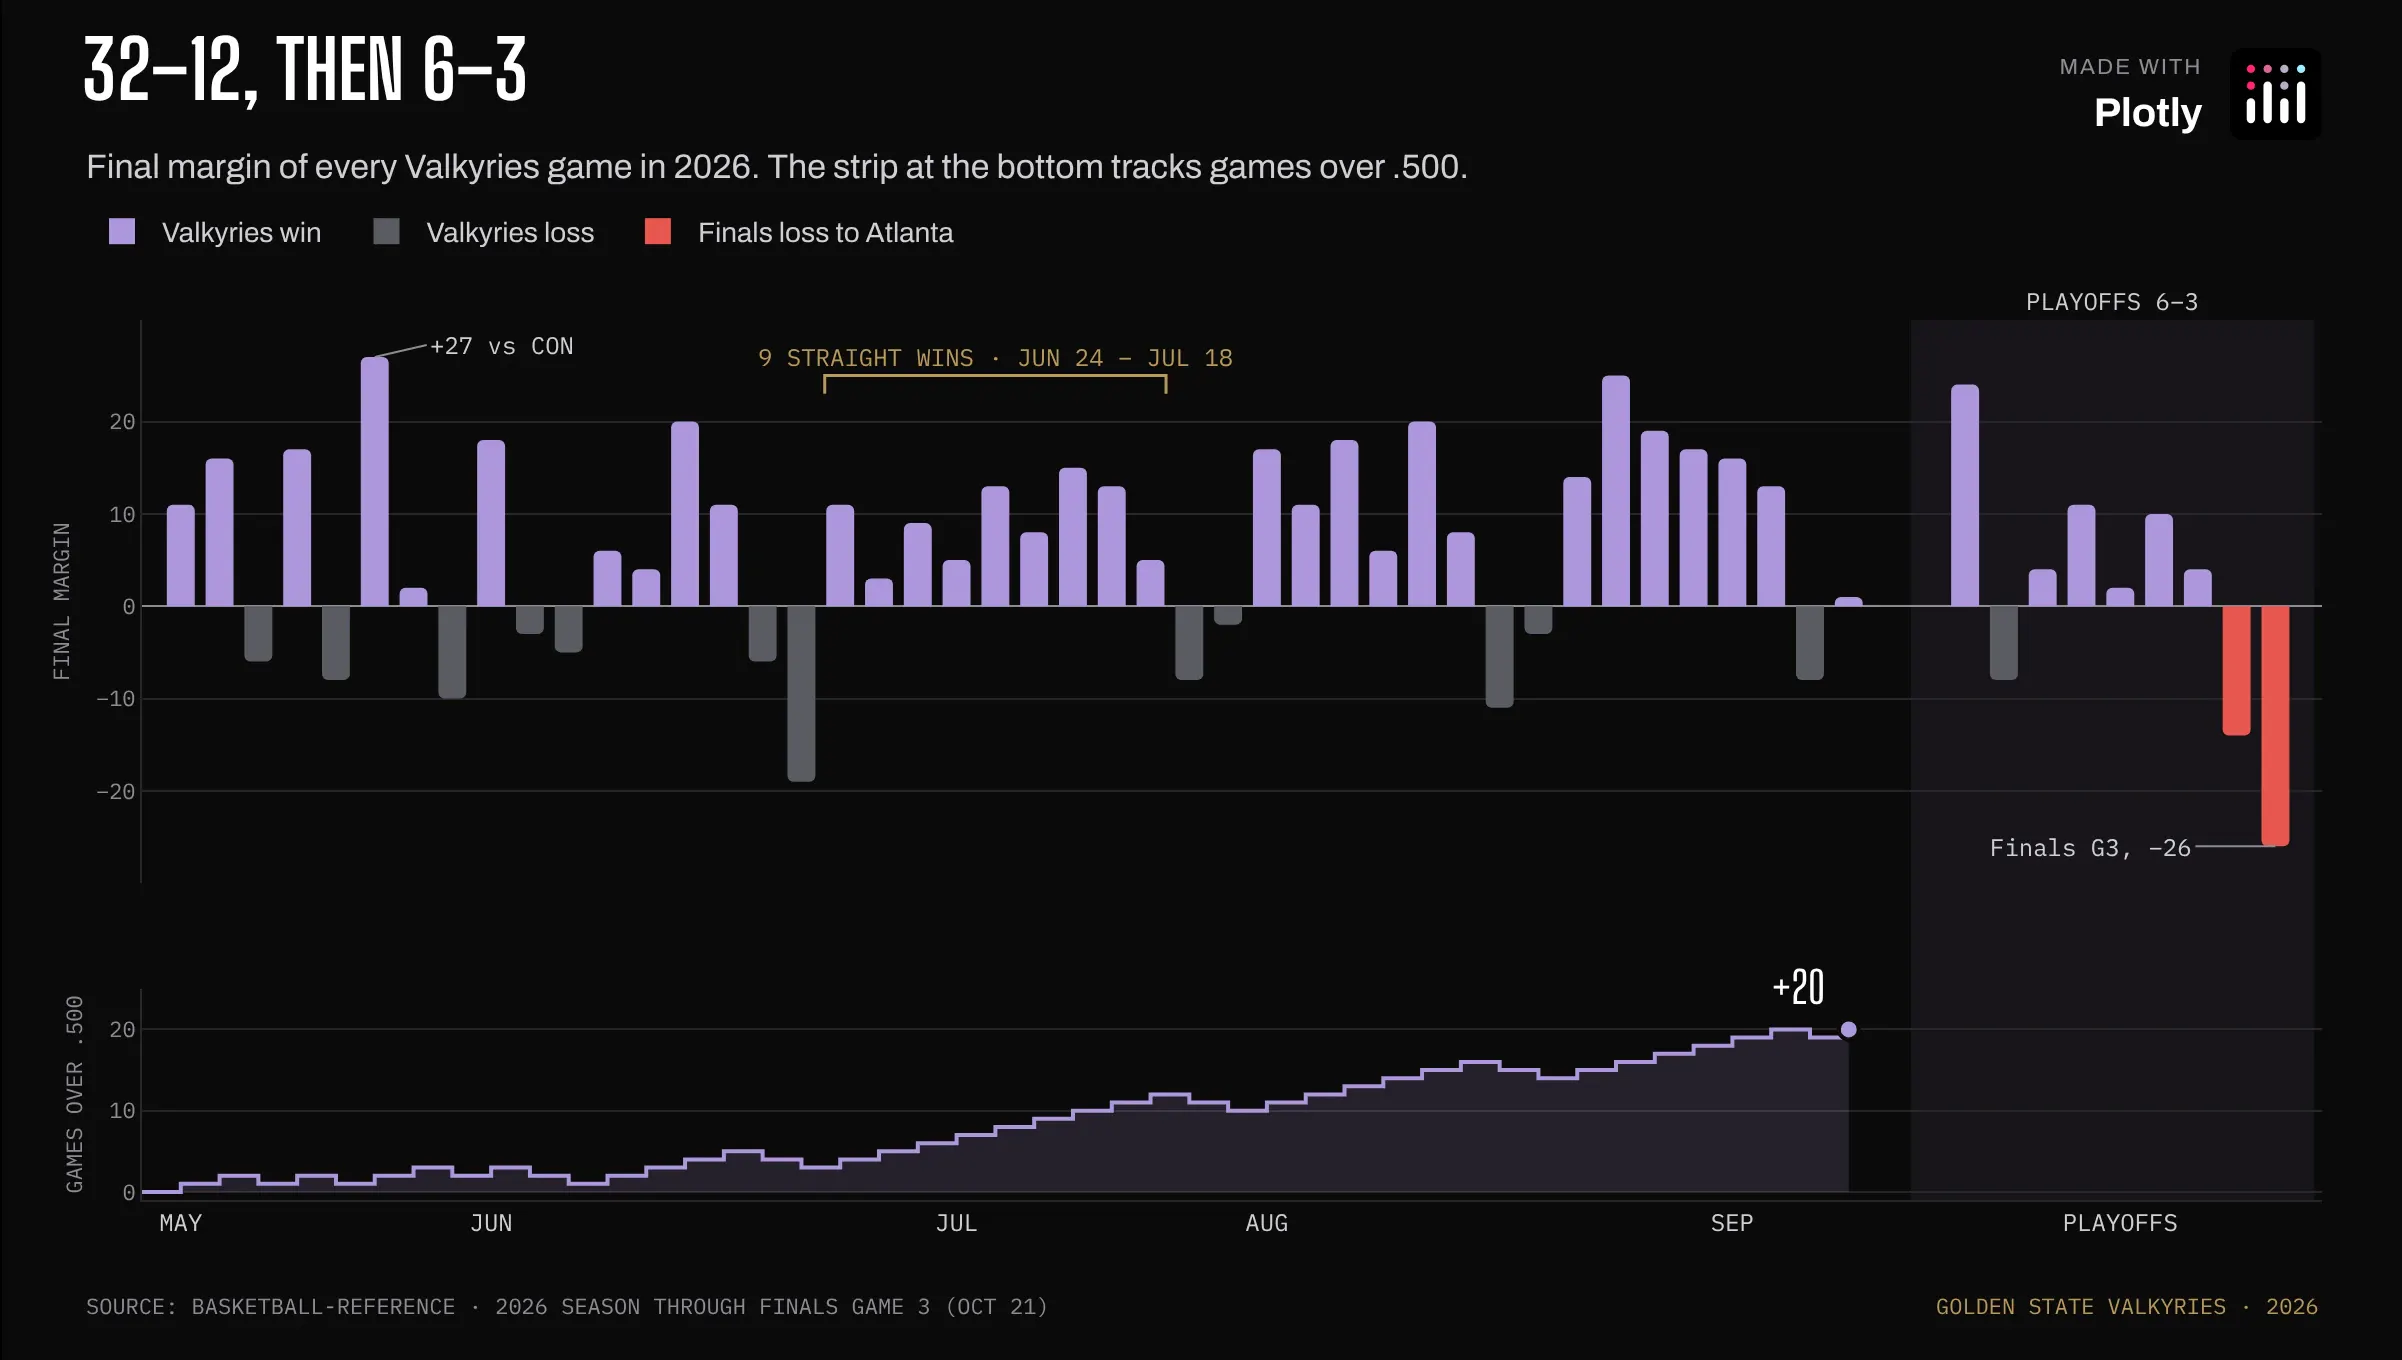
Prompt: Create a Plotly chart with one bar per Valkyries game, sized by final margin and colored by result, with the playoffs shaded, a bracket over the nine-game win streak, and a games-over-.500 step line in its own panel underneath.
They went 32–12 (32 wins, 12 losses), and the bottom strip shows how steady it was. They were never under .500 (at no point in the season did they have more losses than wins), and they won nine straight from June 24 to July 18.
How the graph was made: The two panels are two y-axes stacked with domain on one shared x-axis, so each game lines up with its step in the games-over-.500 line. That isn't a dual-axis chart: each measure gets its own space and its own scale. The playoff band is a rect shape with yref: "paper", and the streak bracket is a three-segment path shape.
Seven league extremes
Data: Basketball-Reference league stats
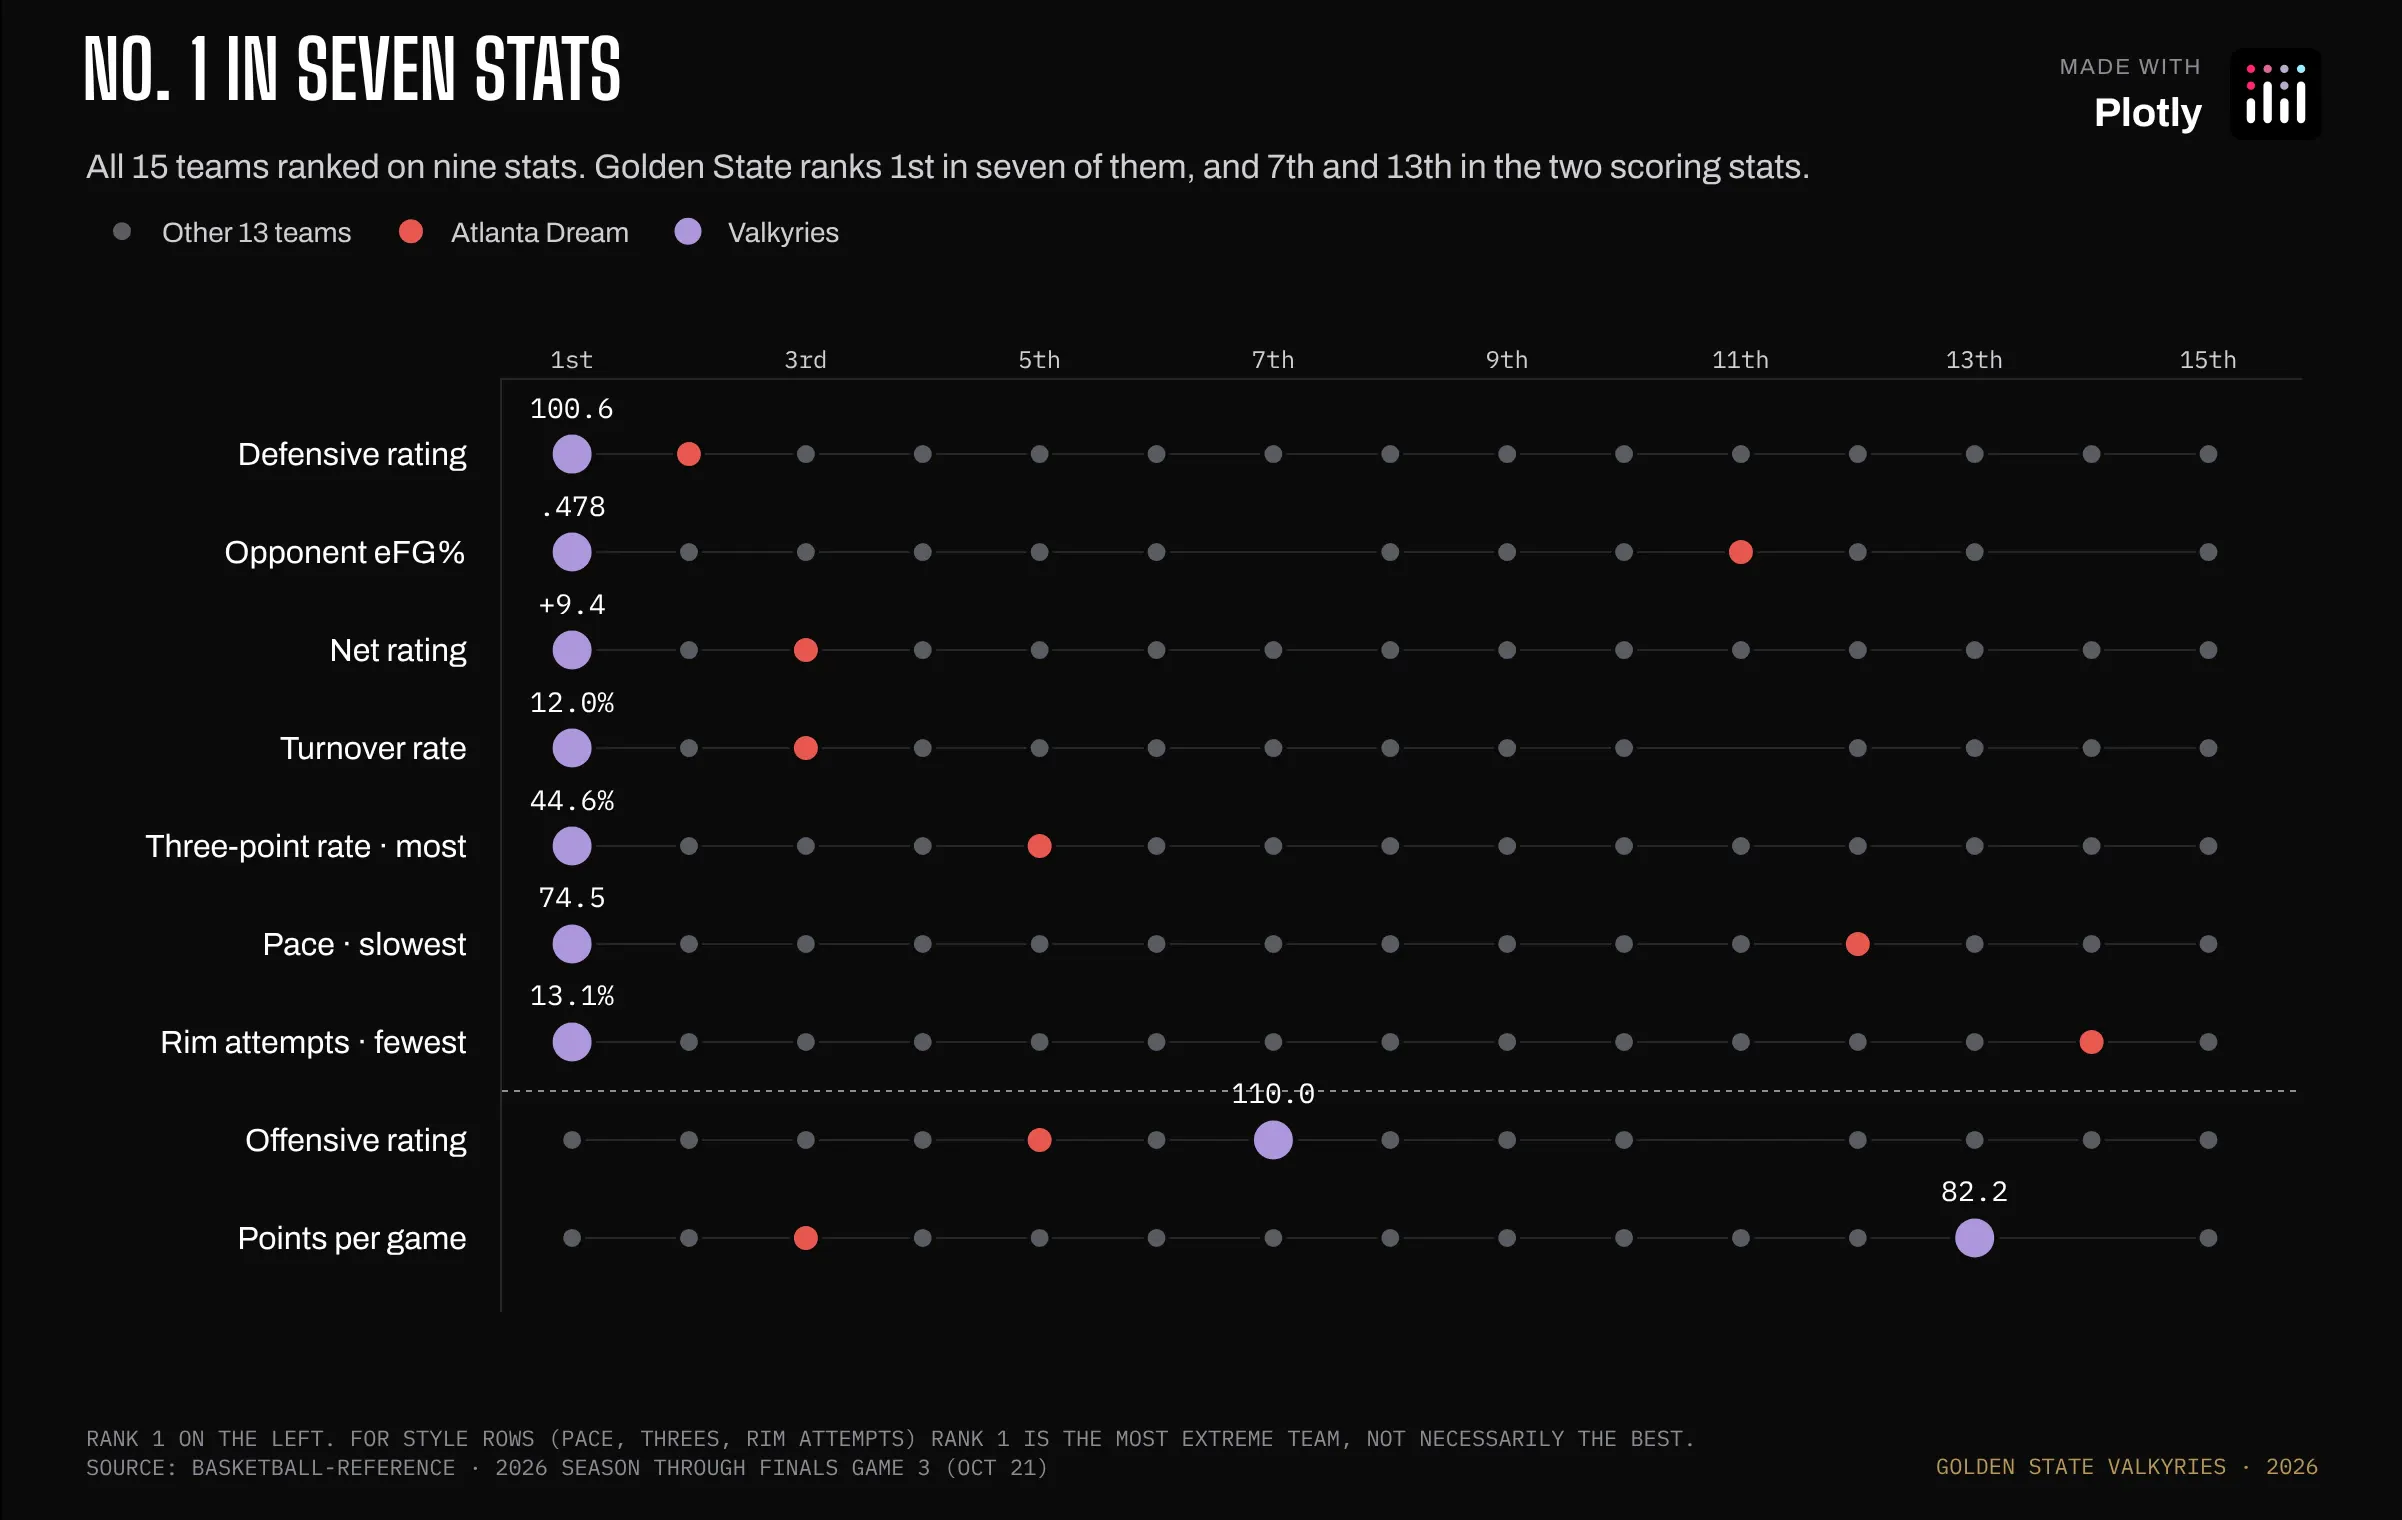
Prompt: Create a Plotly chart that ranks all 15 WNBA teams from 1st to 15th on nine stats, one row per stat, with the Valkyries and Atlanta drawn as their own traces and a dotted rule between the defense and style rows and the scoring rows.
Golden State ranks 1st in defensive rating, opponent eFG% (effective field goal percentage, a shooting percentage that counts a made three as one and a half makes), net rating (points scored minus points allowed per 100 possessions) and turnover rate (the share of possessions that end with losing the ball before a shot). They also take the most threes, play at the slowest pace (the fewest possessions per 40 minutes) and take the fewest shots at the rim. They were 13th in points per game.
How the graph was made: Each stat is a category on the y-axis and x is league rank, so nine stats with different units share one scale. There are three scatter traces (everyone else, Atlanta, the Valkyries) so the Valkyries draw on top and the legend comes for free. The horizontal rules are line shapes on layer: "below".
Offense vs defense
Data: Basketball-Reference league stats
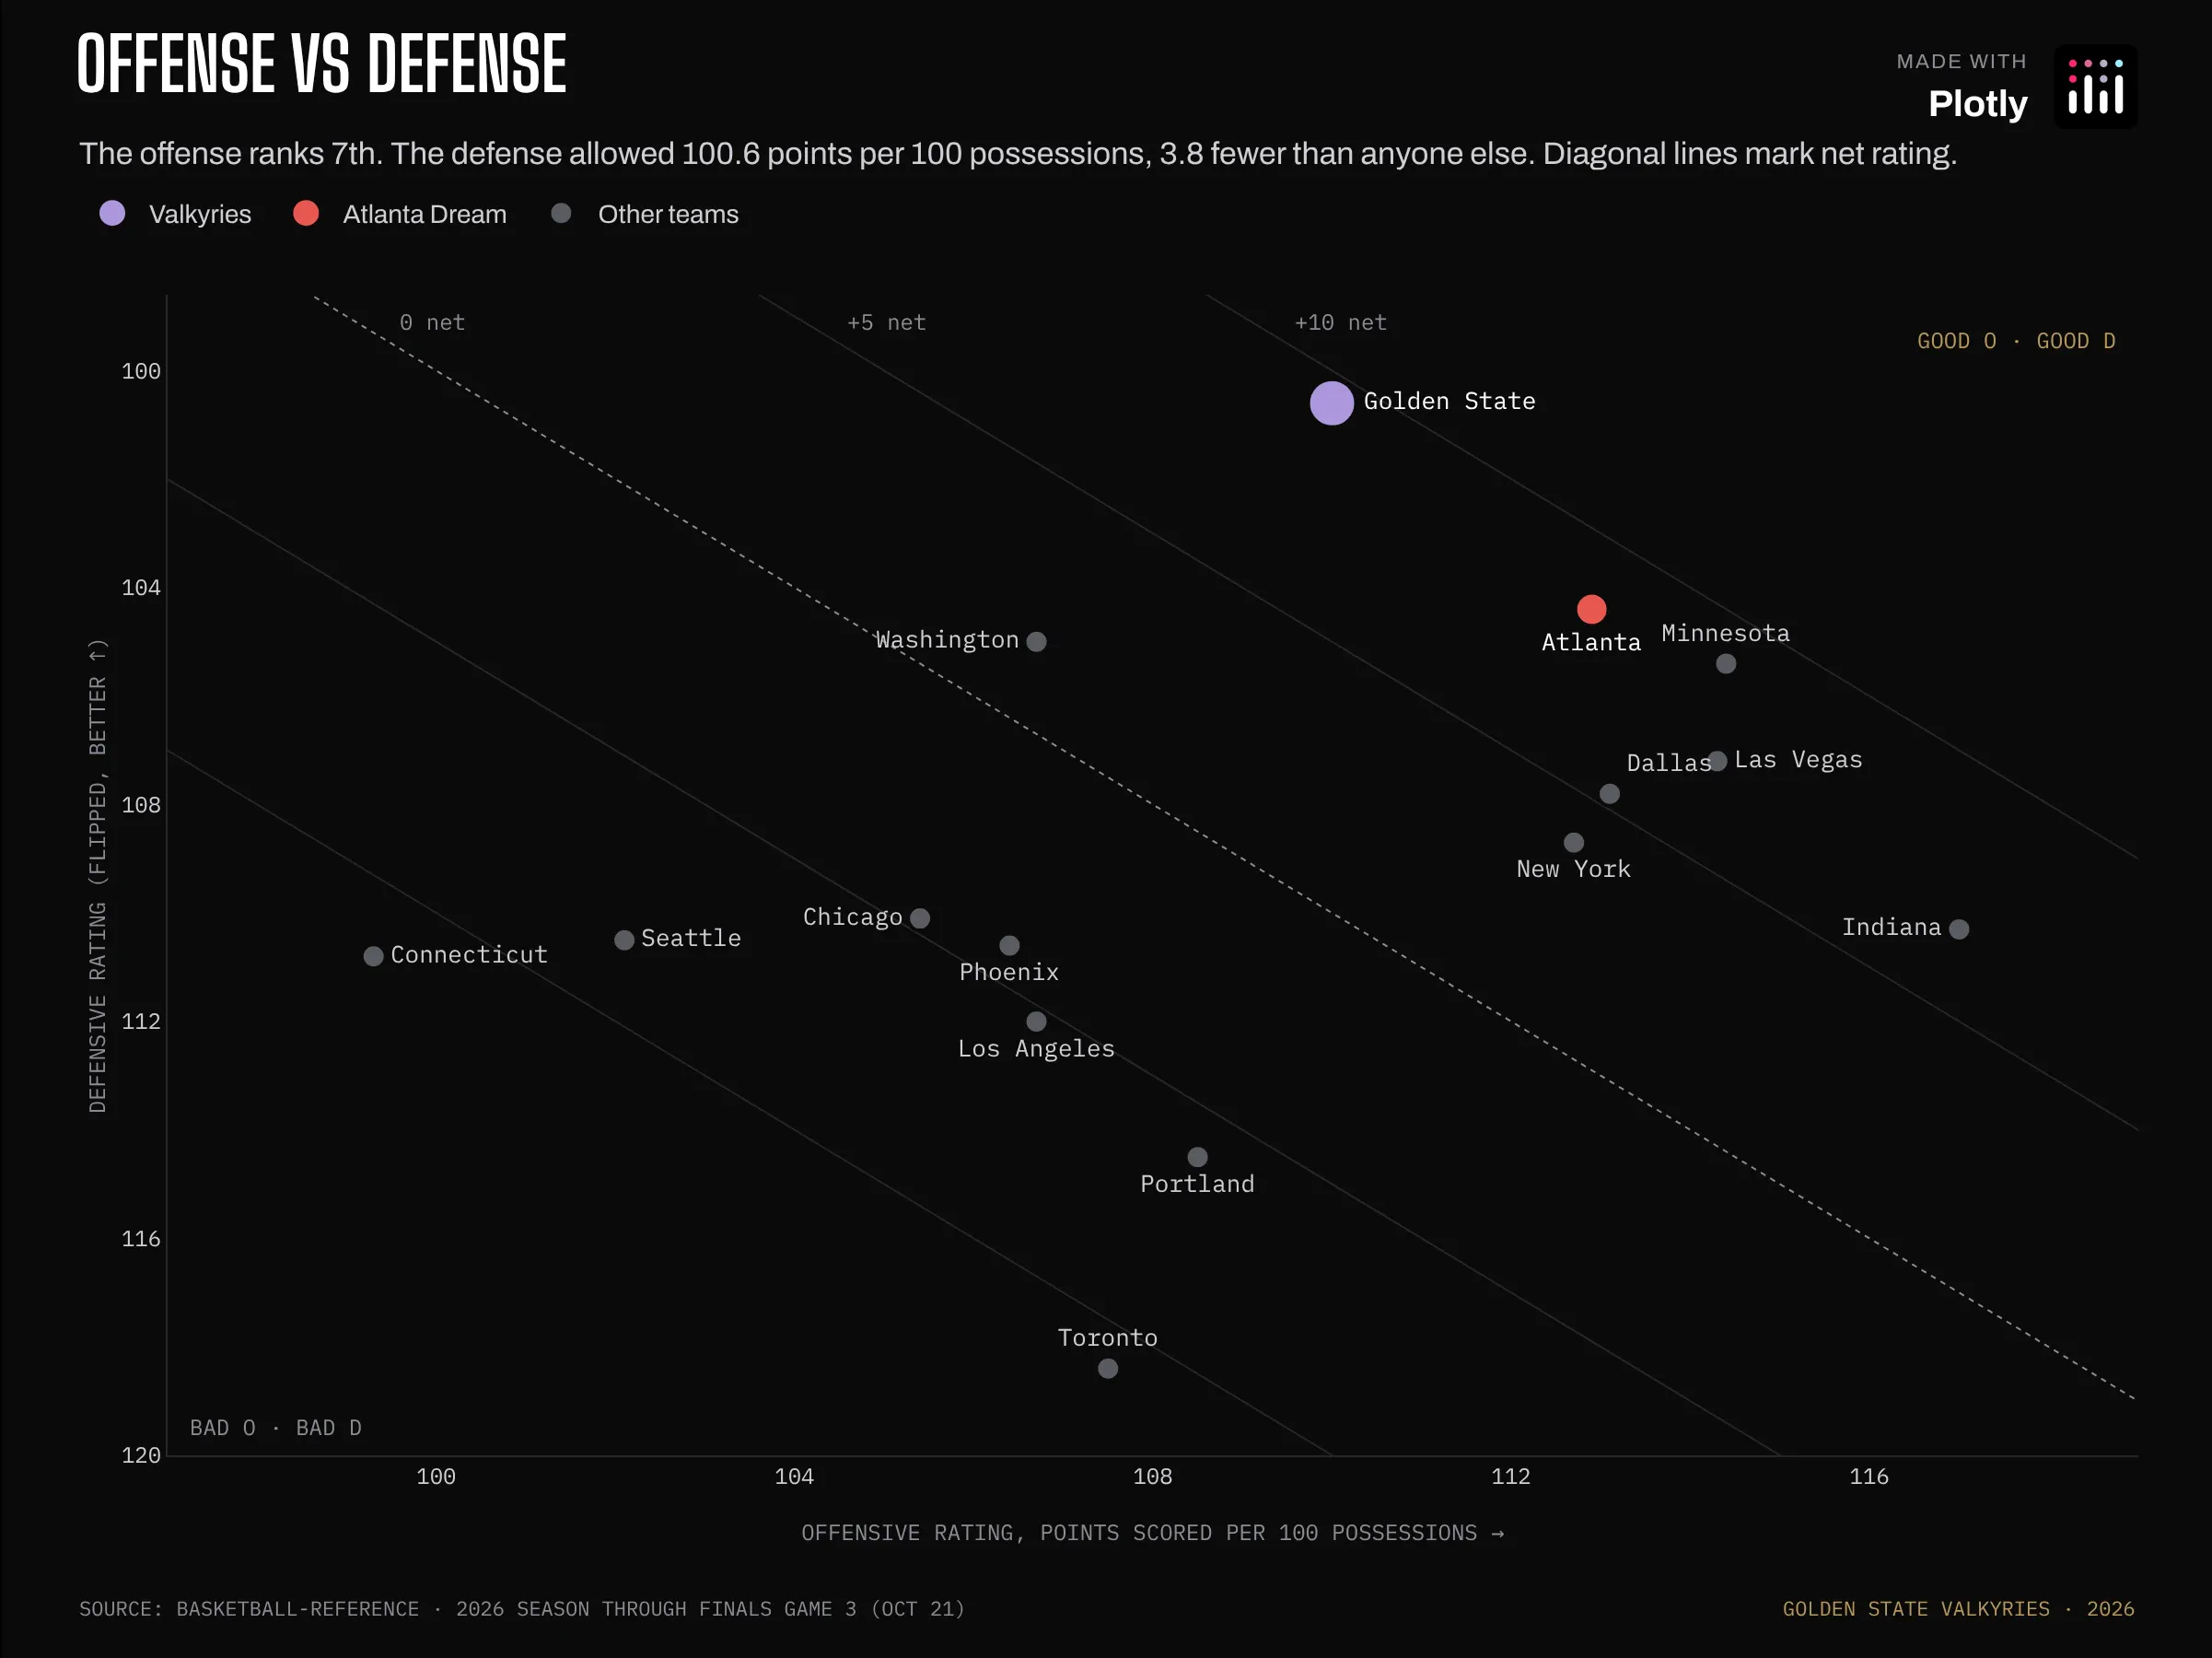
Prompt: Create a Plotly scatter plot of points scored vs allowed per 100 possessions for every team, with the defense axis flipped so better is up, diagonal net-rating guides, and team names in a monospace face.
A 7th-ranked offense with a defense that allowed 3.8 fewer points per 100 possessions than any other team.
How the graph was made: The y-axis range is given high-to-low ([120, 98.6]), which flips it without any data changes. The net-rating guides are line shapes where offense minus defense is constant, drawn under the markers.
Mostly defense
Data: Basketball-Reference
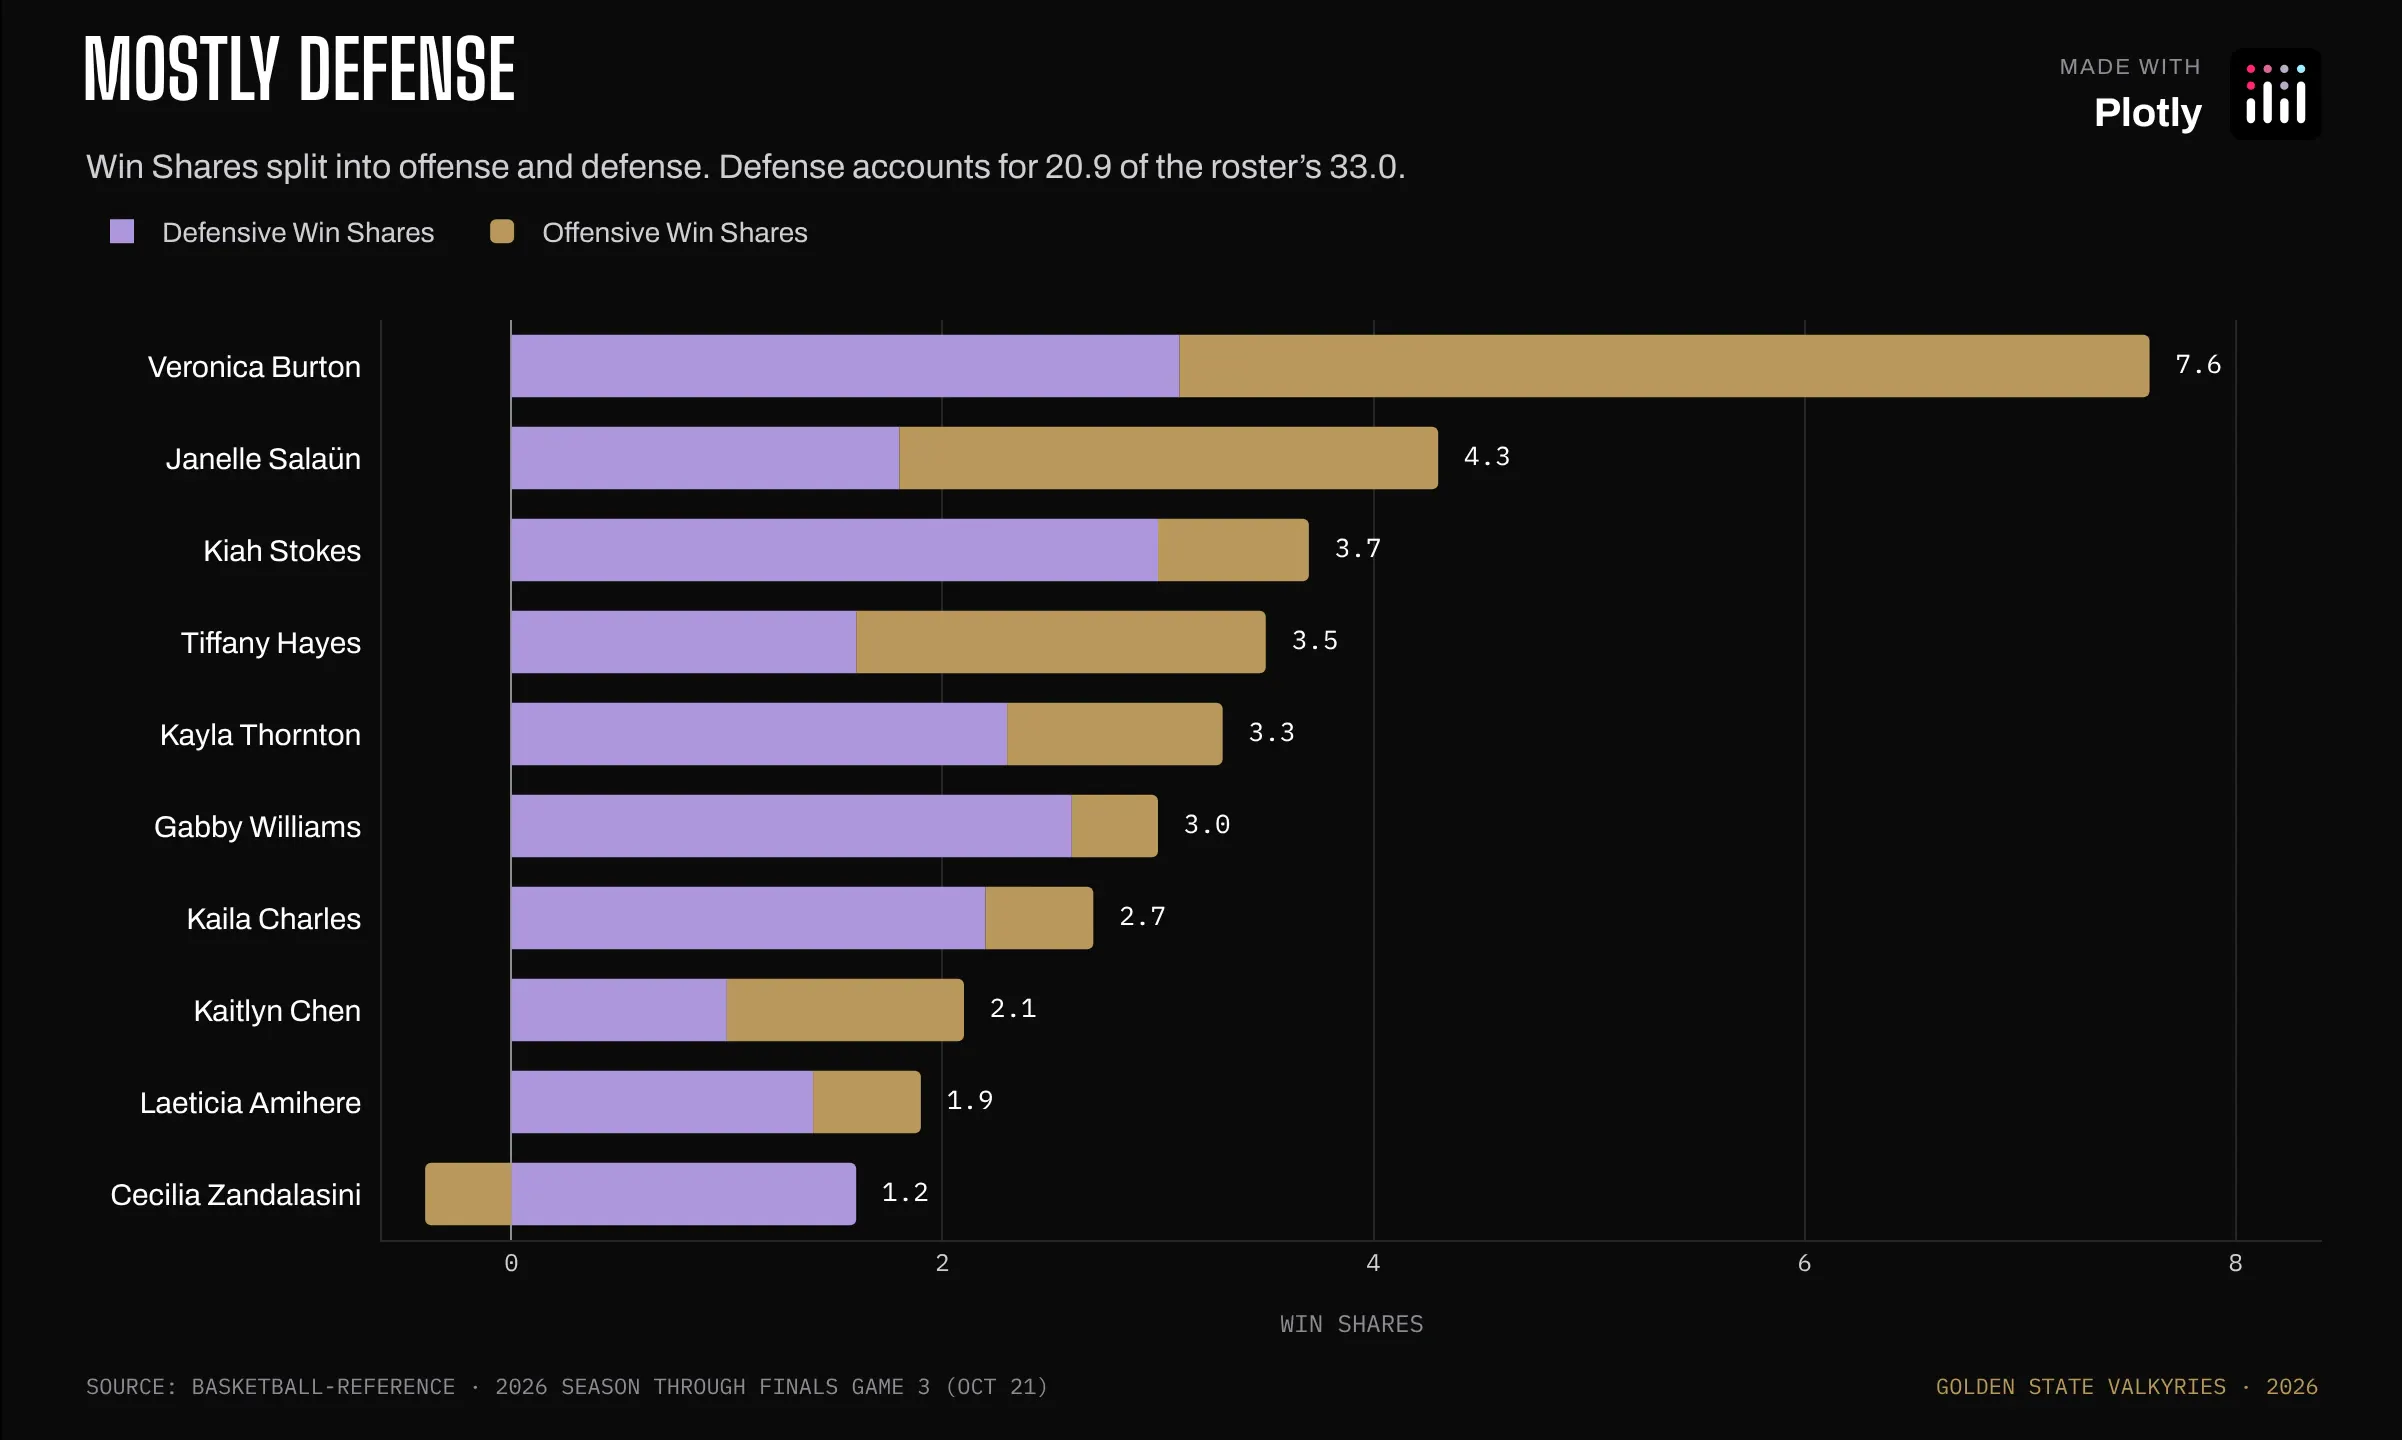
Prompt: Create a Plotly chart of Win Shares split into defense and offense as stacked horizontal bars, letting negative offense hang left of zero, with each player's total printed at the end of her bar.
Win Shares estimate how many of the team's wins each player is responsible for. Defense accounts for 20.9 of the roster's 33.0.
How the graph was made: With barmode: "relative", Cecilia Zandalasini's negative offensive Win Shares (-0.4: her shots and turnovers produced slightly fewer points than the possessions she used were expected to, so the formula credits her offense with a little less than zero wins) stack to the left of zero and her defense to the right. The totals at the end of each bar are a scatter trace with mode: "text".
Where the Valkyries shoot
Data: ESPN play-by-play · Basketball-Reference league stats
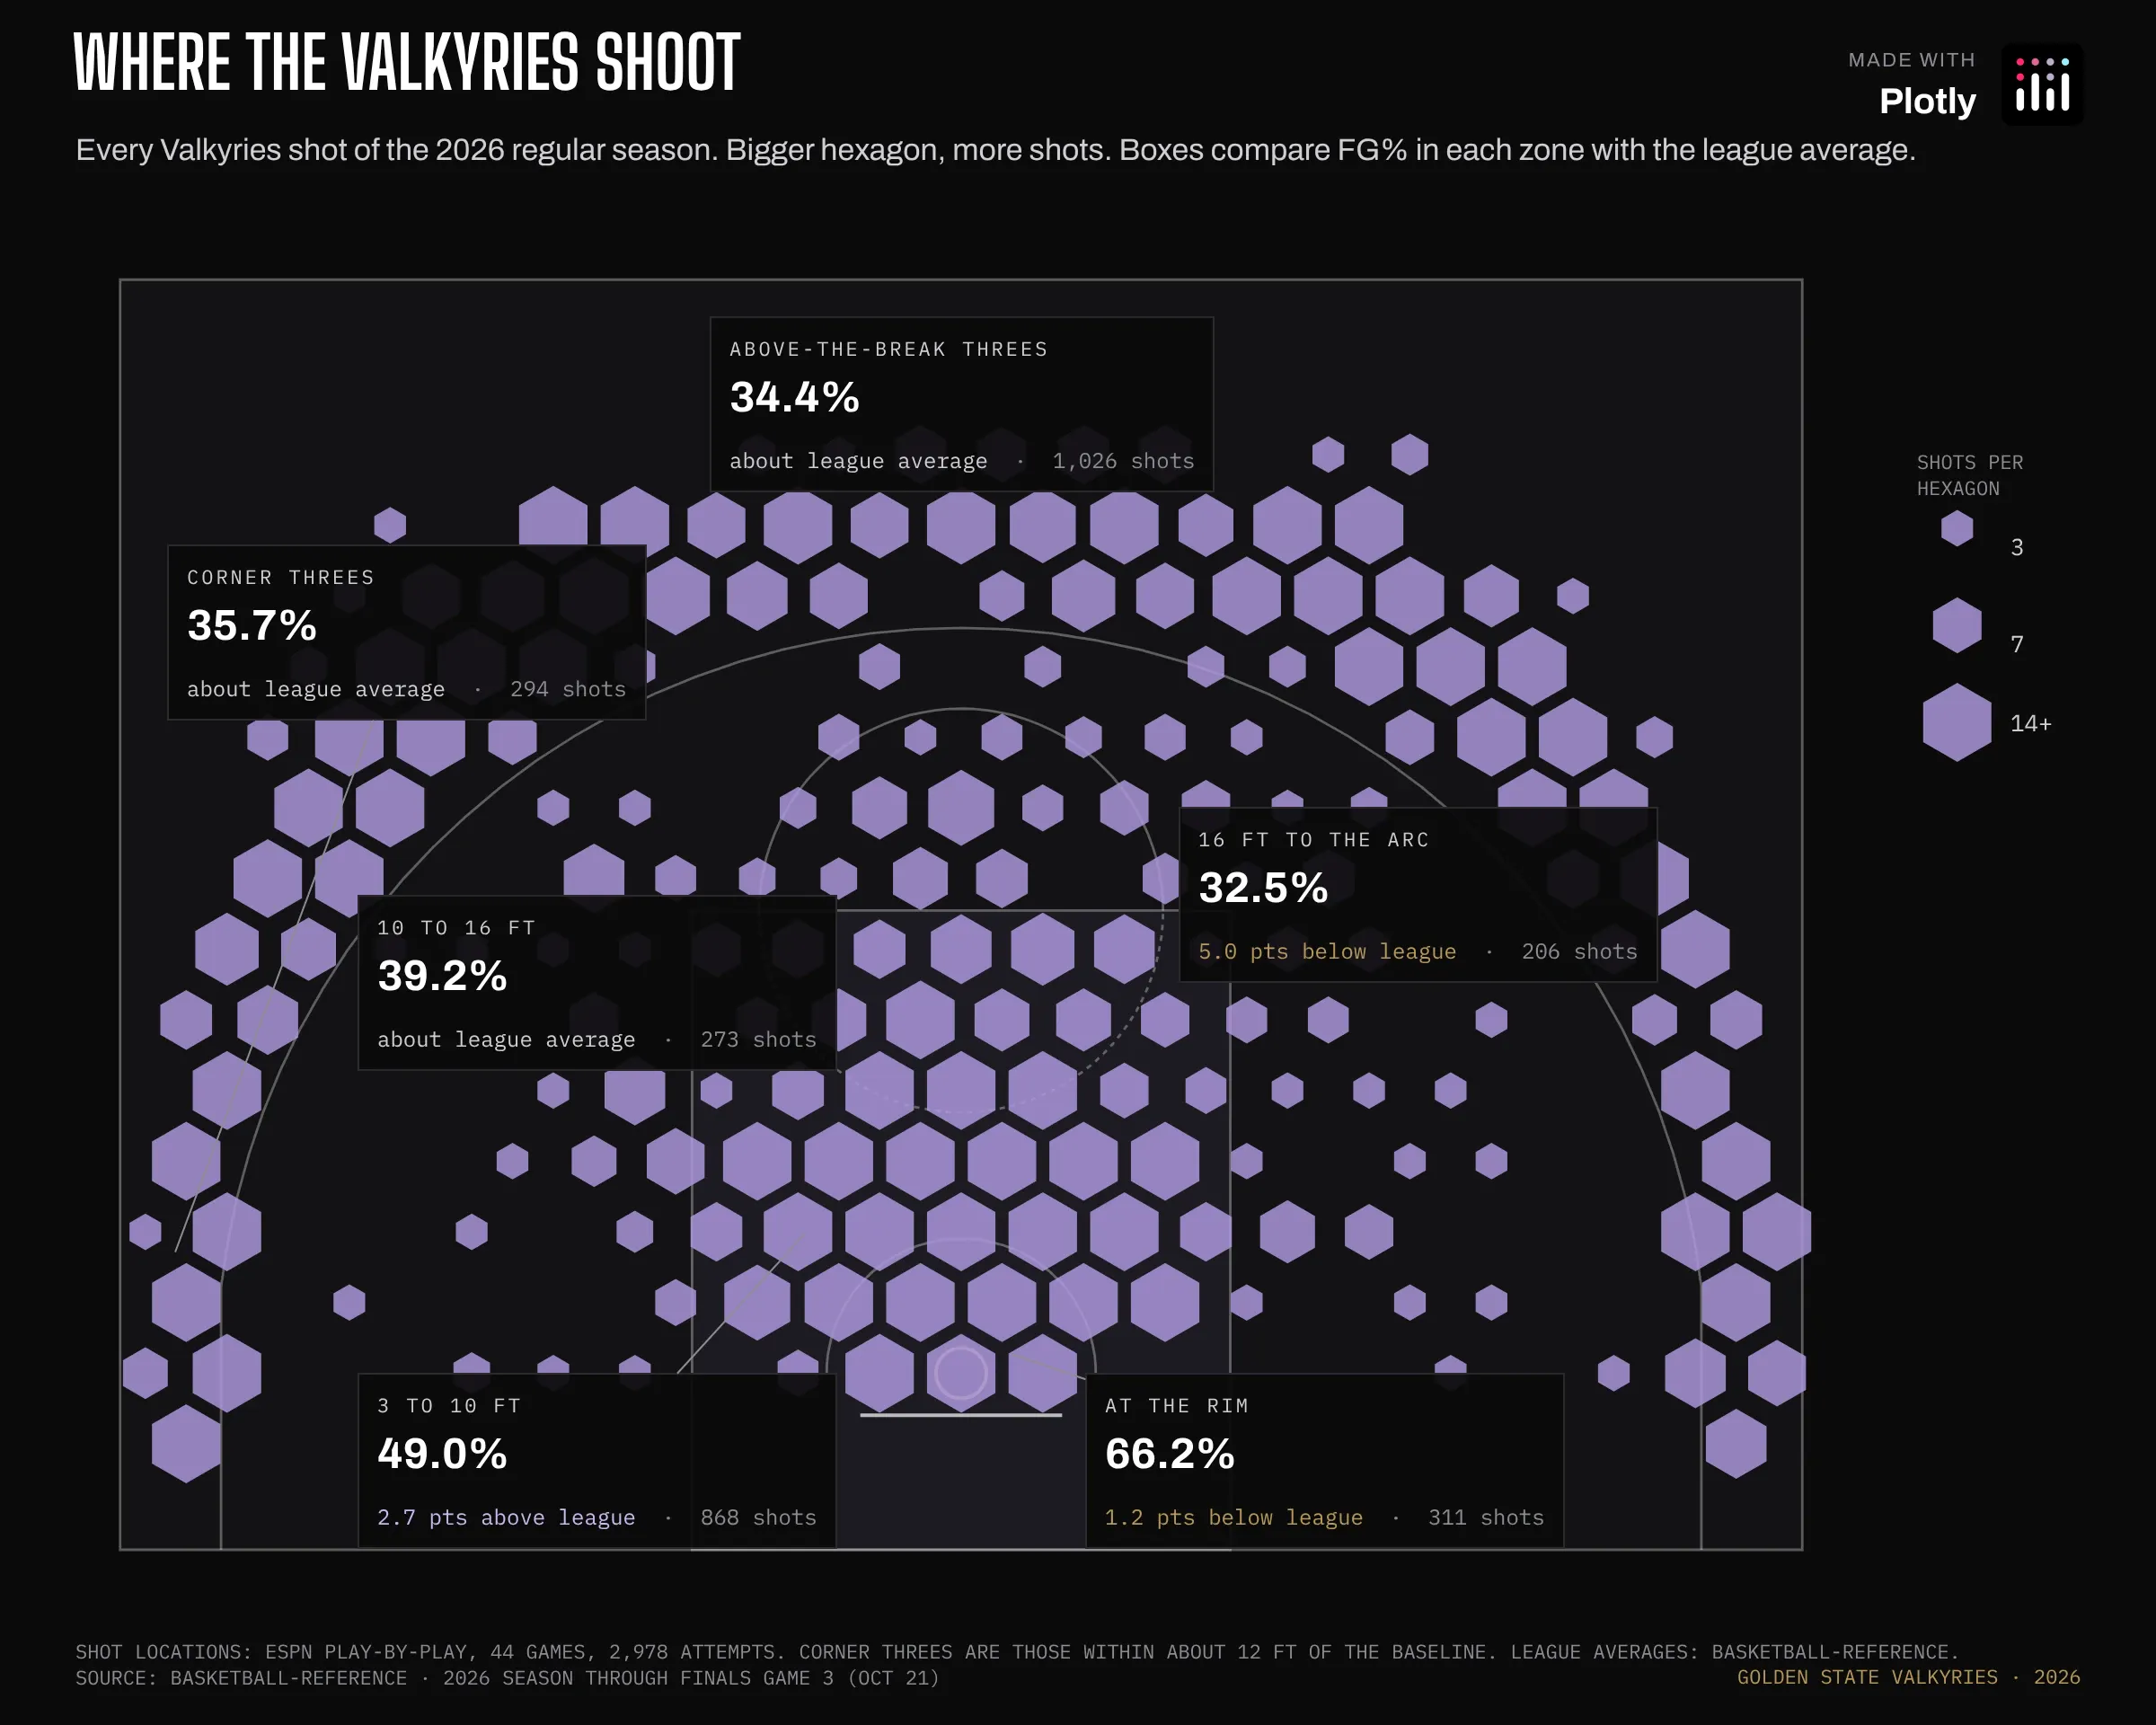
Prompt: Create a Plotly shot chart on a half court drawn from shapes, binning every shot into hexagons sized by volume, with six zone boxes comparing FG% to the league average and a size key in the margin.
The color is the same everywhere on purpose. Size is shot volume, and the boxes carry the efficiency: FG% (field goal percentage, the share of shots that go in) in each zone against the league average. 1,320 of their 2,978 shots were threes.
How the graph was made: Plotly doesn't have a hexbin trace, so every shot is assigned to the nearest center on a hexagonal grid about 2.4 ft across, and each bin becomes one scatter marker with symbol: "hexagon". The court is a handful of layout.shapes. Path shapes don't take the SVG arc command, so the three-point line and the circles are built from short line segments, and scaleanchor keeps a foot the same length in x and y. The size key in the margin is path shapes with xsizemode: "pixel", anchored in paper coordinates.
Where opponents shot against them
Data: ESPN play-by-play · Basketball-Reference league stats
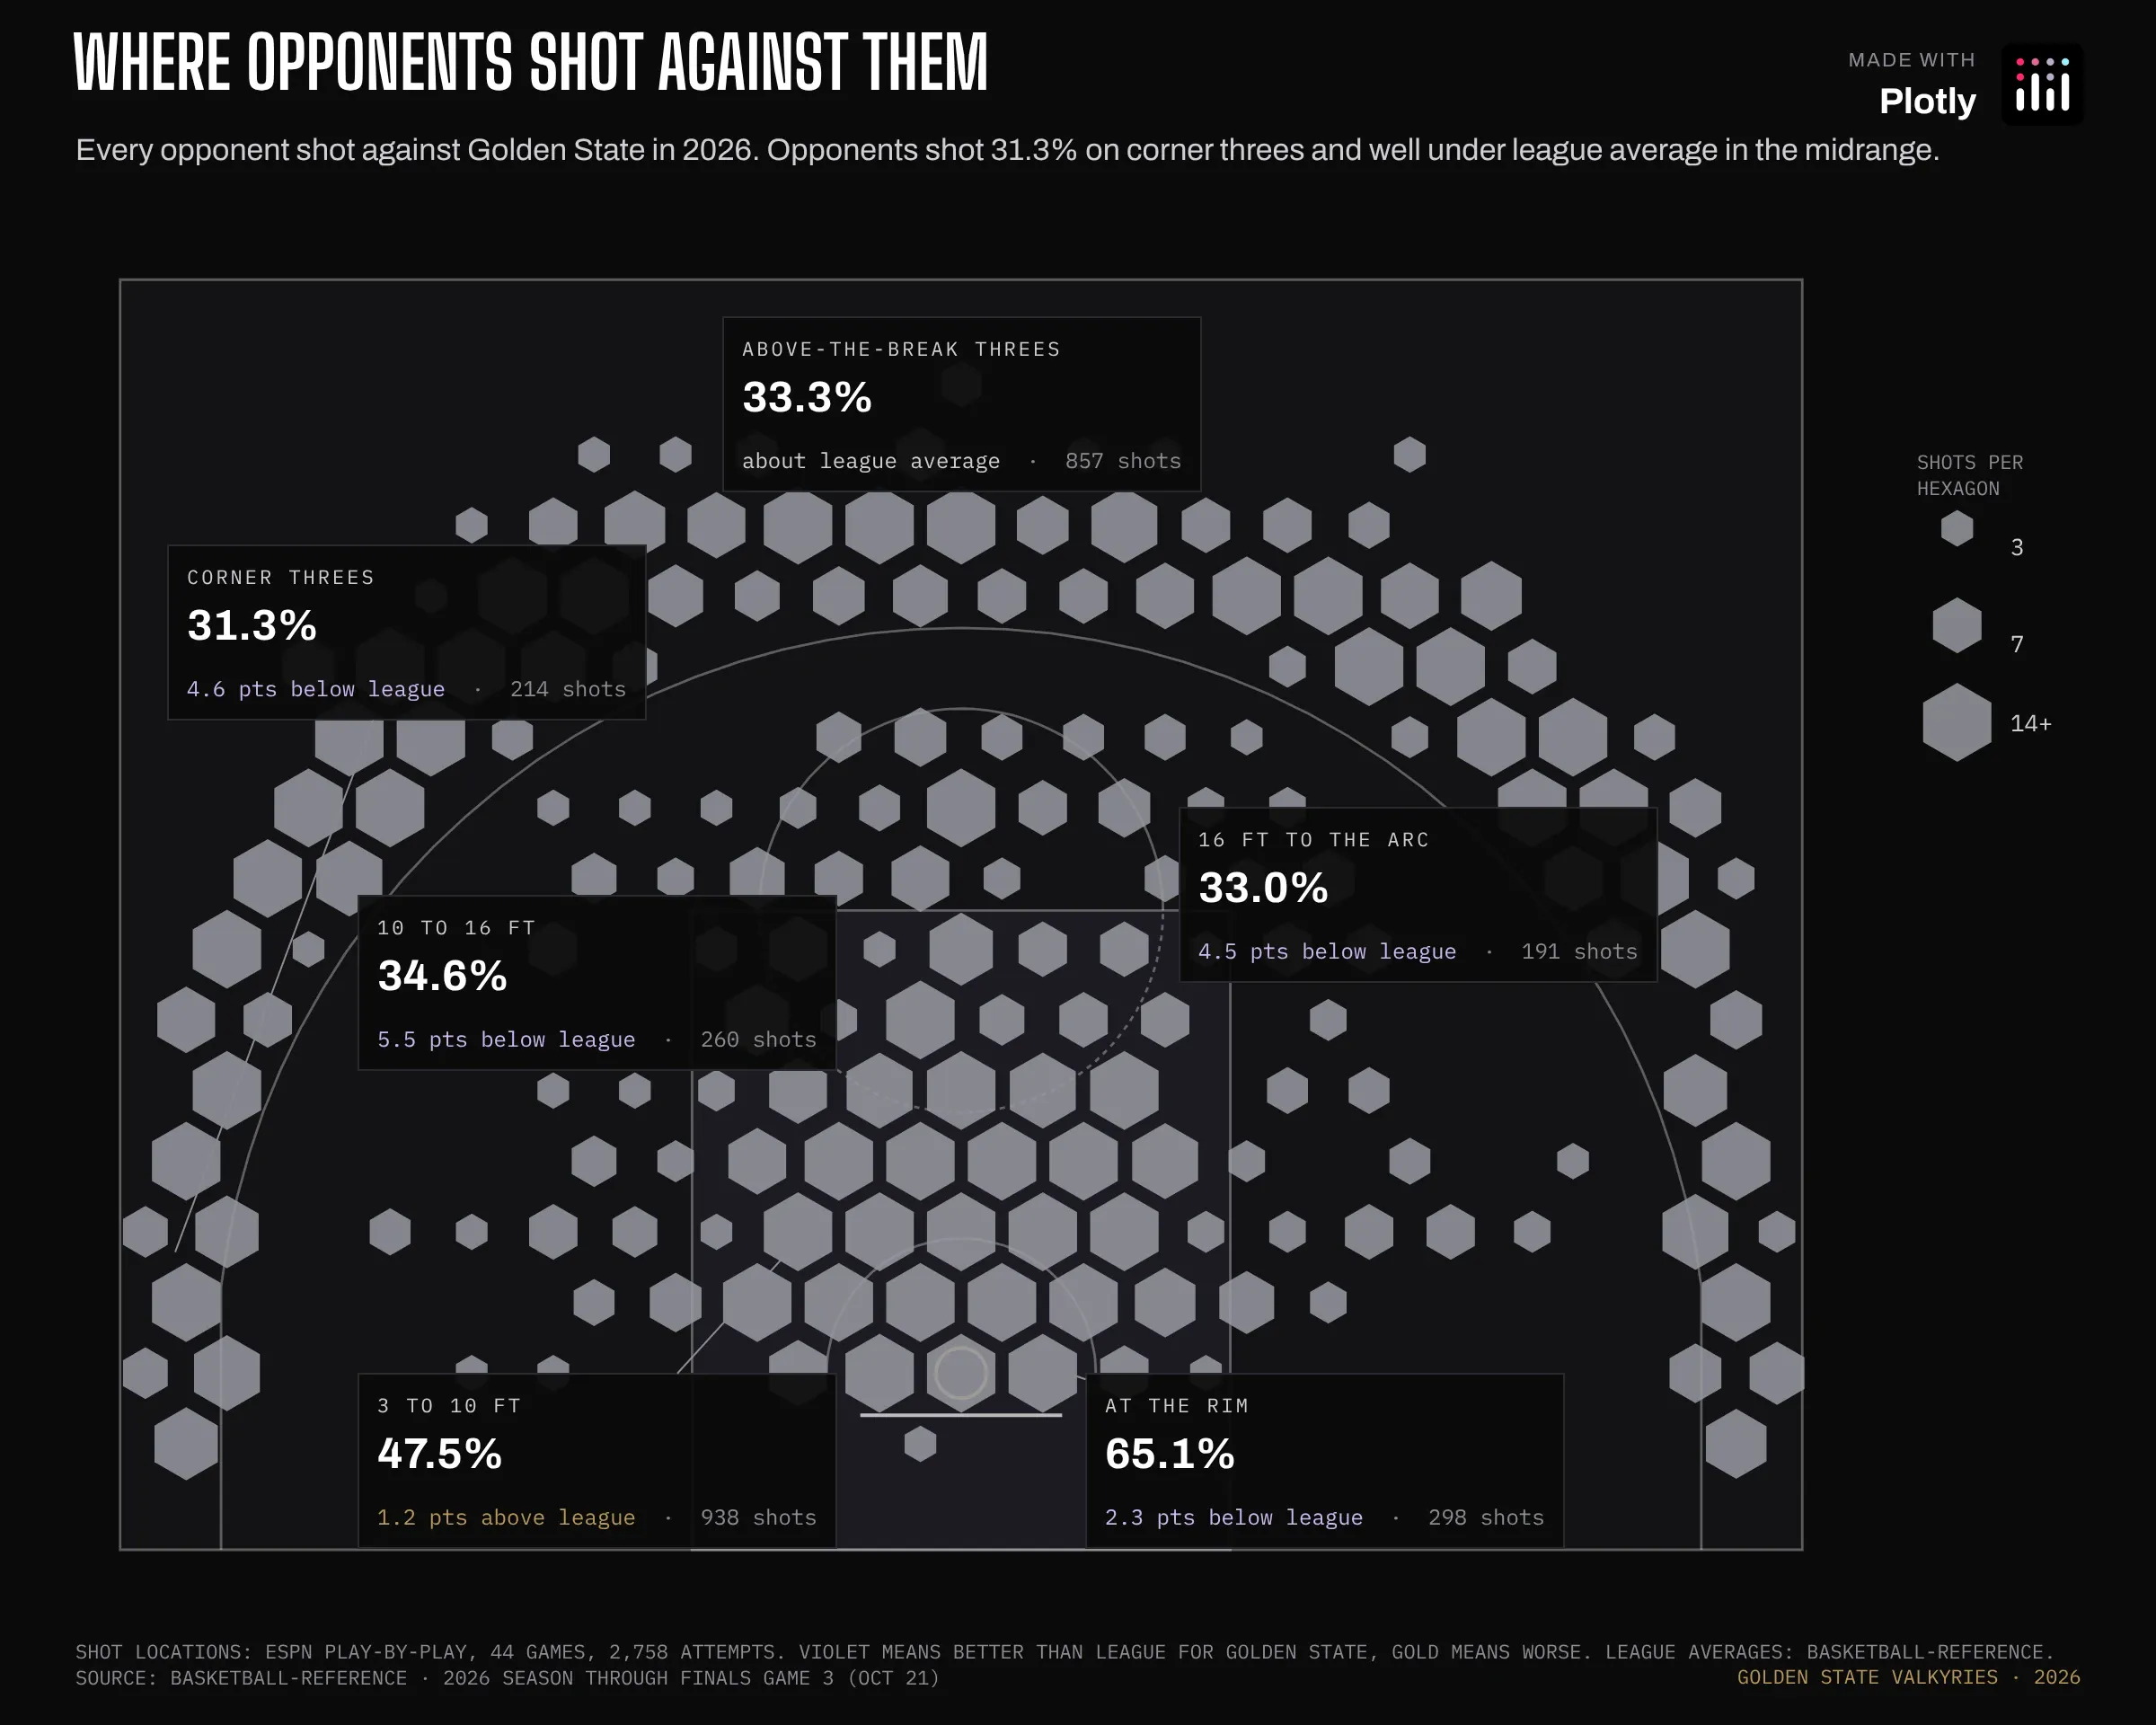
Prompt: Create the same hexagon shot chart for every opponent shot against the Valkyries, with zone boxes that say in words whether opponents shot better or worse than league average.
Opponents shot 31.3% on corner threes against Golden State (league 35.9%), and 4 to 5 percentage points worse than league in the midrange (two-point shots from about 10 feet out to the three-point line).
How the graph was made: Same function, different input. The only changes are the hexagon color and which direction counts as good in the zone boxes.
Lots of threes, few layups
Data: Basketball-Reference
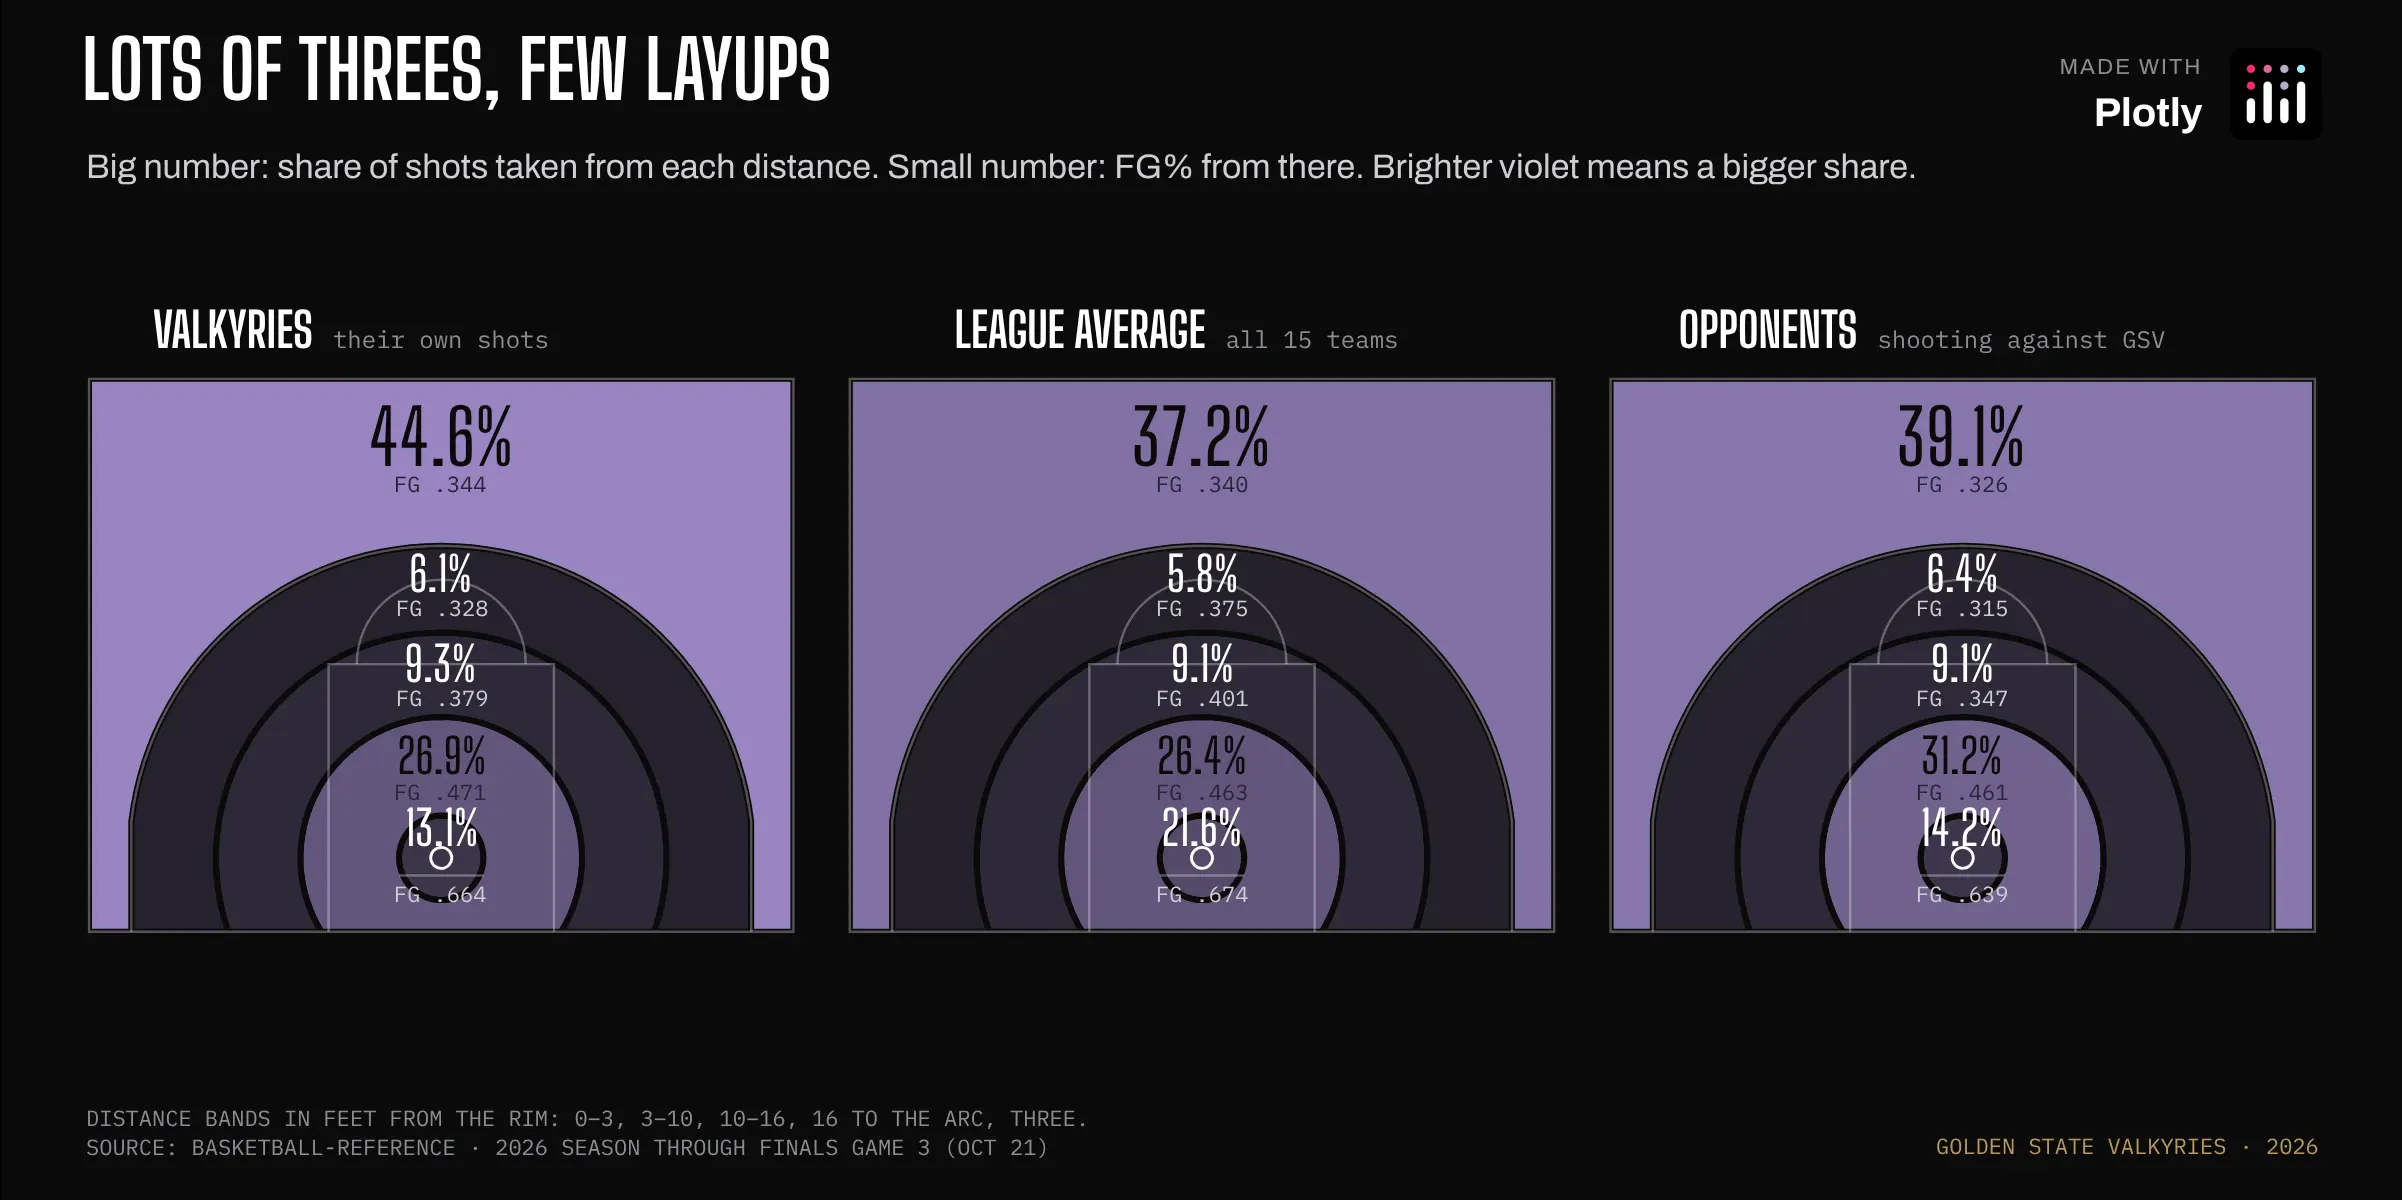
Prompt: Create a Plotly figure with three half courts side by side, each split into five distance bands drawn as filled path shapes and shaded by share of shots.
Golden State takes 44.6% of its shots from three (league 37.2%) and 13.1% at the rim (within 3 feet of the basket; league 21.6%).
How the graph was made: Each distance band is a closed path shape. The 3–10 ft band is an annulus: an outer and an inner circle in one path with fillrule: "evenodd", which punches out the middle. The three panels share one coordinate system, offset 54 ft apart.
Where each player shoots
Data: Basketball-Reference
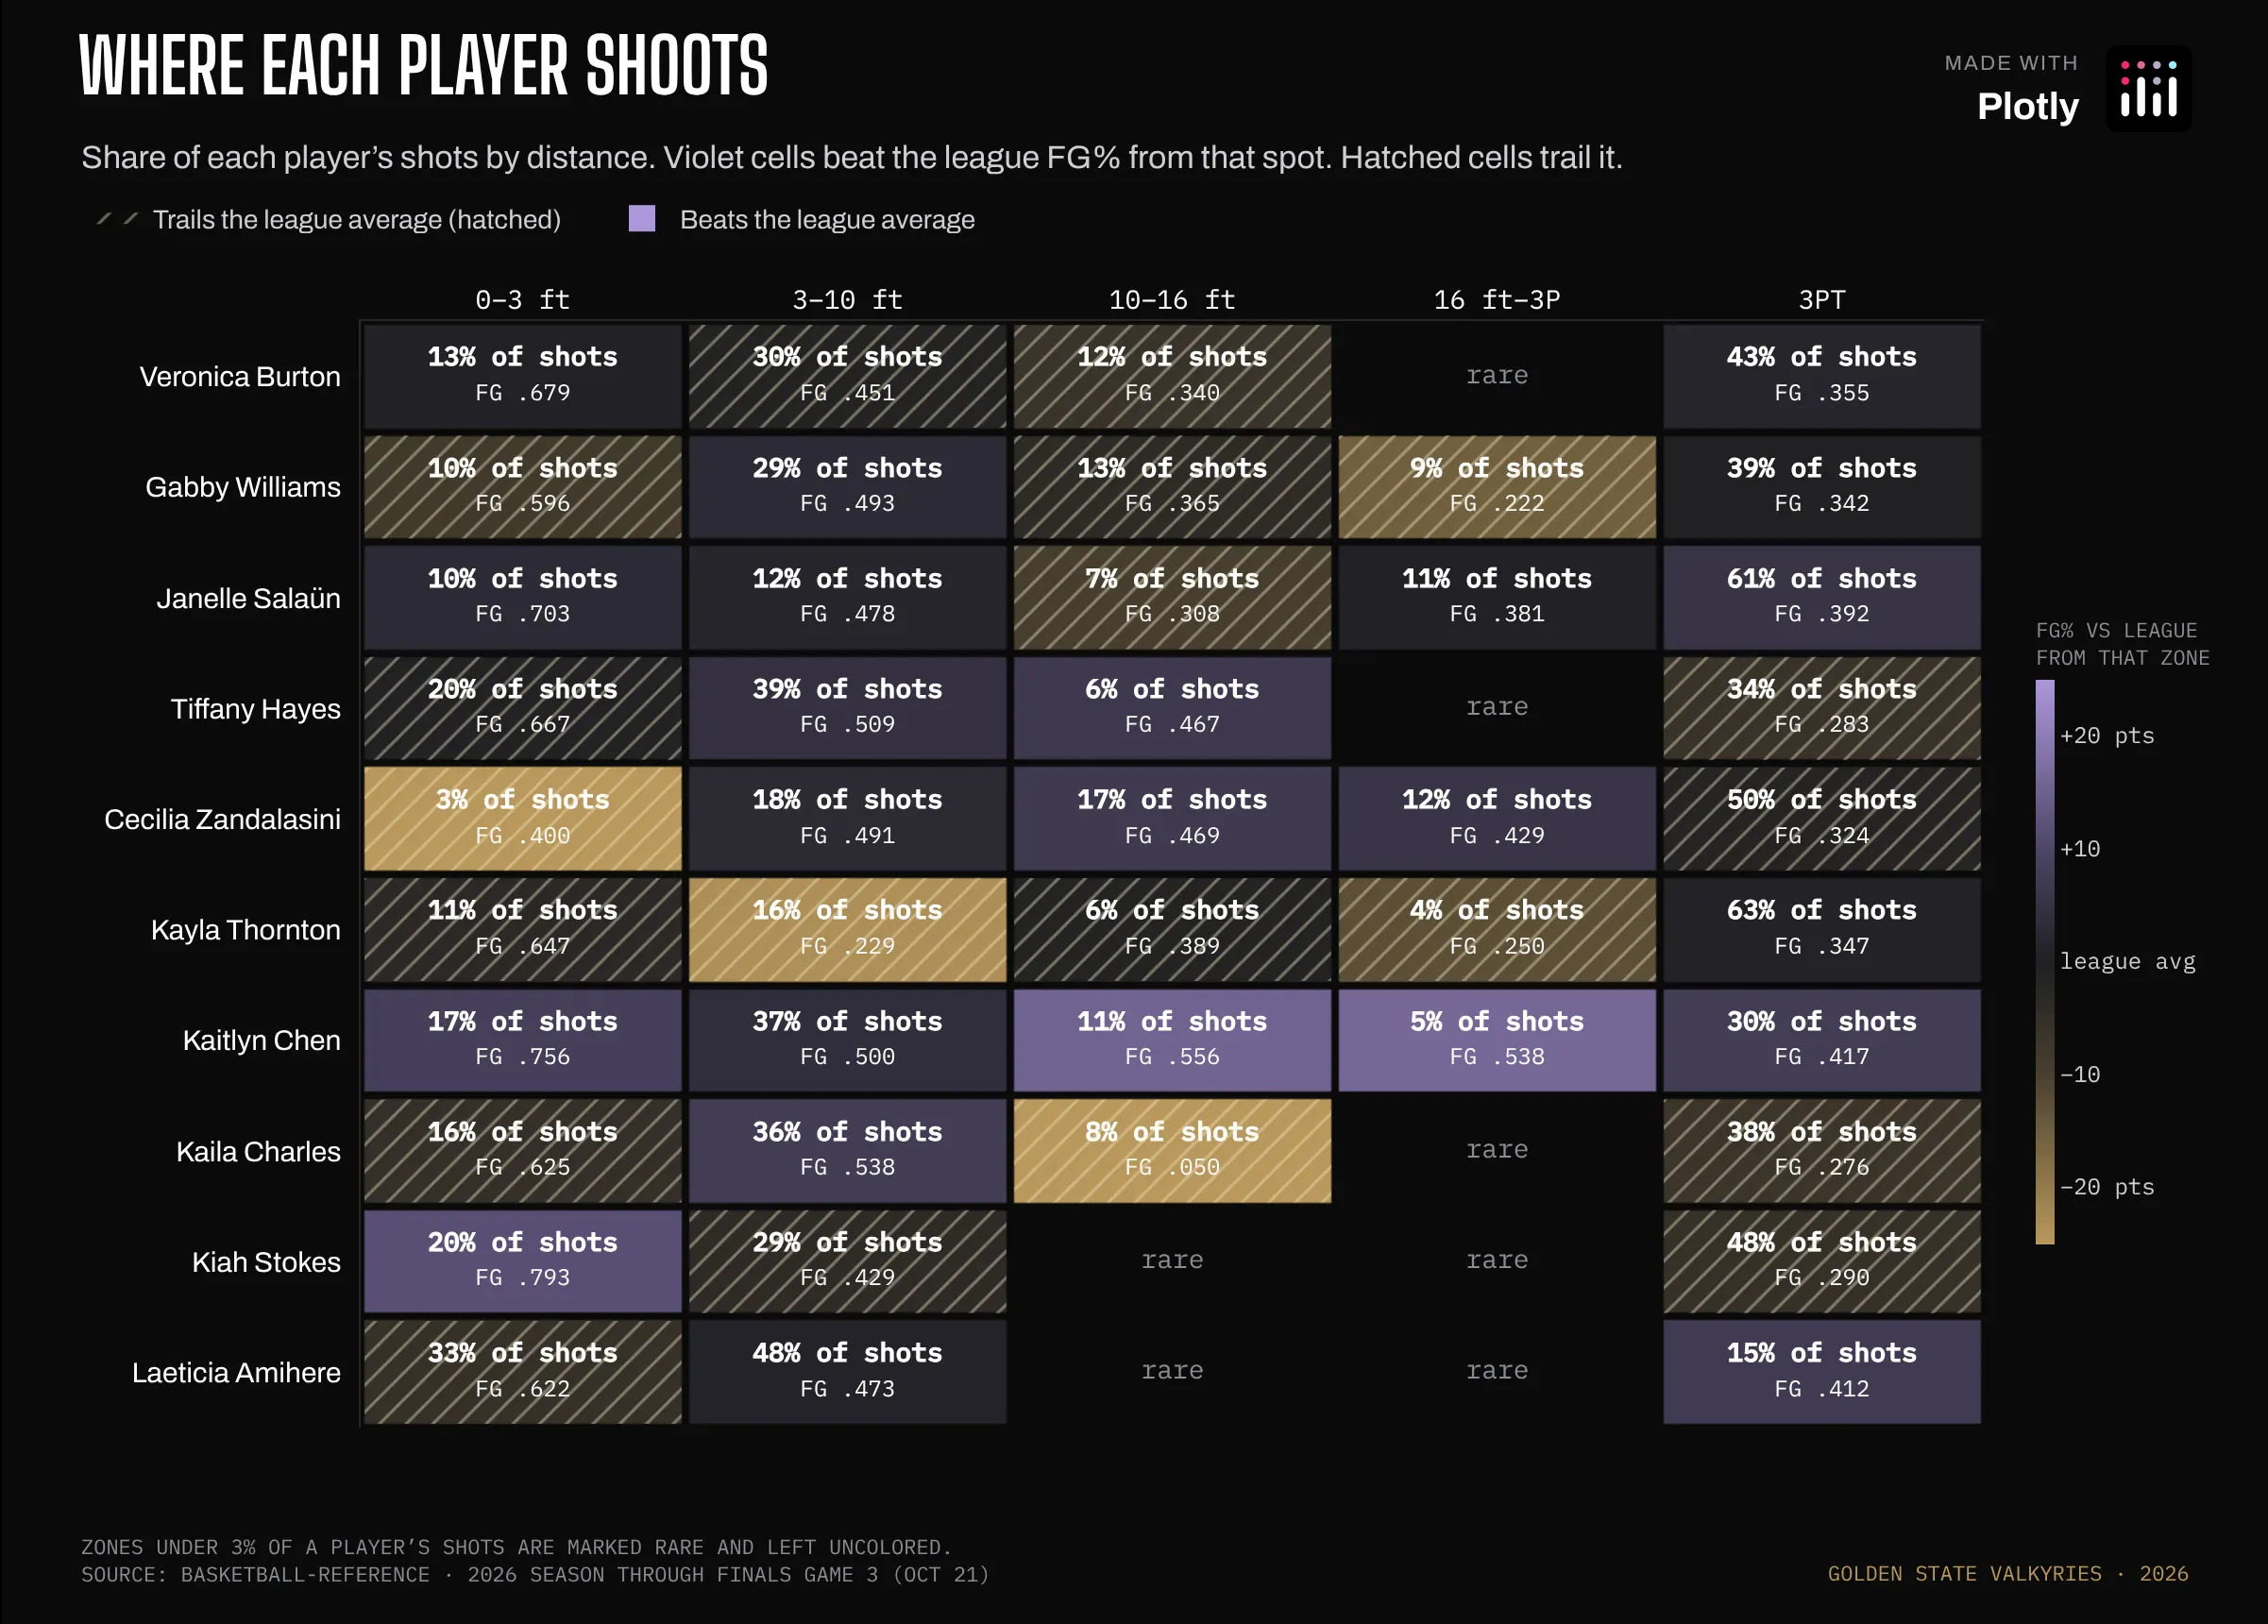
Prompt: Create a Plotly heatmap of each player's shot share and FG% by distance, colored against the league average from that spot, with hatching over every cell that trails the league and rare zones left blank.
Kaitlyn Chen shot better than the league average from all five distances, including 41.7% on threes against a league average of 34.0%. It's a small sample, though: about 240 shots all season, and only about a dozen of them long twos (two-point shots from 16 feet out to the three-point line). A few misses either way would move those cells a lot.
How the graph was made: It's a single heatmap trace with texttemplate for the two-line cell labels and xgap/ygap for the gutters. Zones under 3% of a player's shots are set to null, so they stay empty and don't get colored on a handful of attempts. Heatmaps can't take a pattern fill, so the hatching sits on a second, hidden pair of axes laid over the heatmap: one scatter polygon per below-league cell, filled with fillpattern set to diagonal lines.
Every shot, player by player
Data: ESPN play-by-play
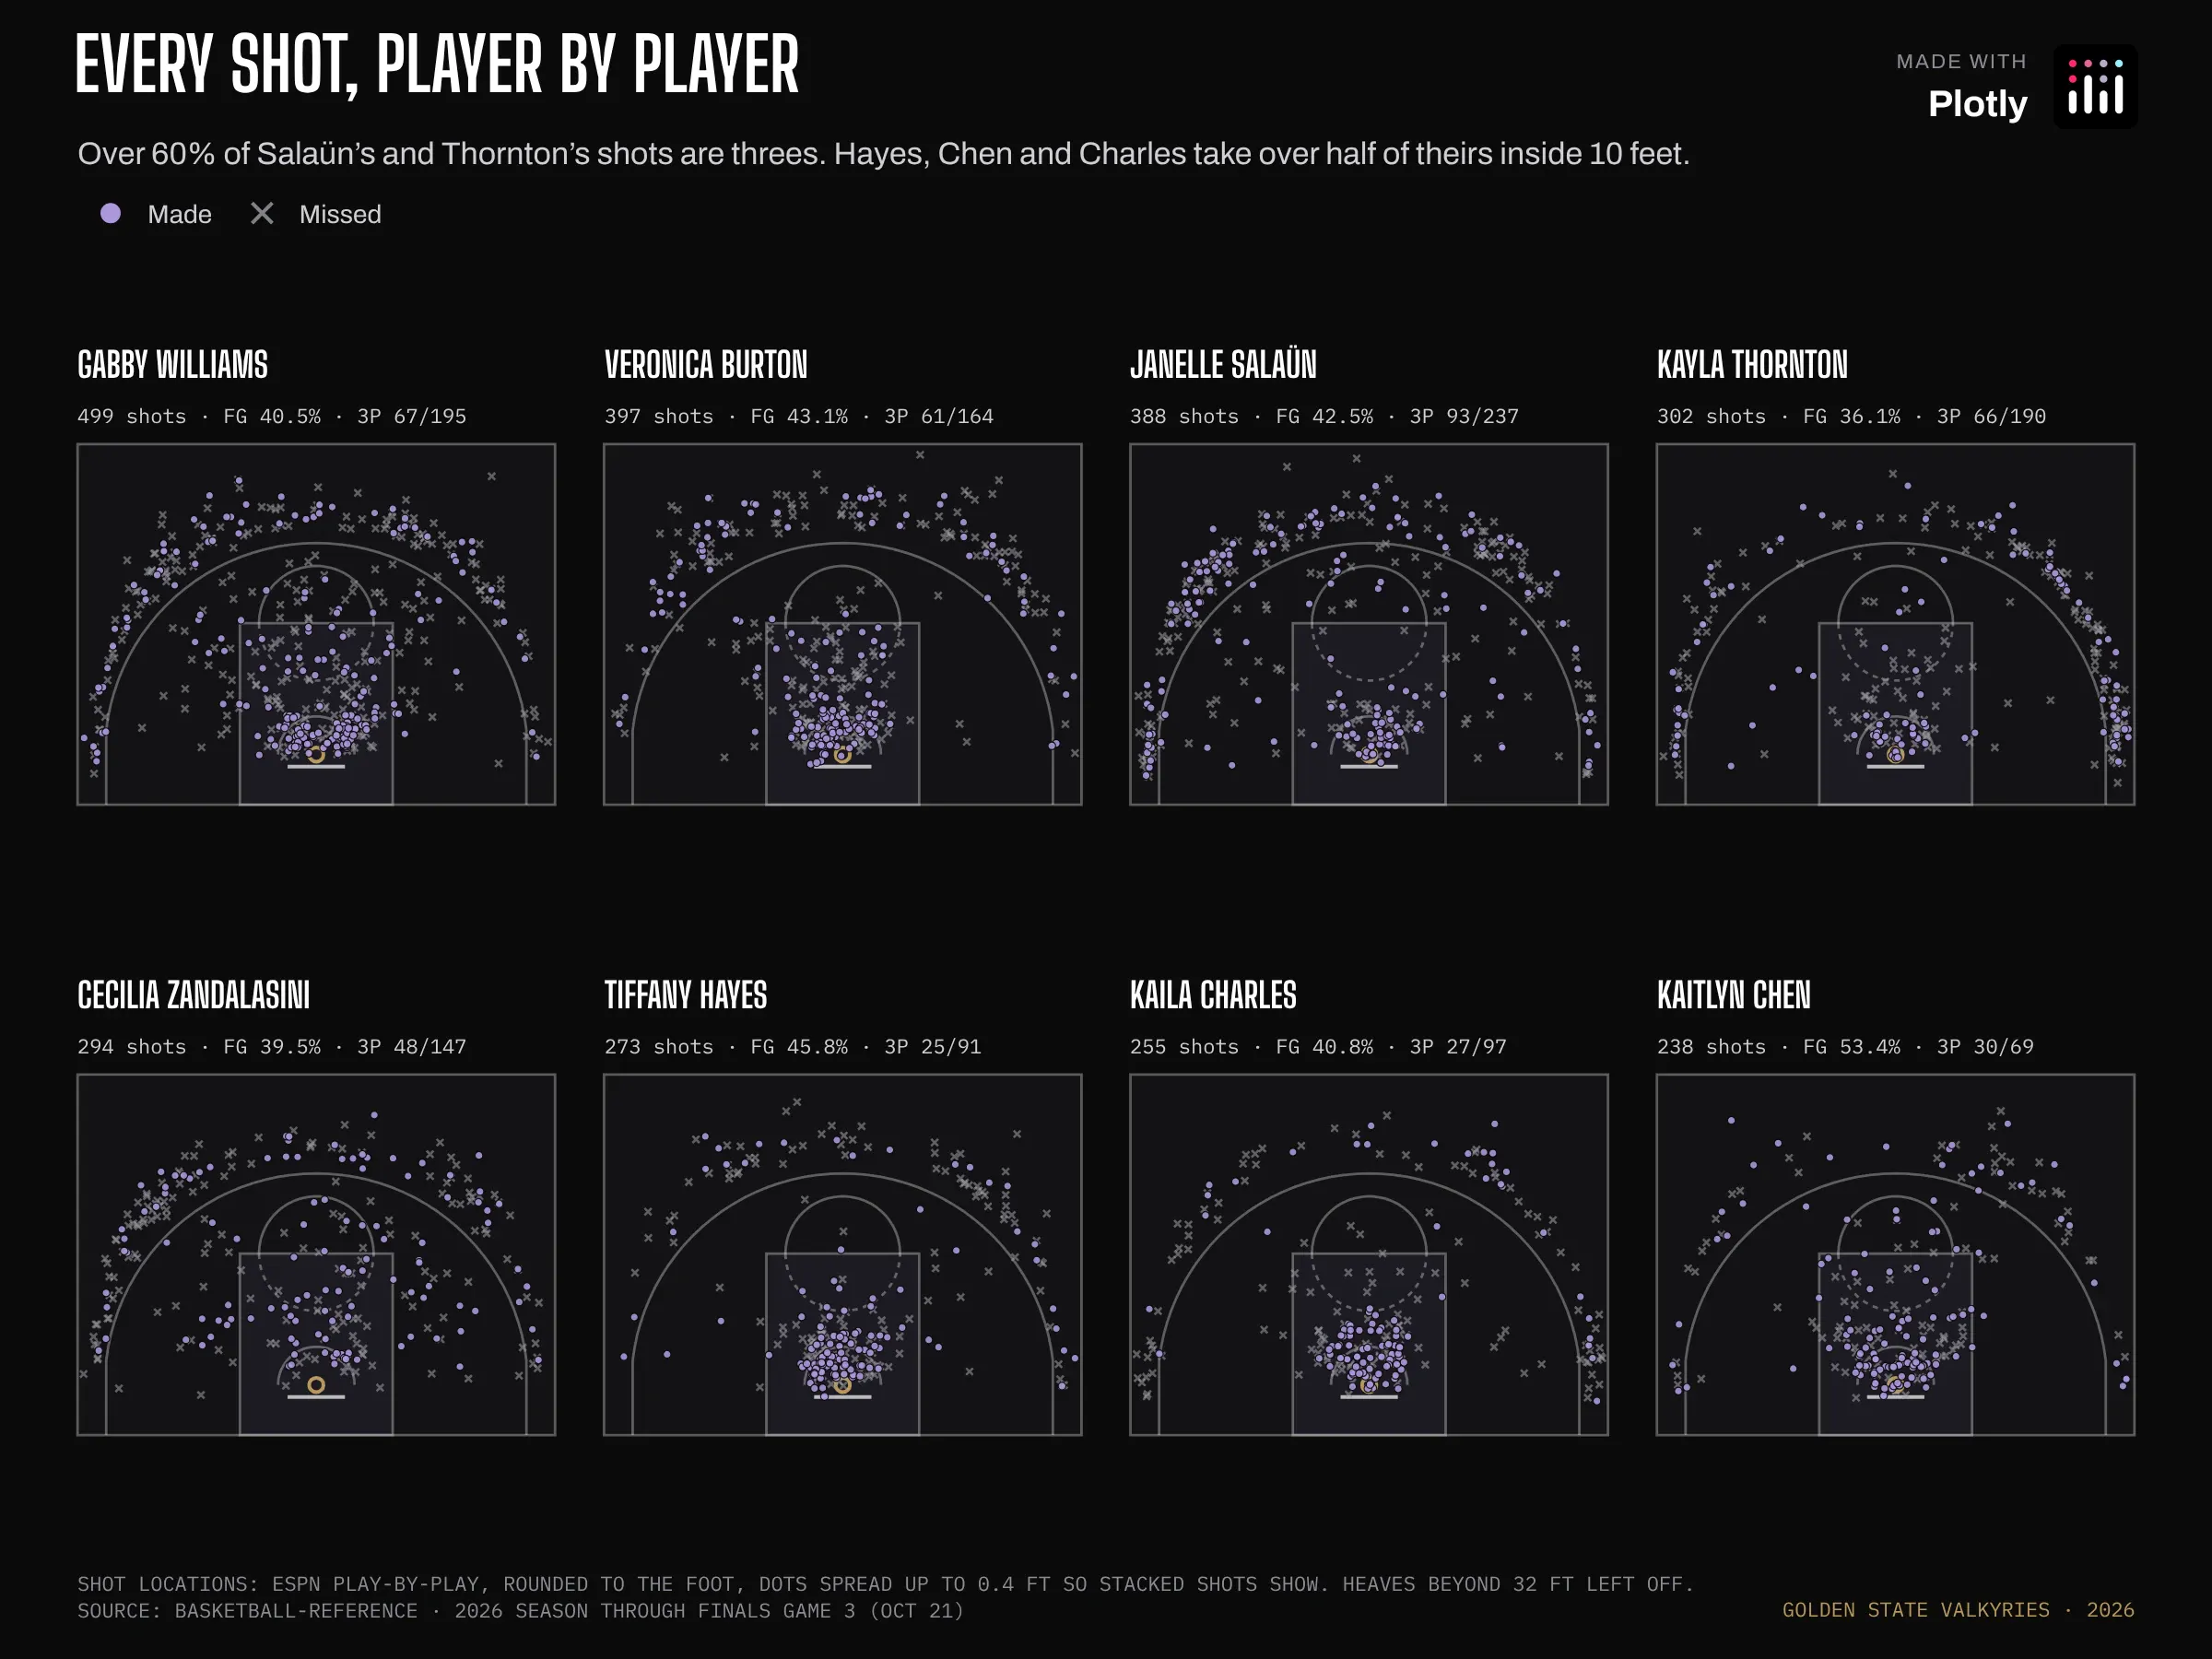
Prompt: Create a Plotly grid of eight half courts, one per player, with makes as dots and misses as thin x's, each court kept to scale.
Over 60% of Janelle Salaün's and Kayla Thornton's shots are threes. Tiffany Hayes, Kaitlyn Chen and Kaila Charles take more than half of theirs inside 10 feet.
How the graph was made: Each court is its own pair of axes, laid out with domain, and every pair has scaleanchor set so the courts stay to scale. ESPN rounds shot locations to the nearest foot, so each dot is nudged by up to 0.4 ft to stop shots from stacking on a grid. Misses use symbol: "x-thin", which only shows a stroke, so they recede behind the makes.
Scoring spread evenly
Data: Basketball-Reference
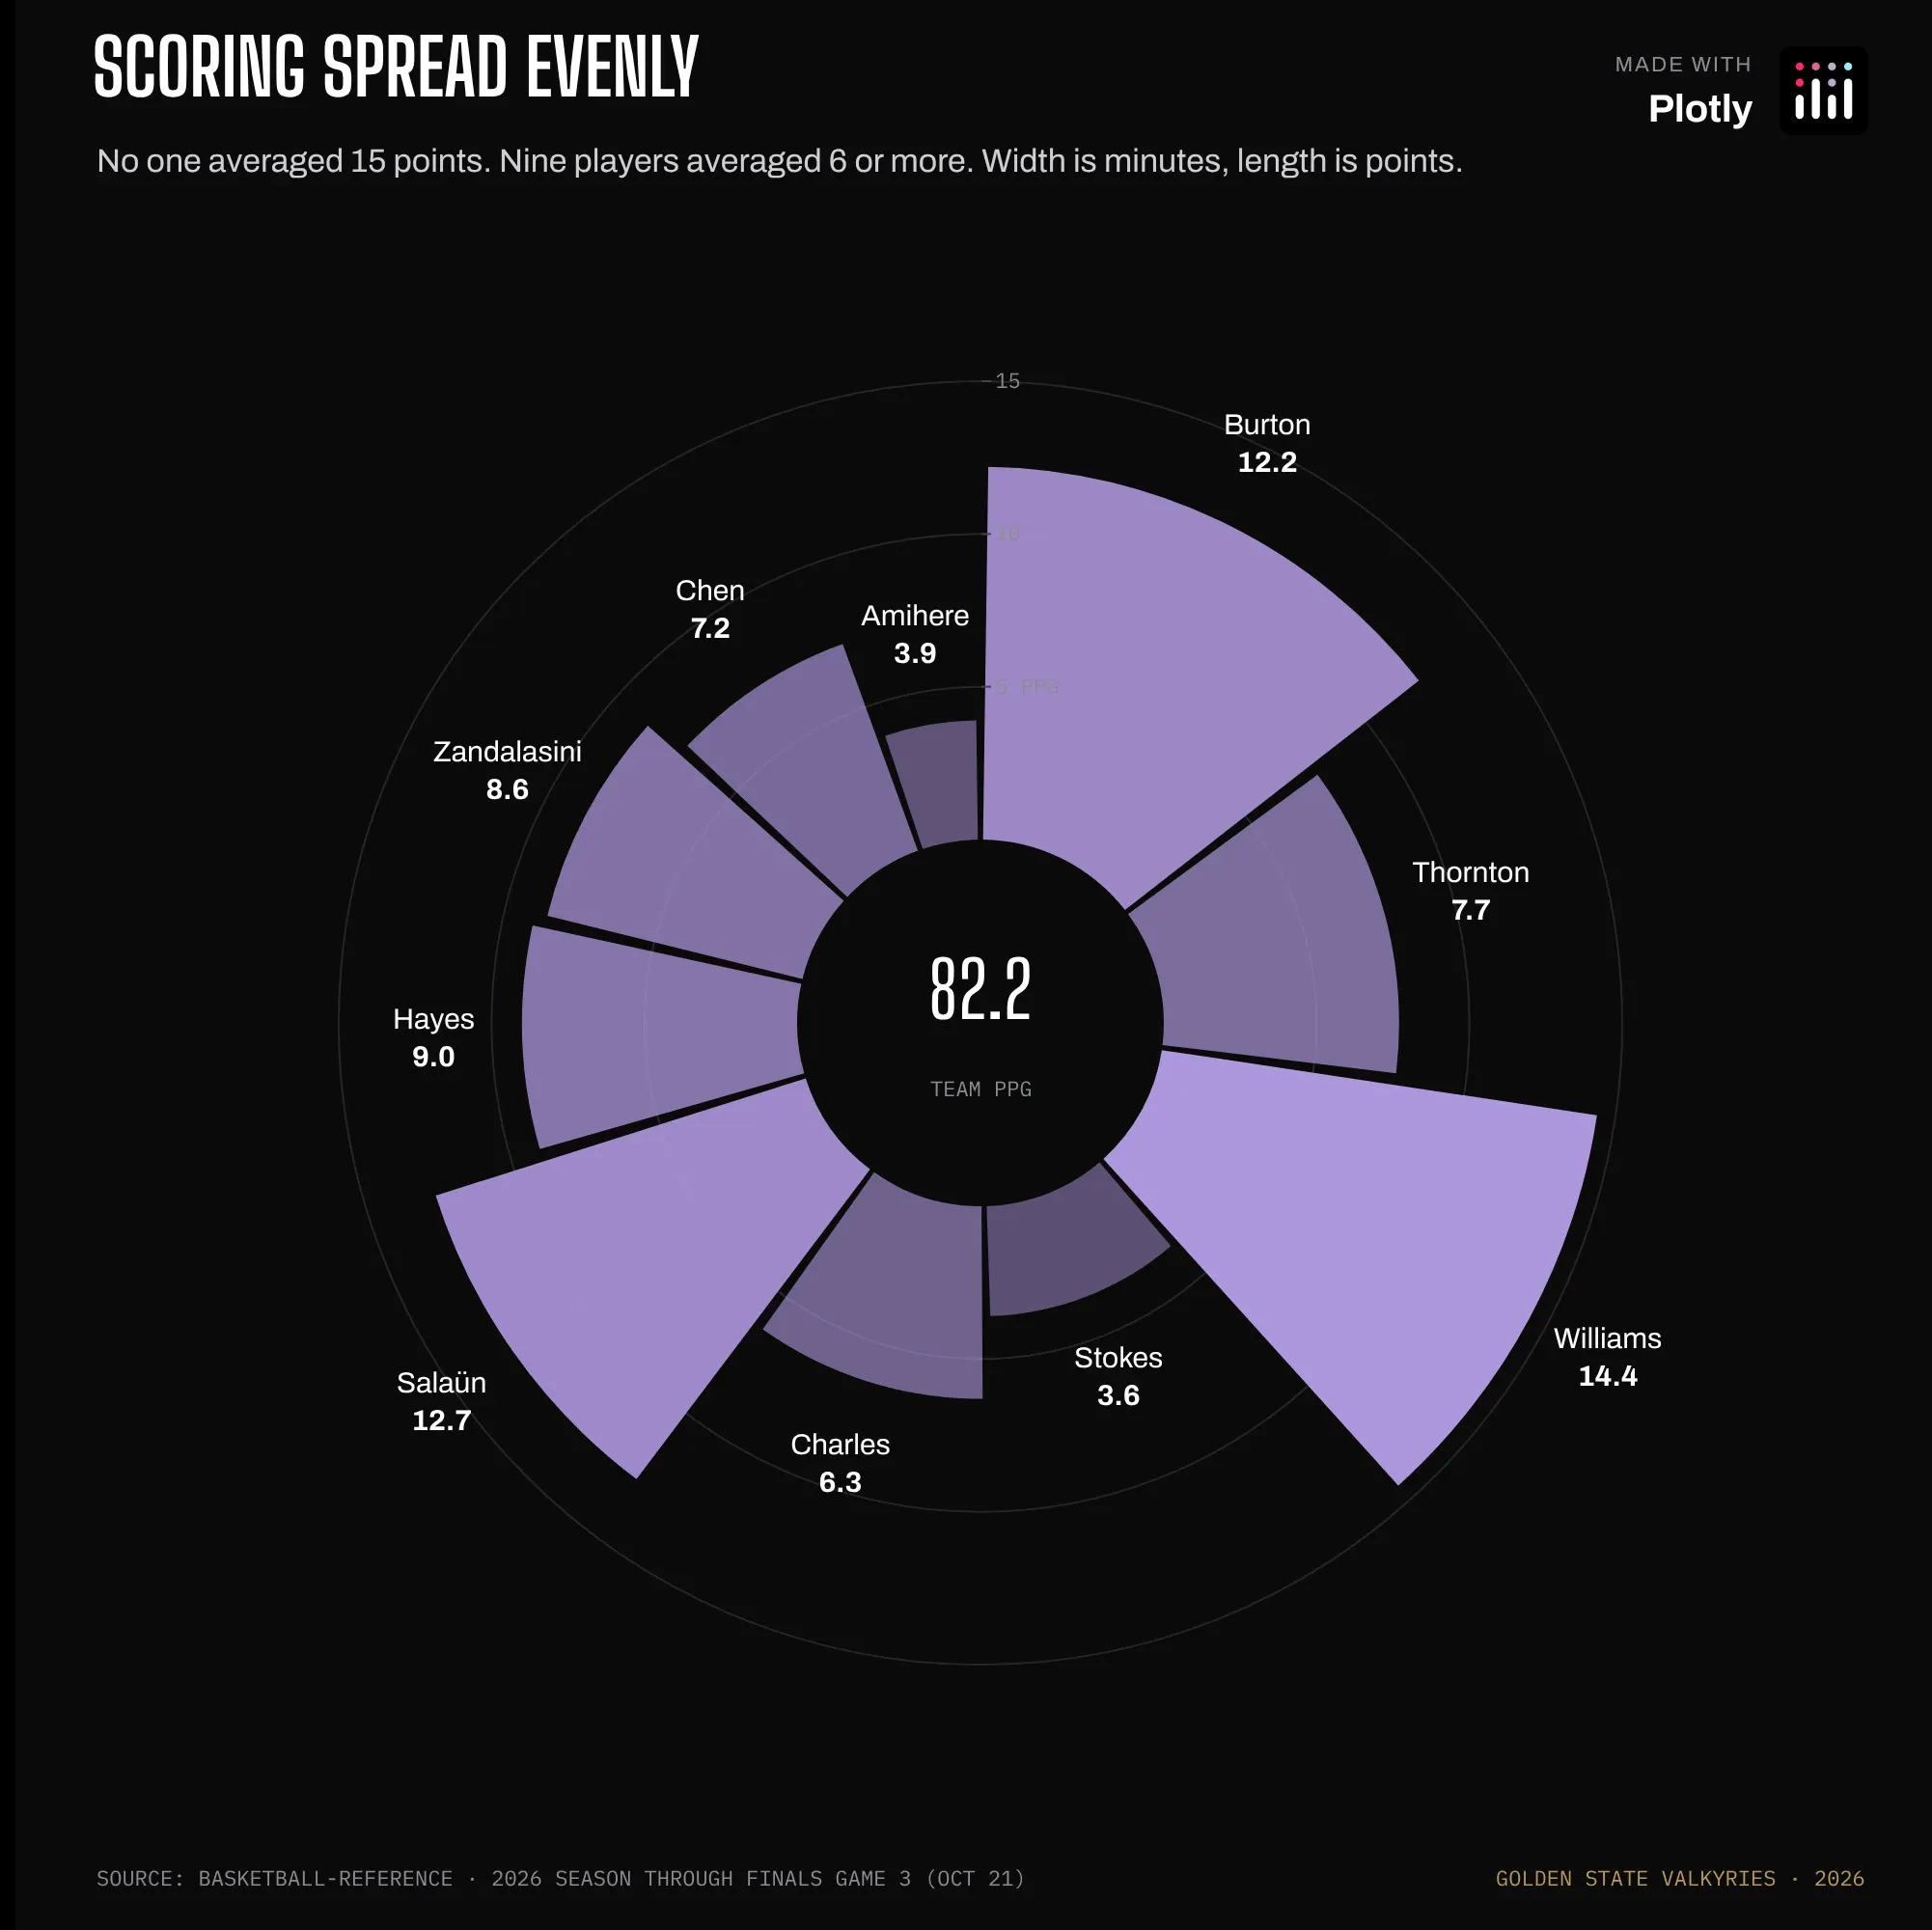
Prompt: Create a Plotly polar bar chart where each wedge is a player, its width set by minutes and its length by points, with a hole in the center for the team total.
The scoring is spread out. Gabby Williams led the team at 14.4 points a game, no one reached 15, and nine players averaged 6 or more.
How the graph was made: Each wedge's width (in degrees) is that player's share of rotation minutes (the minutes played by the ten players who play regularly), and its r is points per game. Setting base: 6 starts every bar 6 units out from the center, which opens the hole the team total sits in.
Usage vs efficiency
Data: Basketball-Reference
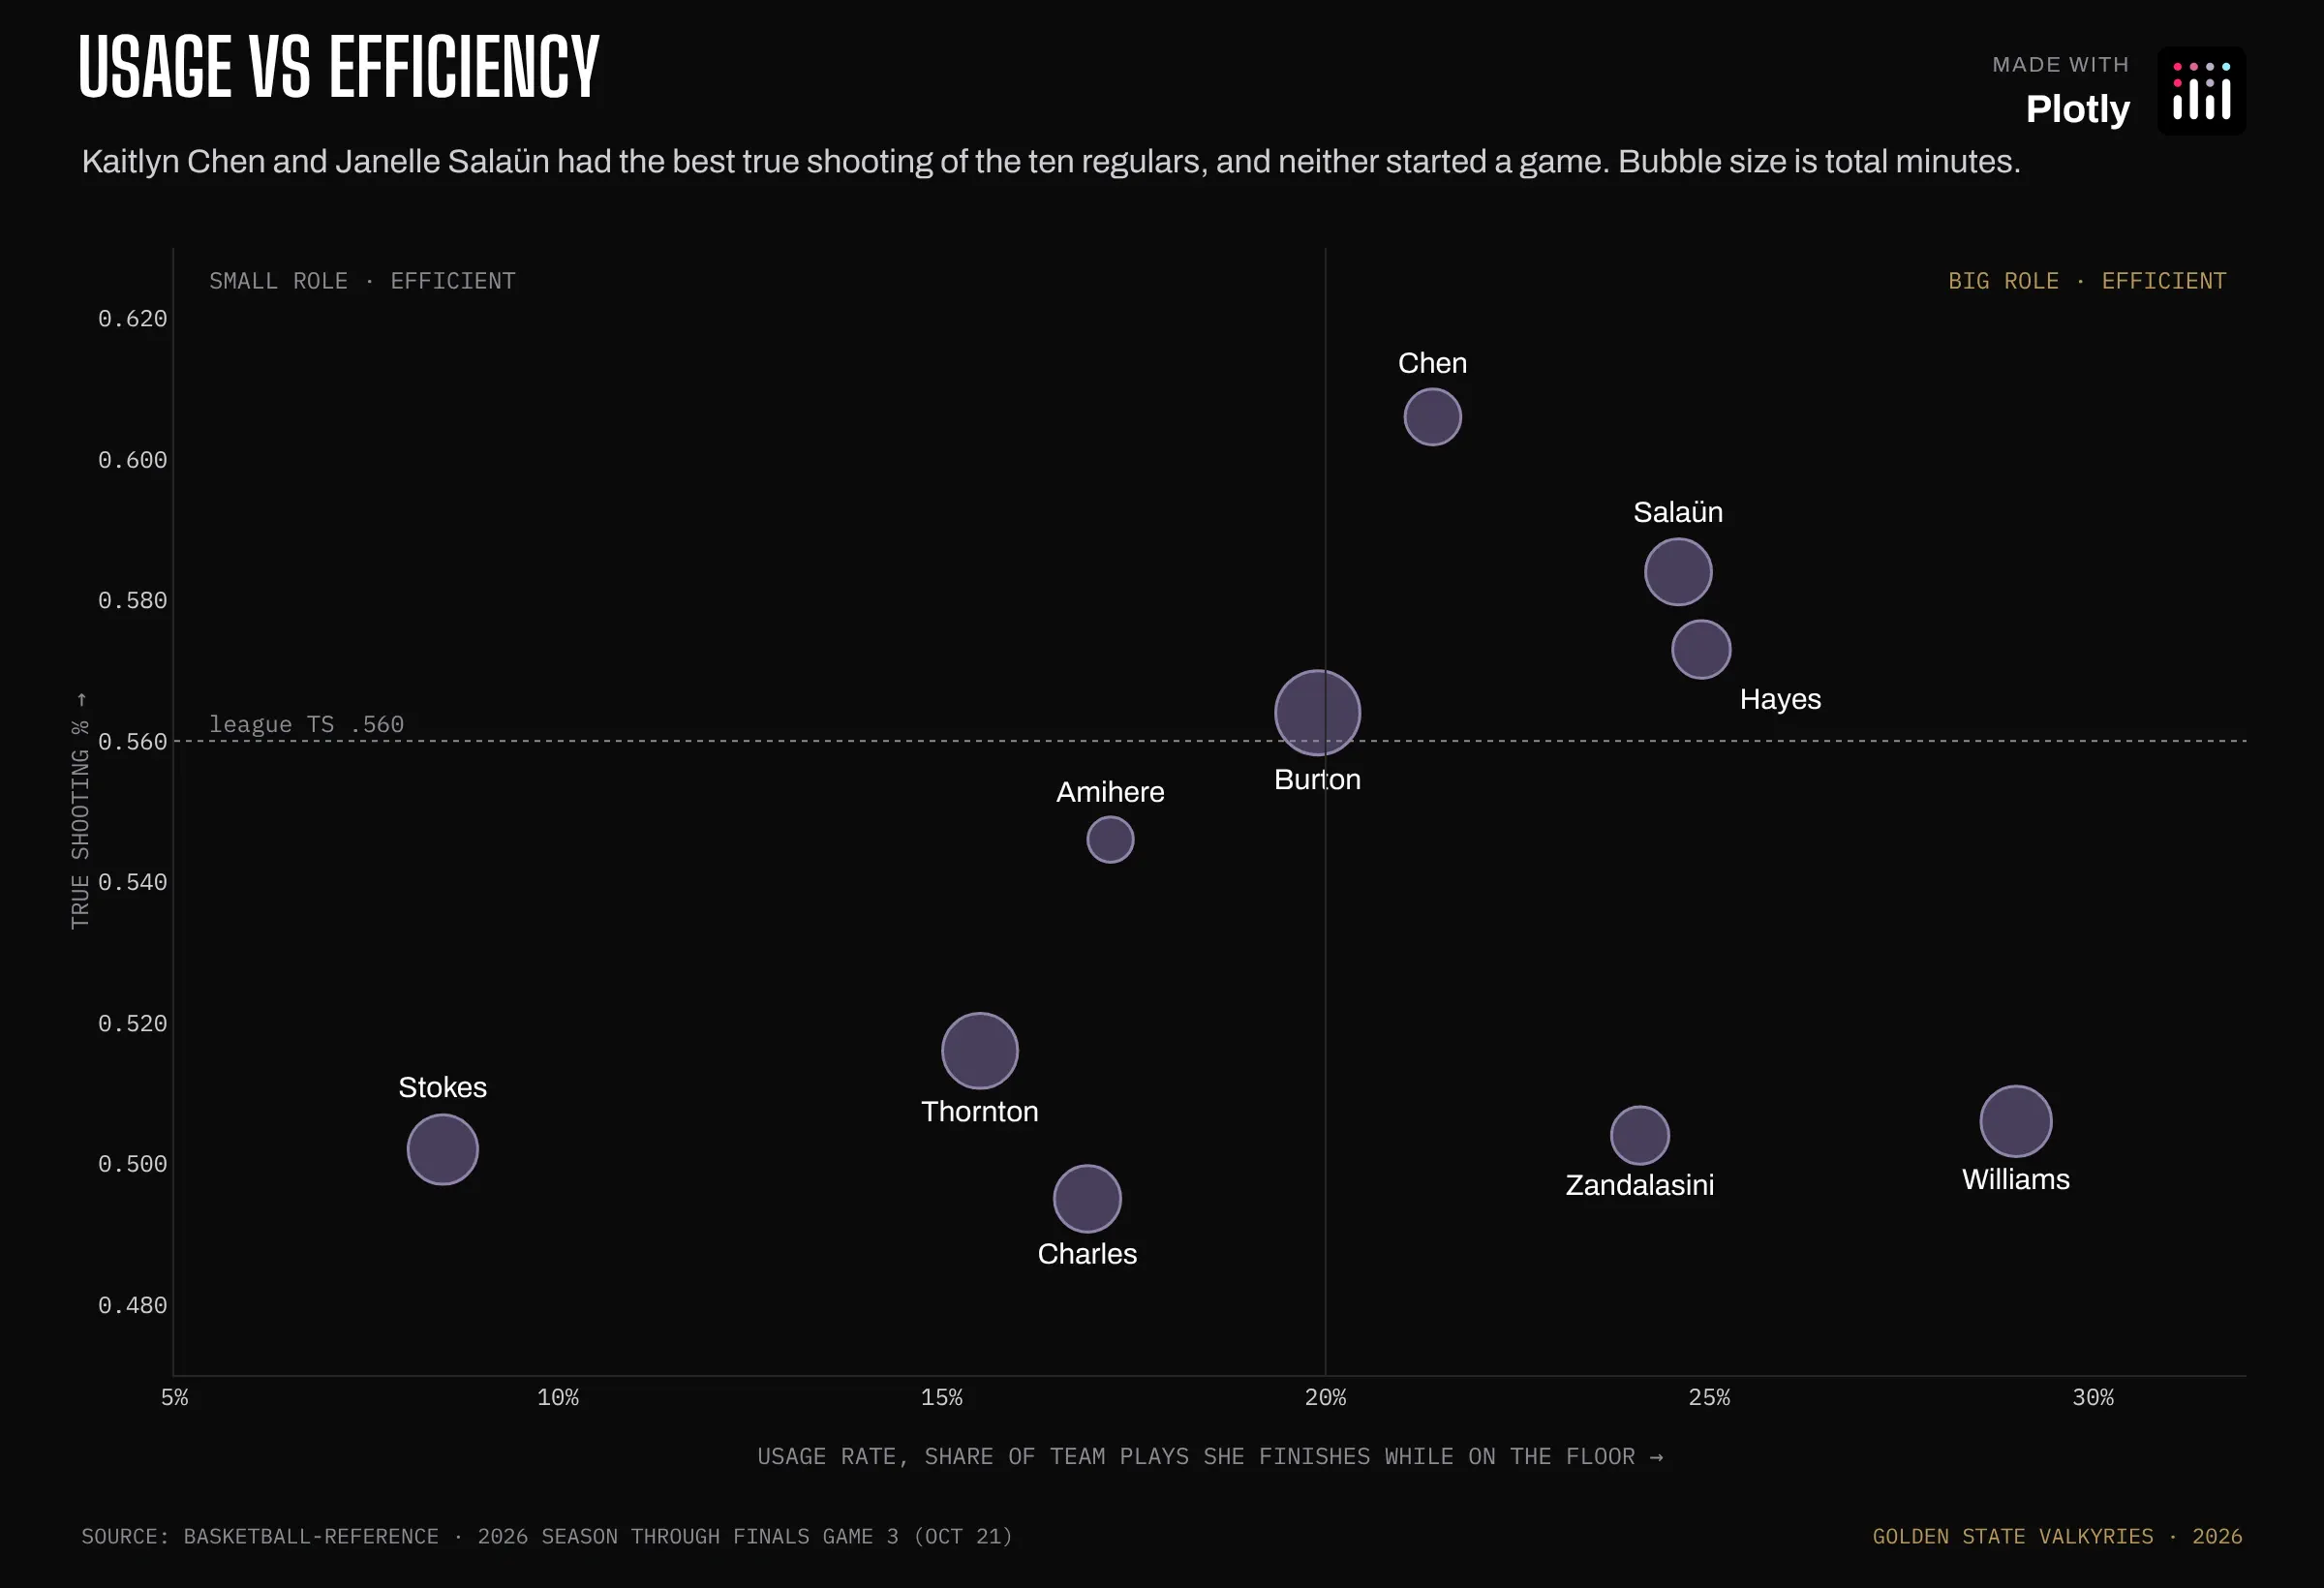
Prompt: Create a Plotly bubble chart of usage rate against true shooting, sized by minutes, with a league-average reference line and quadrant labels.
Kaitlyn Chen and Janelle Salaün had the best true shooting (a shooting percentage that also counts free throws and gives threes extra credit) of the ten regulars, and neither started a game.
How the graph was made: Usage rate (the share of team plays a player finishes with a shot, free throws or a turnover while she's on the floor) runs along the x-axis. Bubble size is computed from minutes in the trace itself, and the text positions are set per point so labels don't collide.
Every lineup won
Data: Basketball-Reference
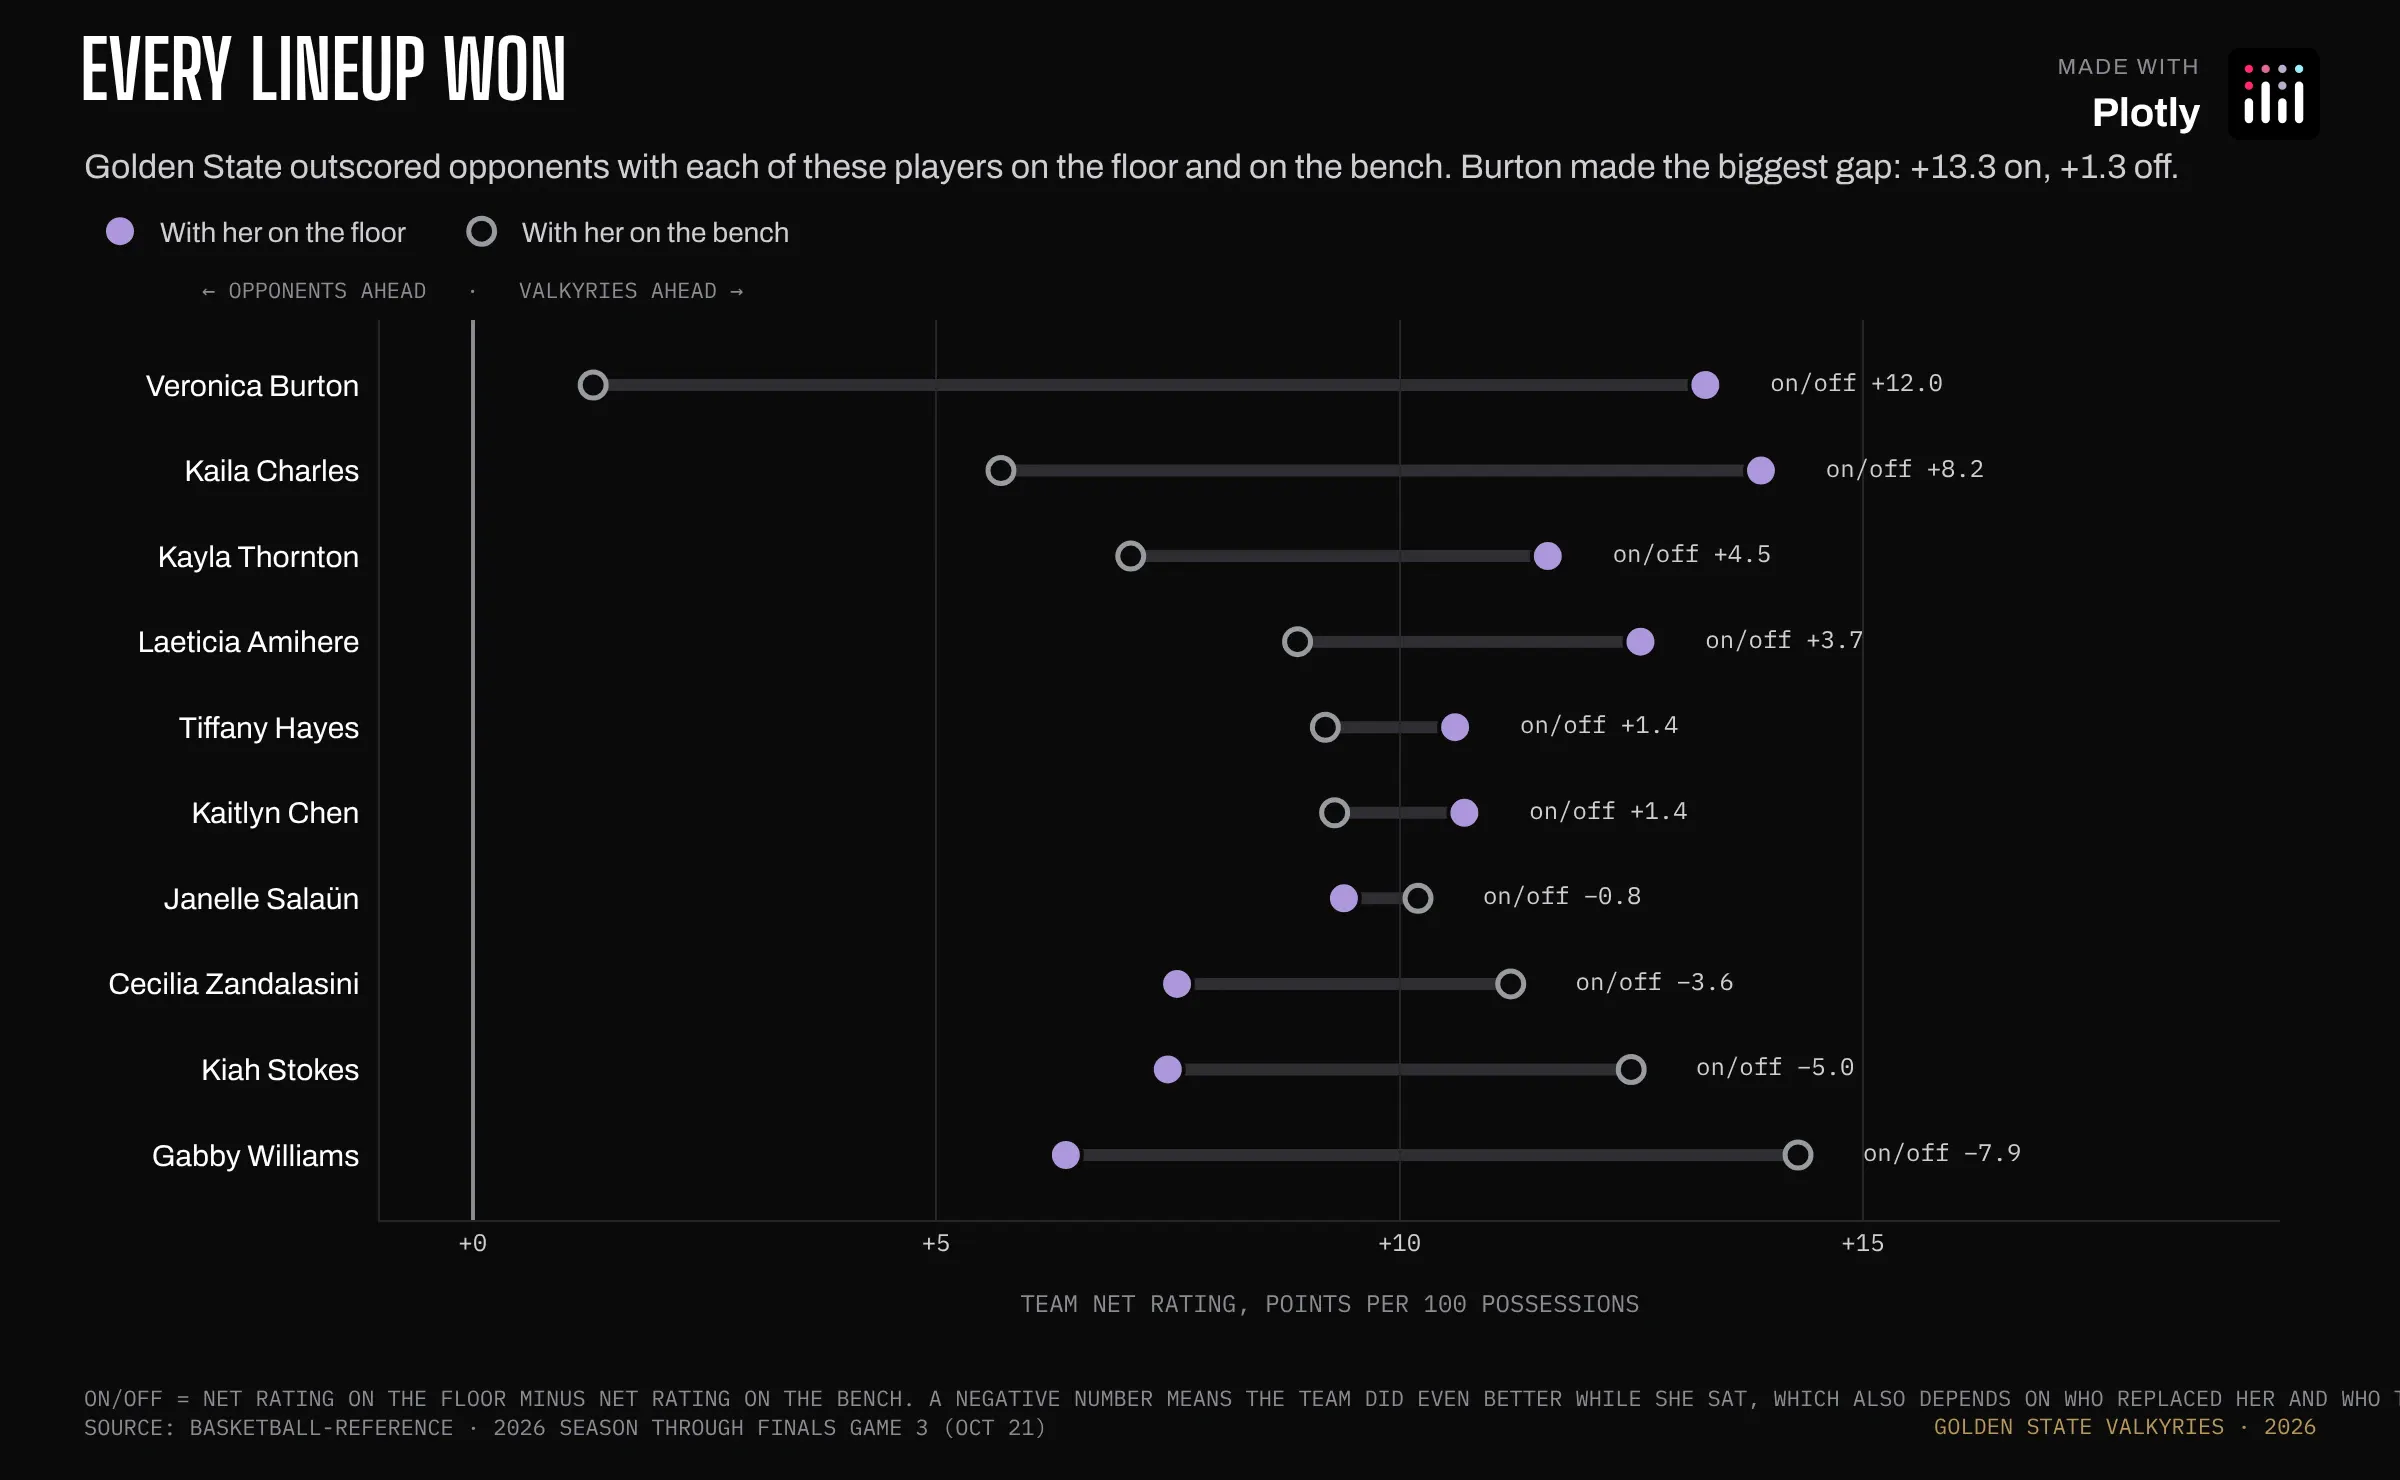
Prompt: Create a Plotly dumbbell chart of team net rating with each player on the floor and on the bench, joining the two markers with a line and printing the on/off difference at the end of each row.
Each row is one player and shows two numbers. The filled dot is how many points per 100 possessions Golden State outscored opponents by while she was on the floor. The open ring is the same number for the minutes she sat on the bench. Every dot and ring is to the right of zero, so the team outscored opponents no matter who was playing. The difference between the dot and the ring is her on/off. Veronica Burton has the biggest one: the team was +13.3 with her on the floor and only +1.3 without her. Gabby Williams goes the other way, +6.4 with her on and +14.3 with her off. That doesn't mean she hurt the team, because they were still winning her minutes. On/off also depends on who played in her place and who they were up against, so it's a noisy number.
How the graph was made: The open ring is a marker whose fill matches the background (marker.color) with a colored outline (marker.line). The gray bar joining the two markers is a line shape.
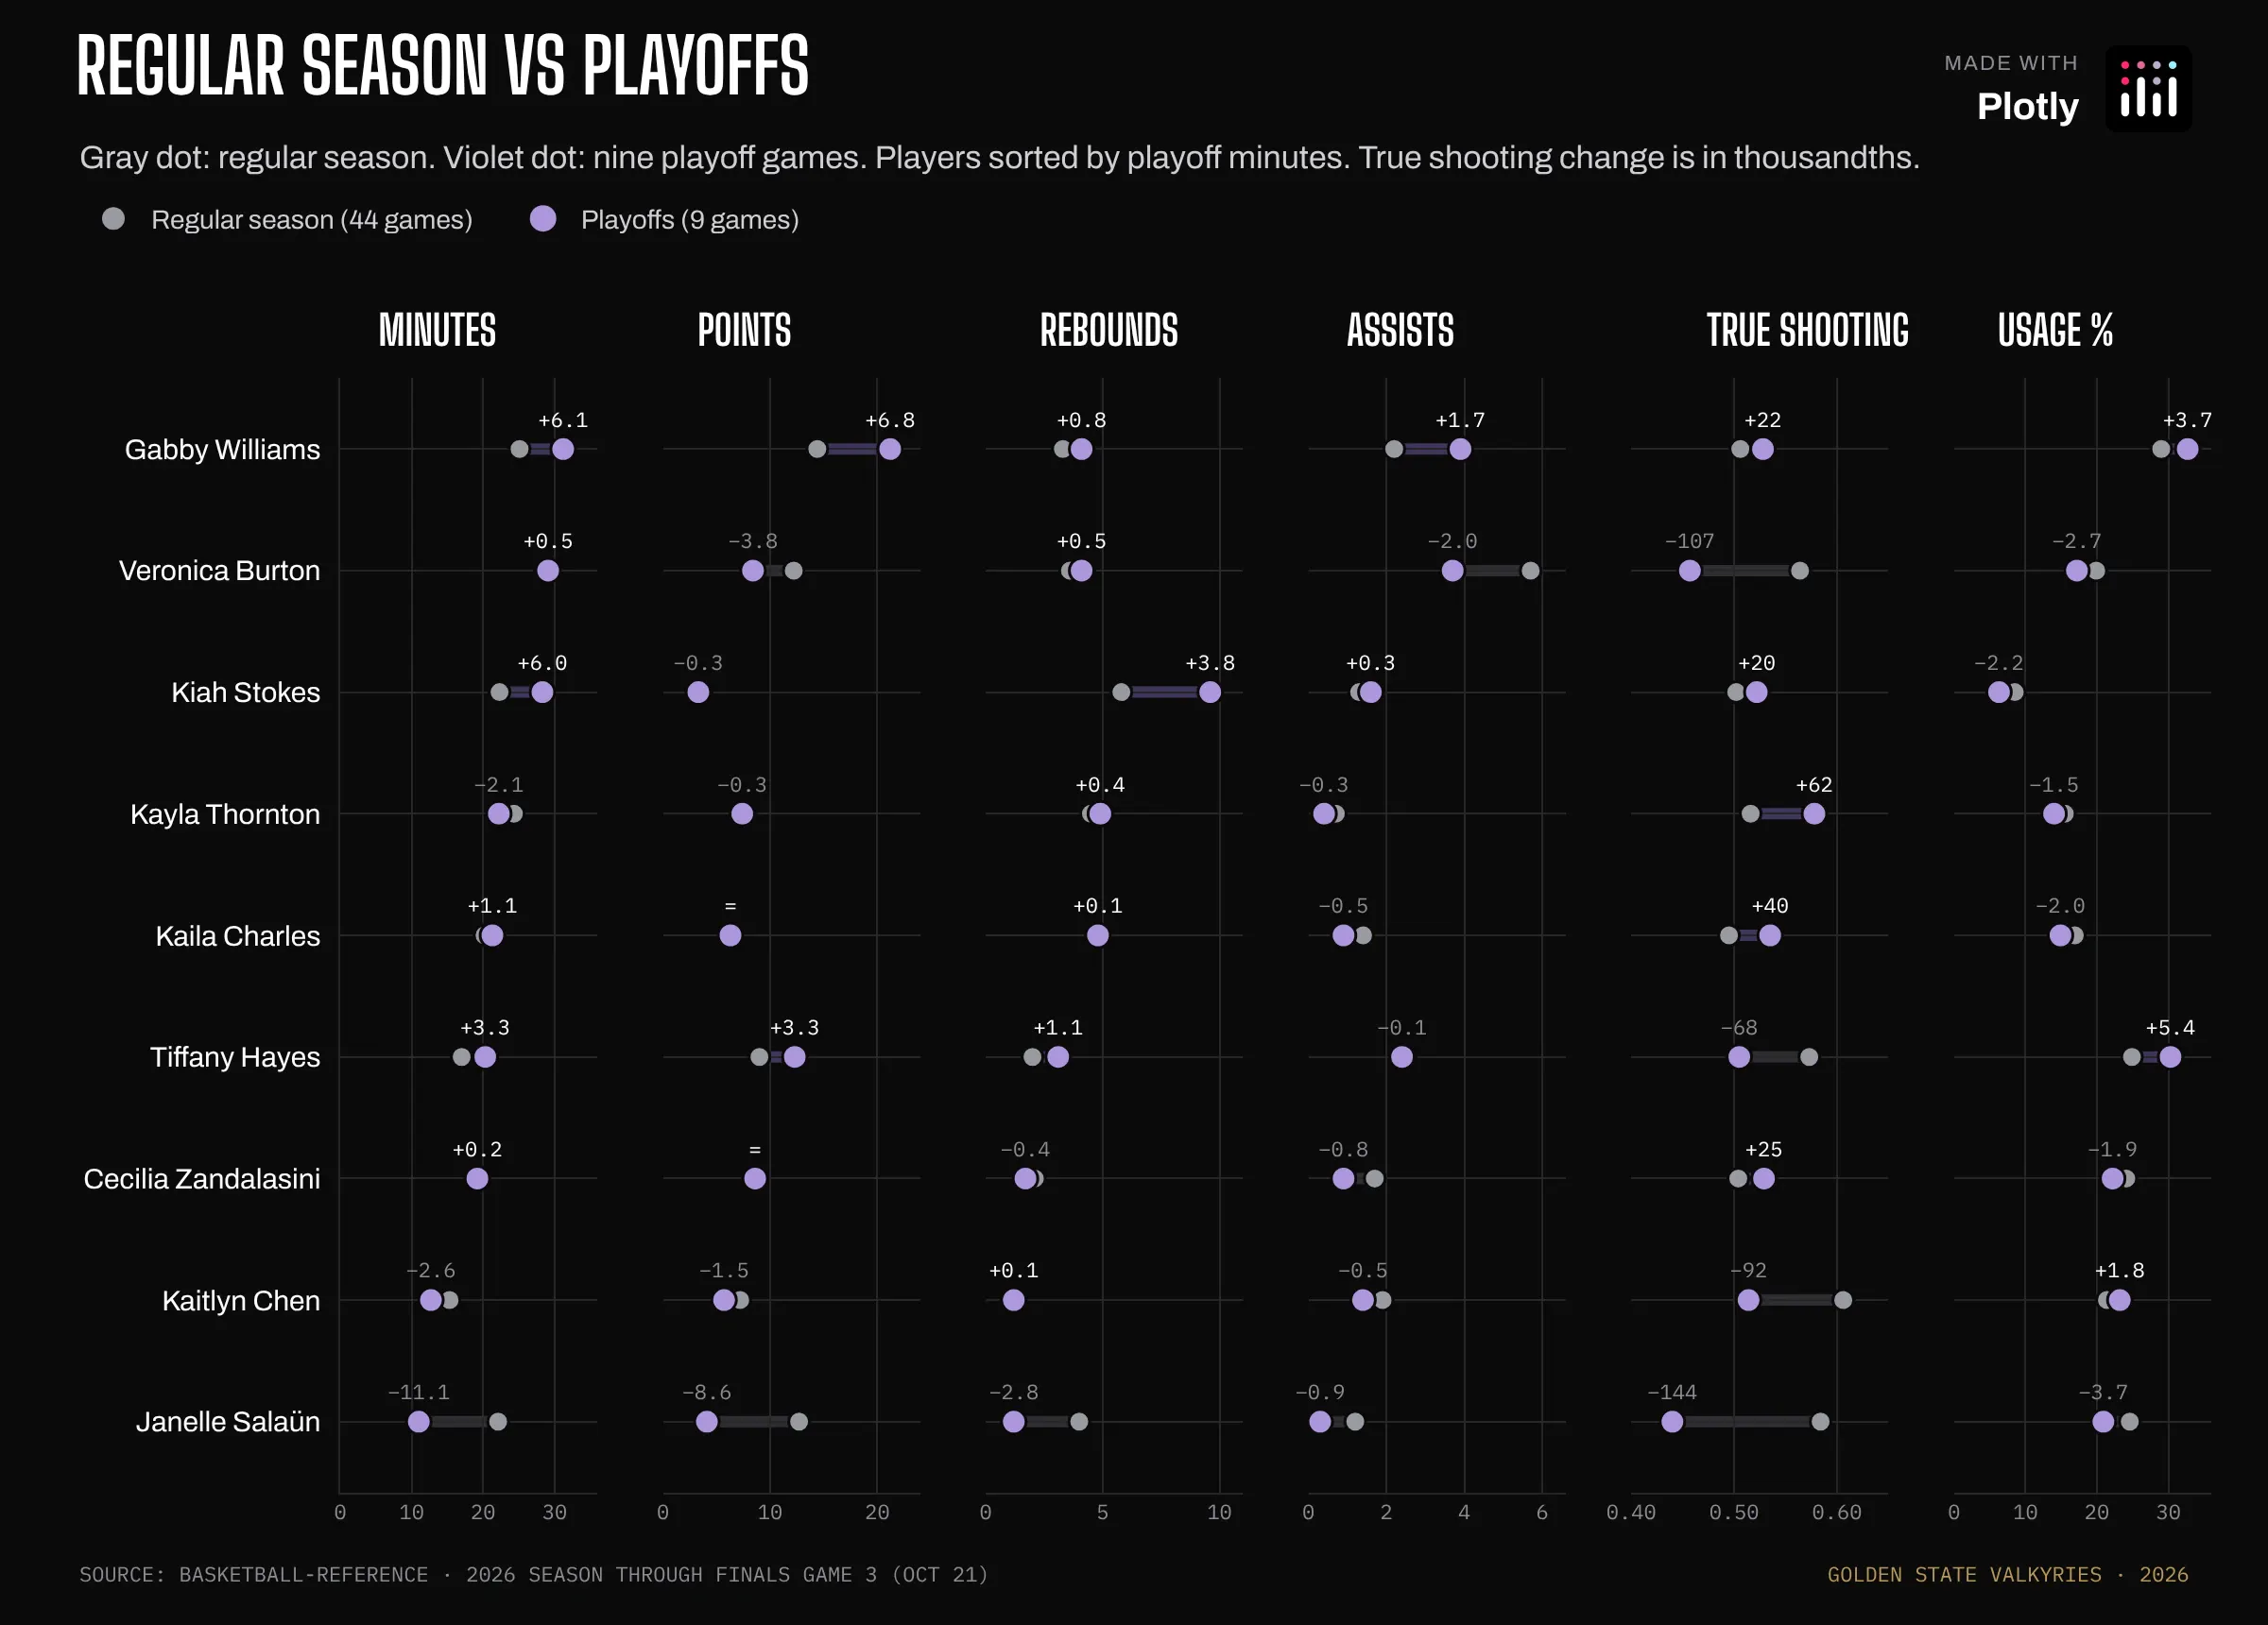
Regular season vs playoffs
Data: Basketball-Reference
Prompt: Create a Plotly figure with six dumbbell panels comparing regular season and playoffs for minutes, points, rebounds, assists, true shooting and usage, all sharing one player axis, with the change printed over each playoff dot.
Gabby Williams took on more of everything. Kiah Stokes went from 5.8 to 9.6 rebounds a game, and Janelle Salaün's minutes were cut in half.
How the graph was made: There are six x-axes, each with its own domain and range, all sharing one categorical y-axis. You read across a row to see one player change in six ways. The connectors are line shapes referenced to each panel's axes.
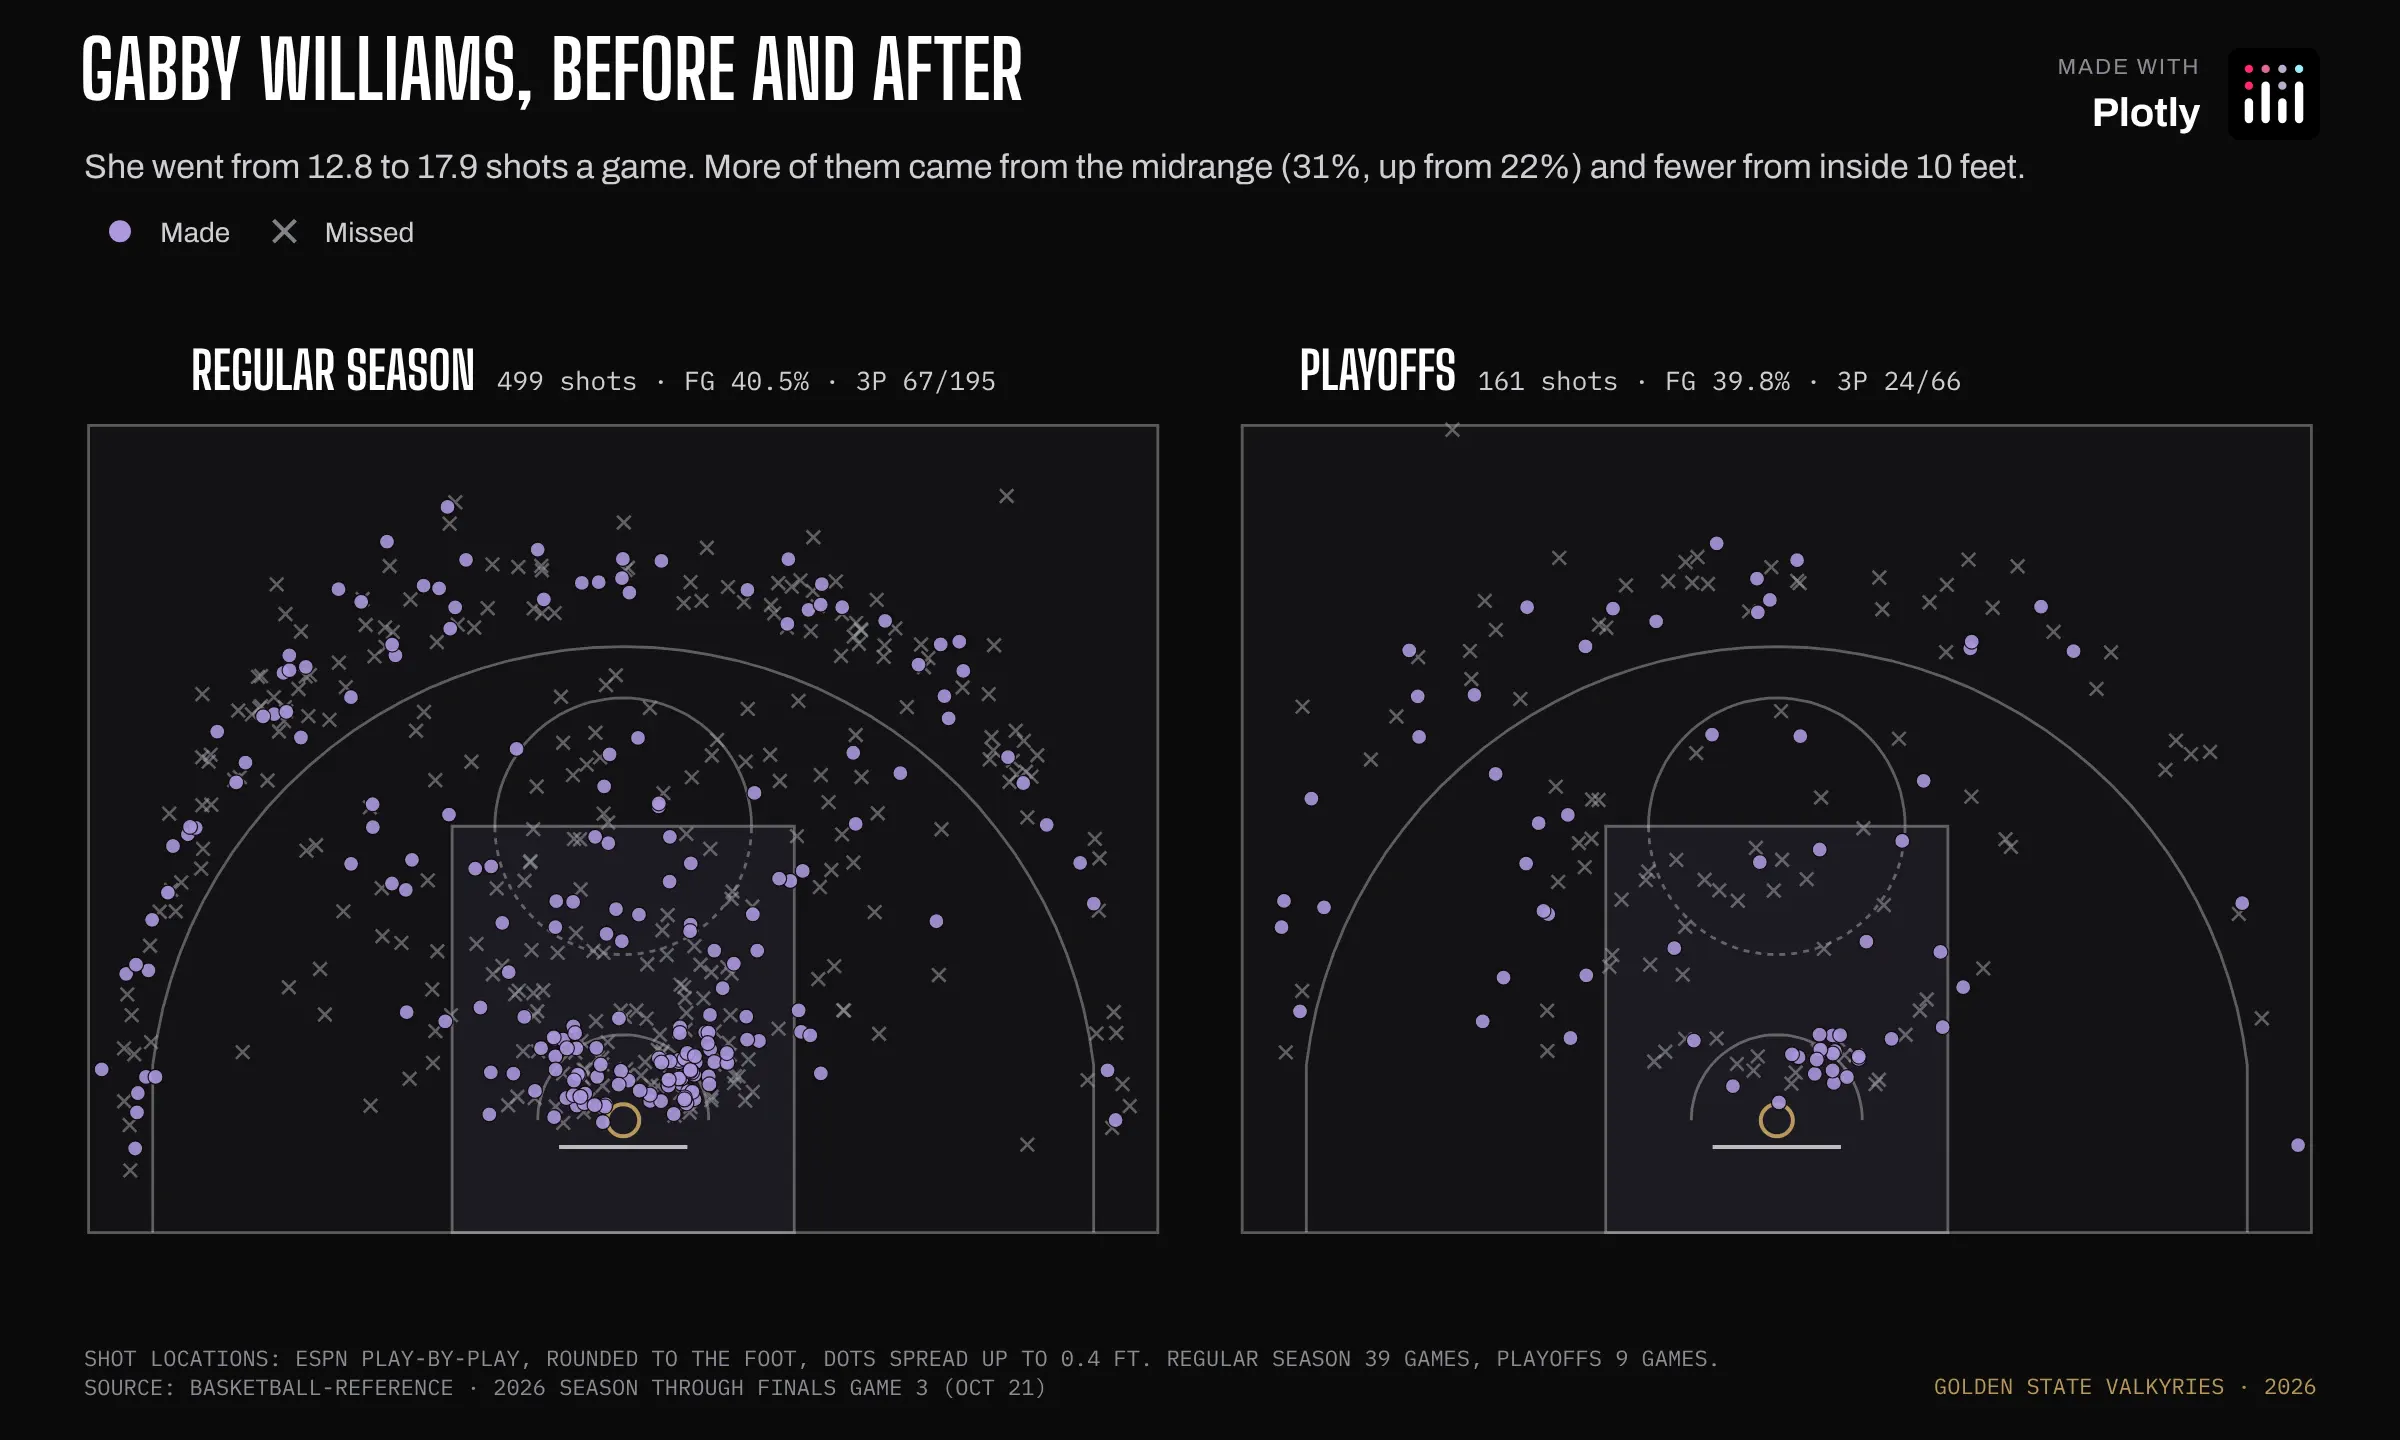
Gabby Williams, before and after
Data: ESPN play-by-play
Prompt: Create two Plotly half-court shot charts side by side for Gabby Williams, regular season and playoffs, with makes and misses.
She went from 12.8 to 17.9 shots a game in the playoffs. More of them came from the midrange (31%, up from 22%) and fewer from inside 10 feet.
How the graph was made: Same court shapes, drawn on two axis pairs.
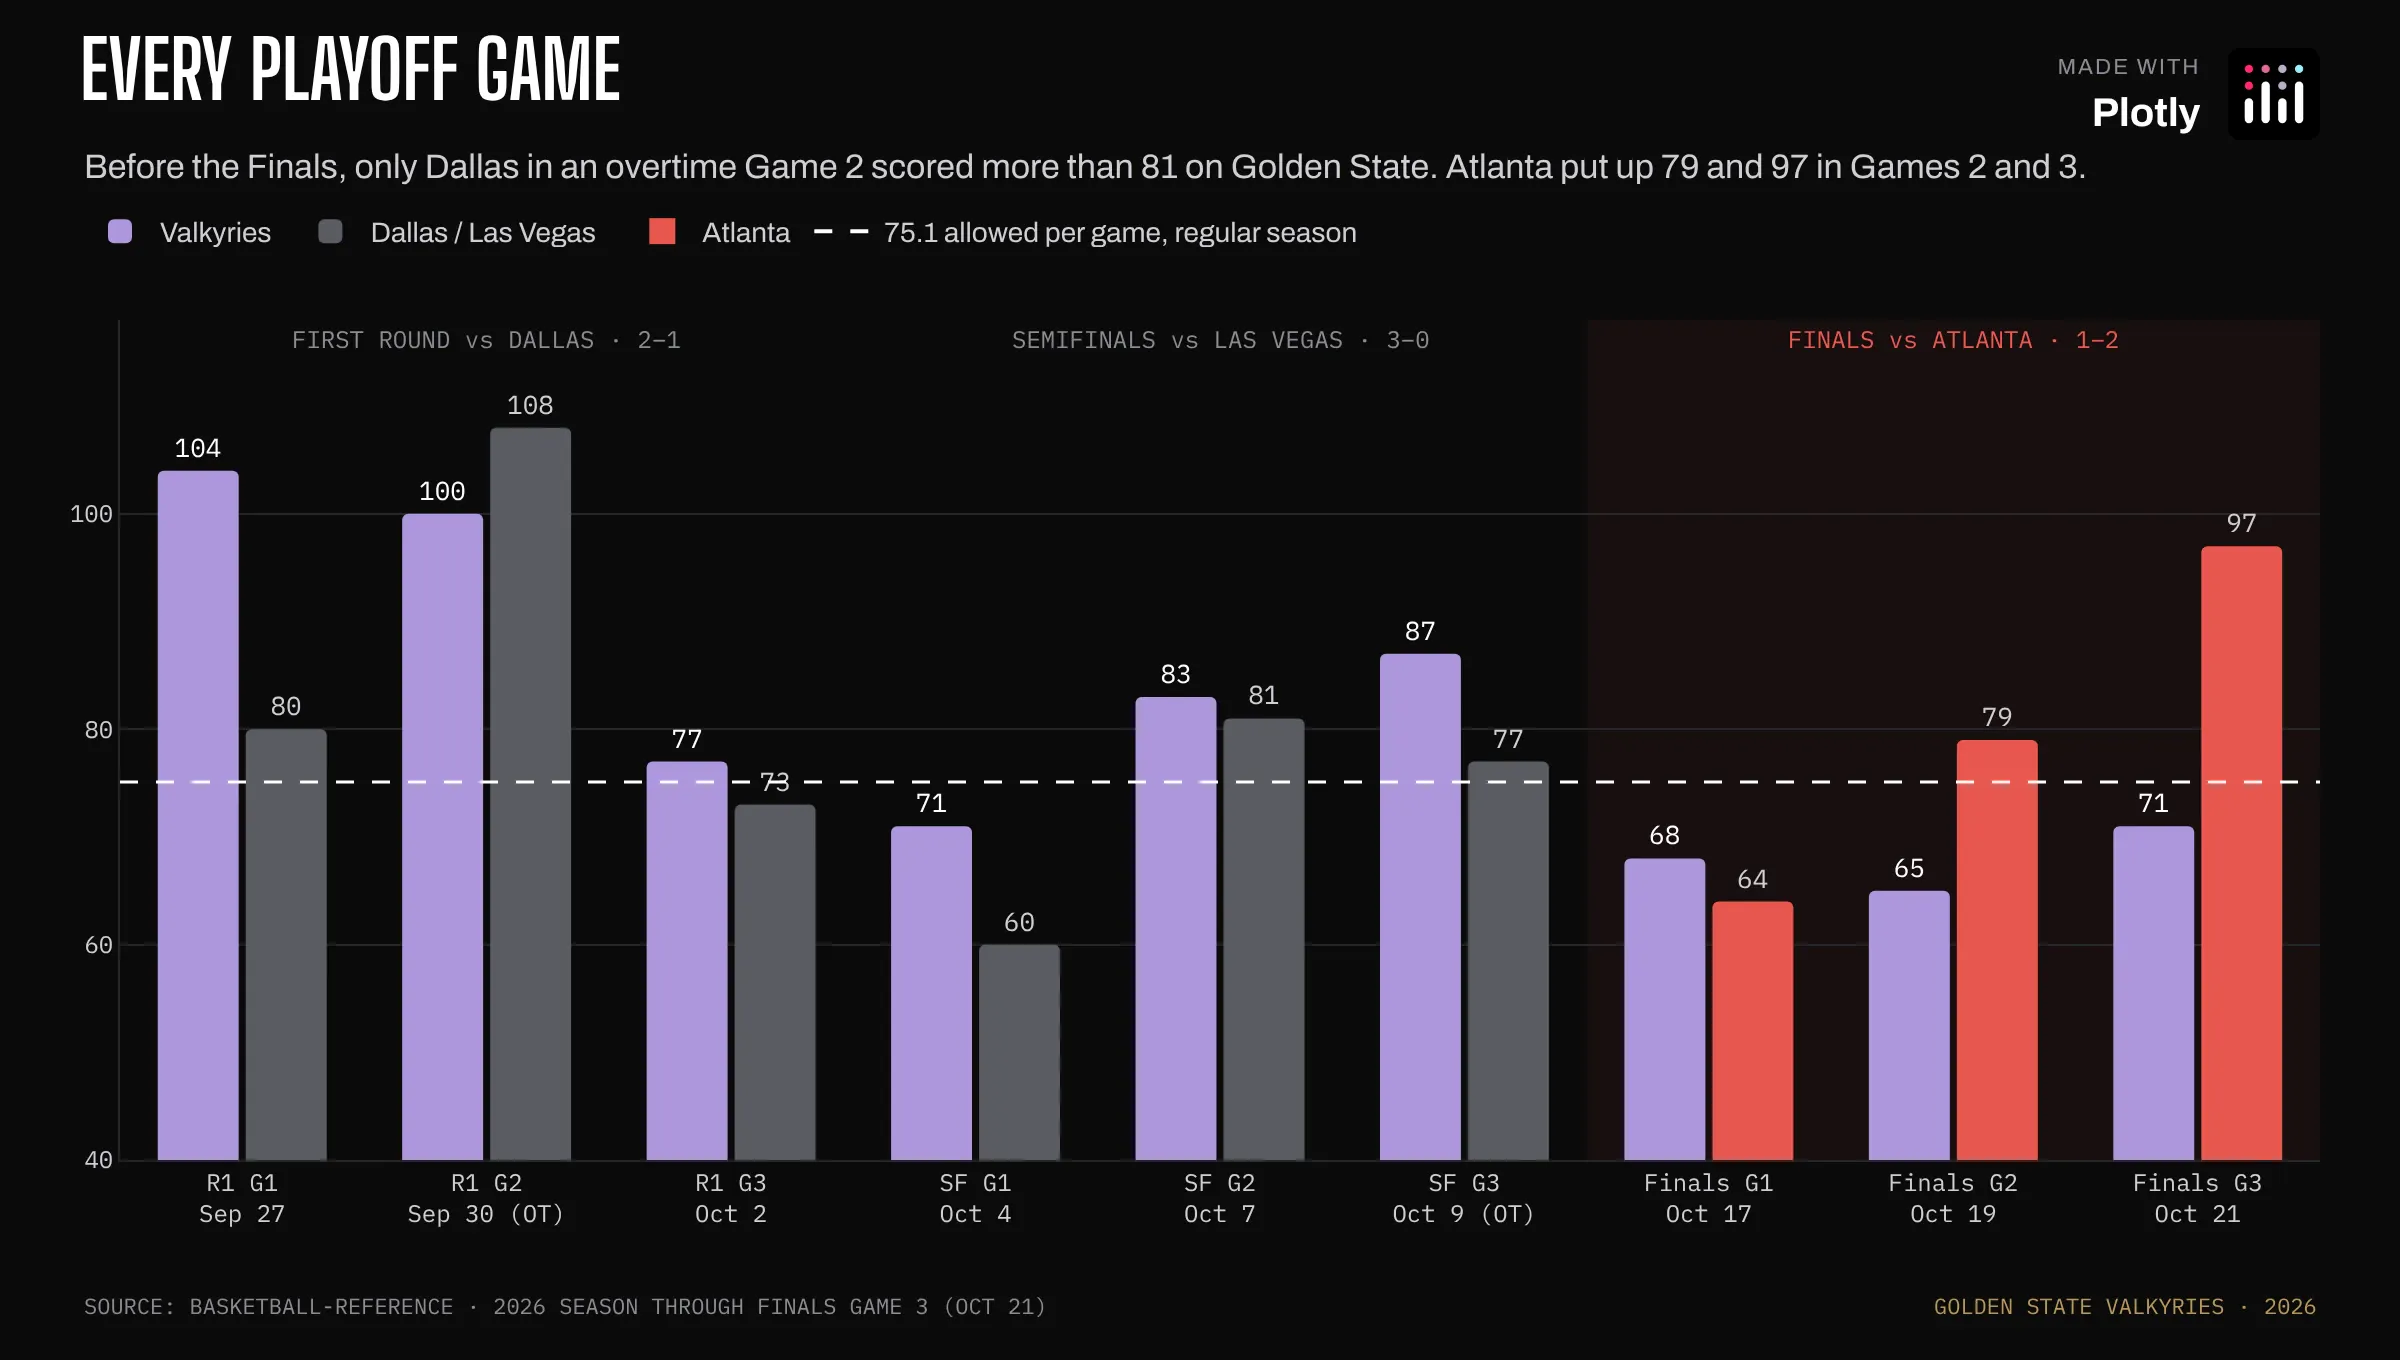
Every playoff game
Data: Basketball-Reference
Prompt: Create a Plotly grouped bar chart of points for both teams in every playoff game, with Atlanta's bars in red, a dashed line at the regular-season points-allowed average, and a label over each round.
Before the Finals, only Dallas, in an overtime Game 2, scored more than 81 on Golden State. Atlanta put up 79 and 97 in Games 2 and 3.
How the graph was made: The opponent trace takes an array for marker.color, so the Atlanta bars are red and Dallas and Las Vegas are gray within the same trace. The dashed reference line is a shape with xref: "paper" so it spans the whole plot.
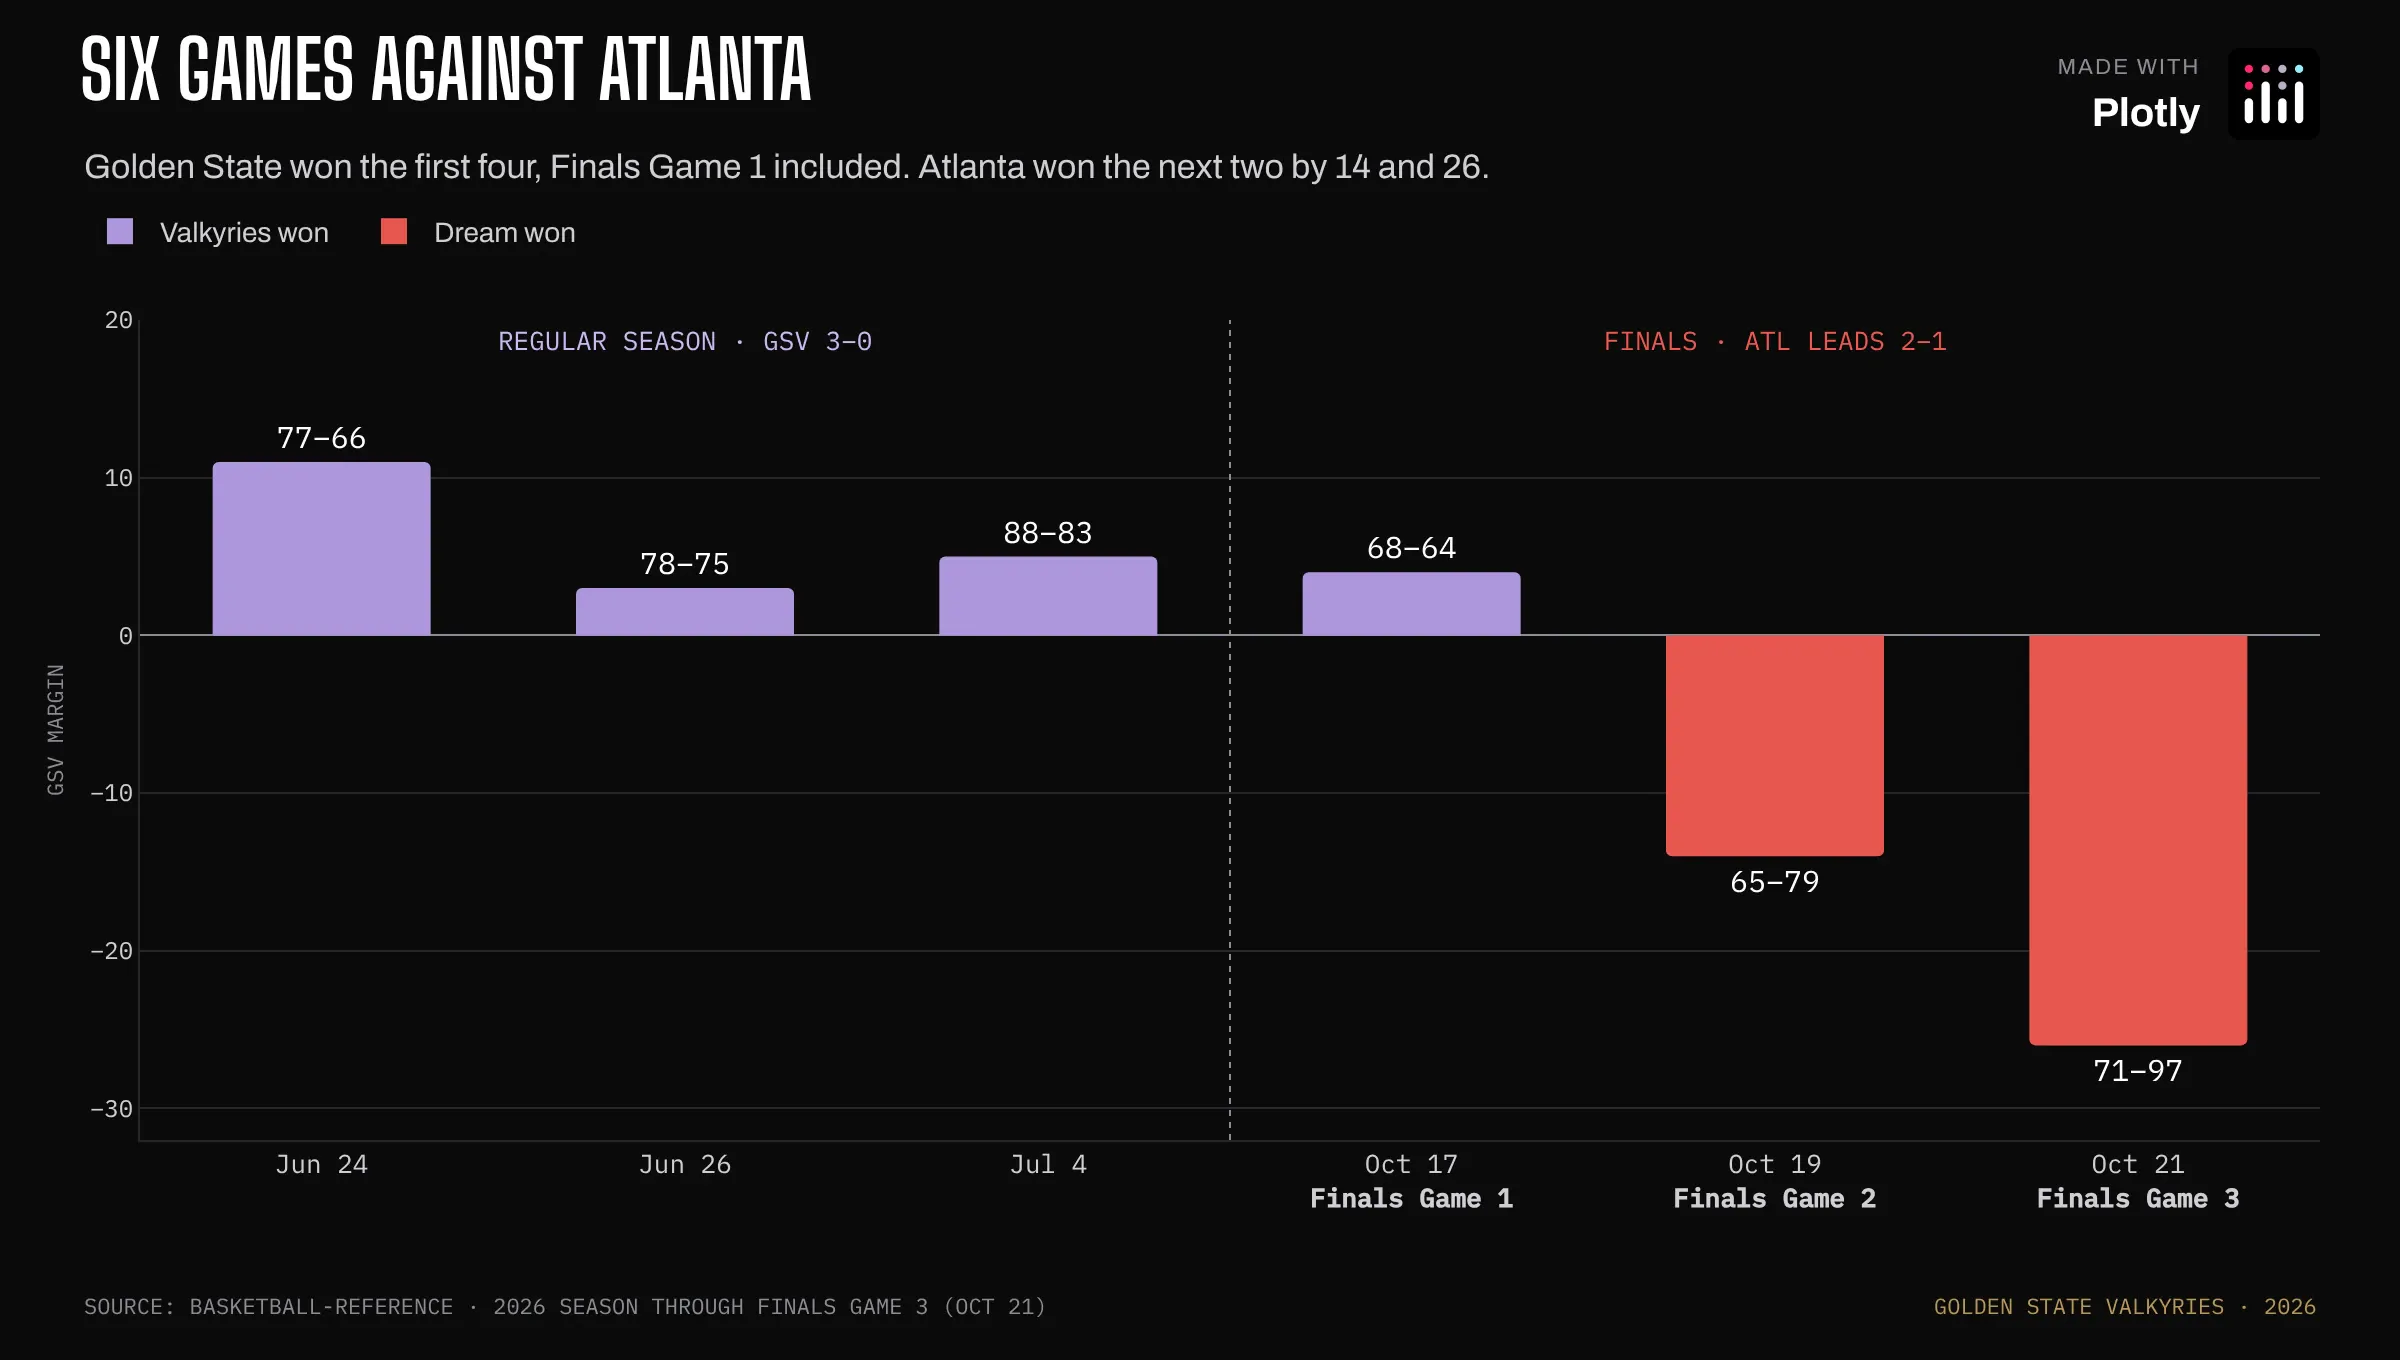
Six games against Atlanta
Data: Basketball-Reference
Prompt: Create a Plotly bar chart of the final margin in every Valkyries vs Dream game, with a dotted divider between the regular season and the Finals.
Golden State won the first four, including Finals Game 1. Atlanta won the next two by 14 and 26.
How the graph was made: A bar chart with a categorical x-axis and one dotted line shape at the boundary.
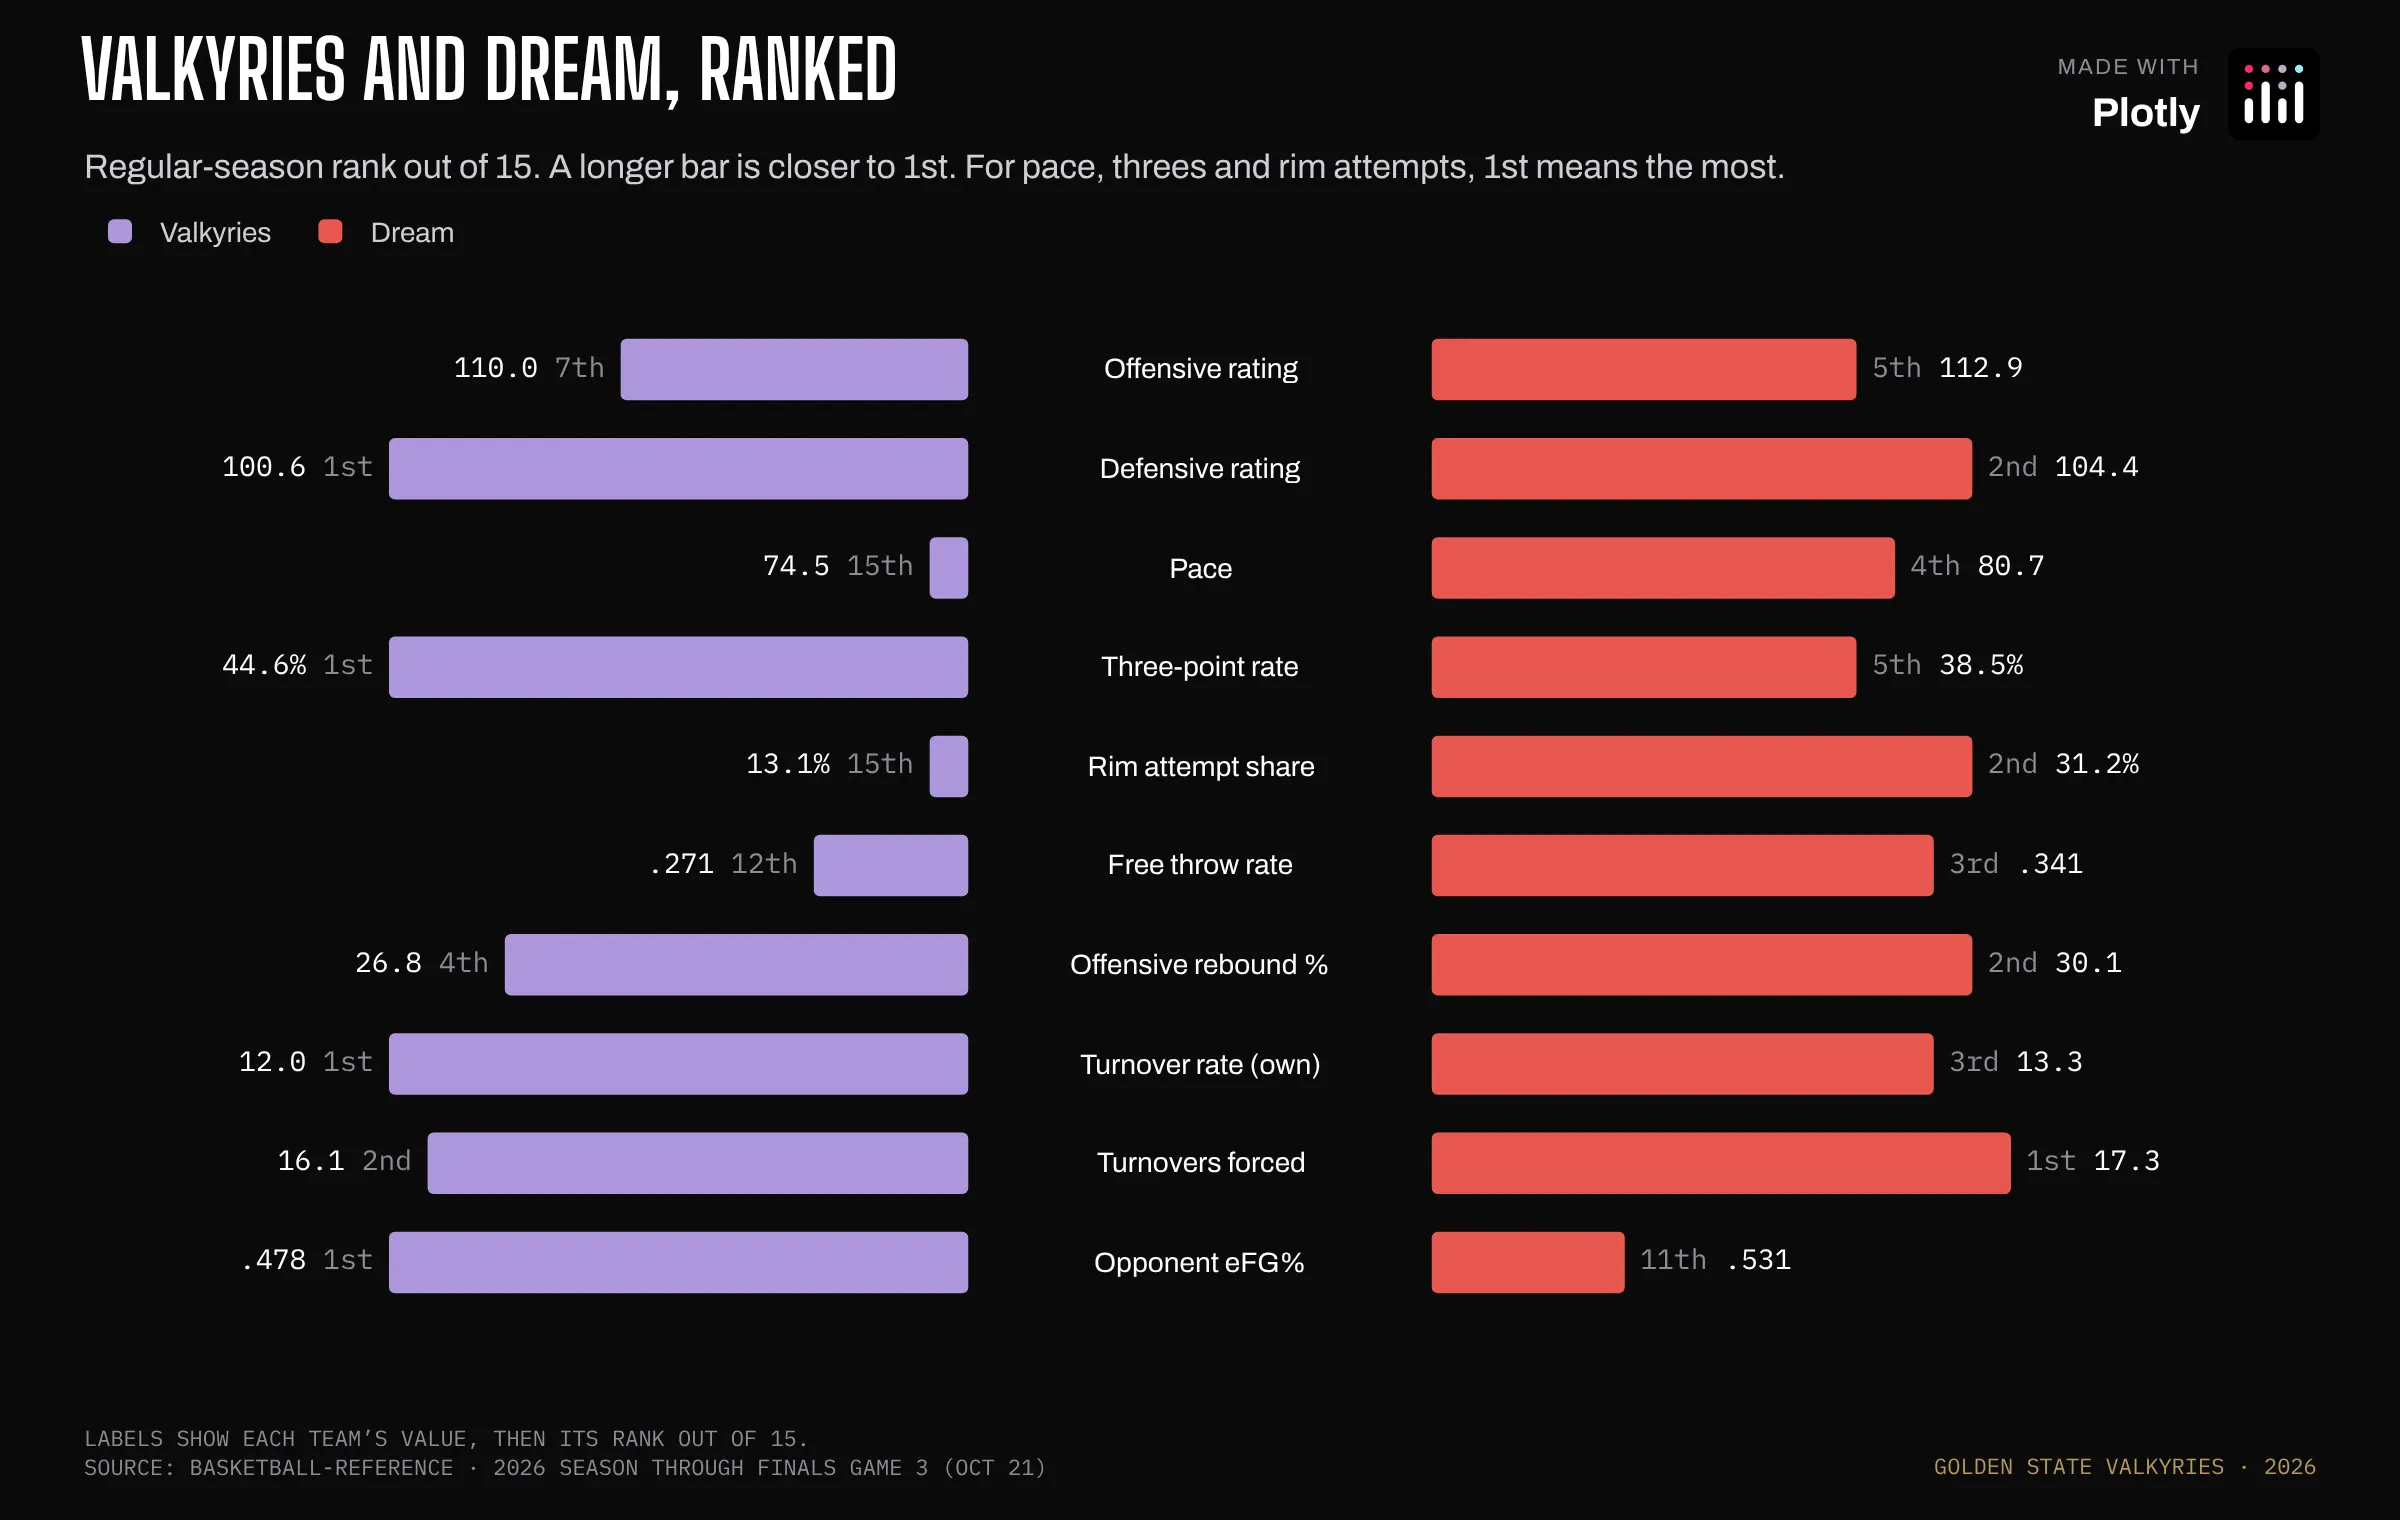
Valkyries and Dream, ranked
Data: Basketball-Reference league stats
Prompt: Create a Plotly butterfly chart of Valkyries and Dream league ranks on ten stats, with the bars pushed off center to leave a gutter for the stat names and each value and rank at the bar's outer end.
Atlanta is the opposite team: a top-five pace, the 2nd-highest share of shots at the rim, and the 2nd-best offensive rebounding (grabbing your own team's missed shots for another try).
How the graph was made: Each team's bars start at base: ±6.5 rather than zero, which leaves an empty gutter down the middle for the stat names. They're annotations at x = 0.
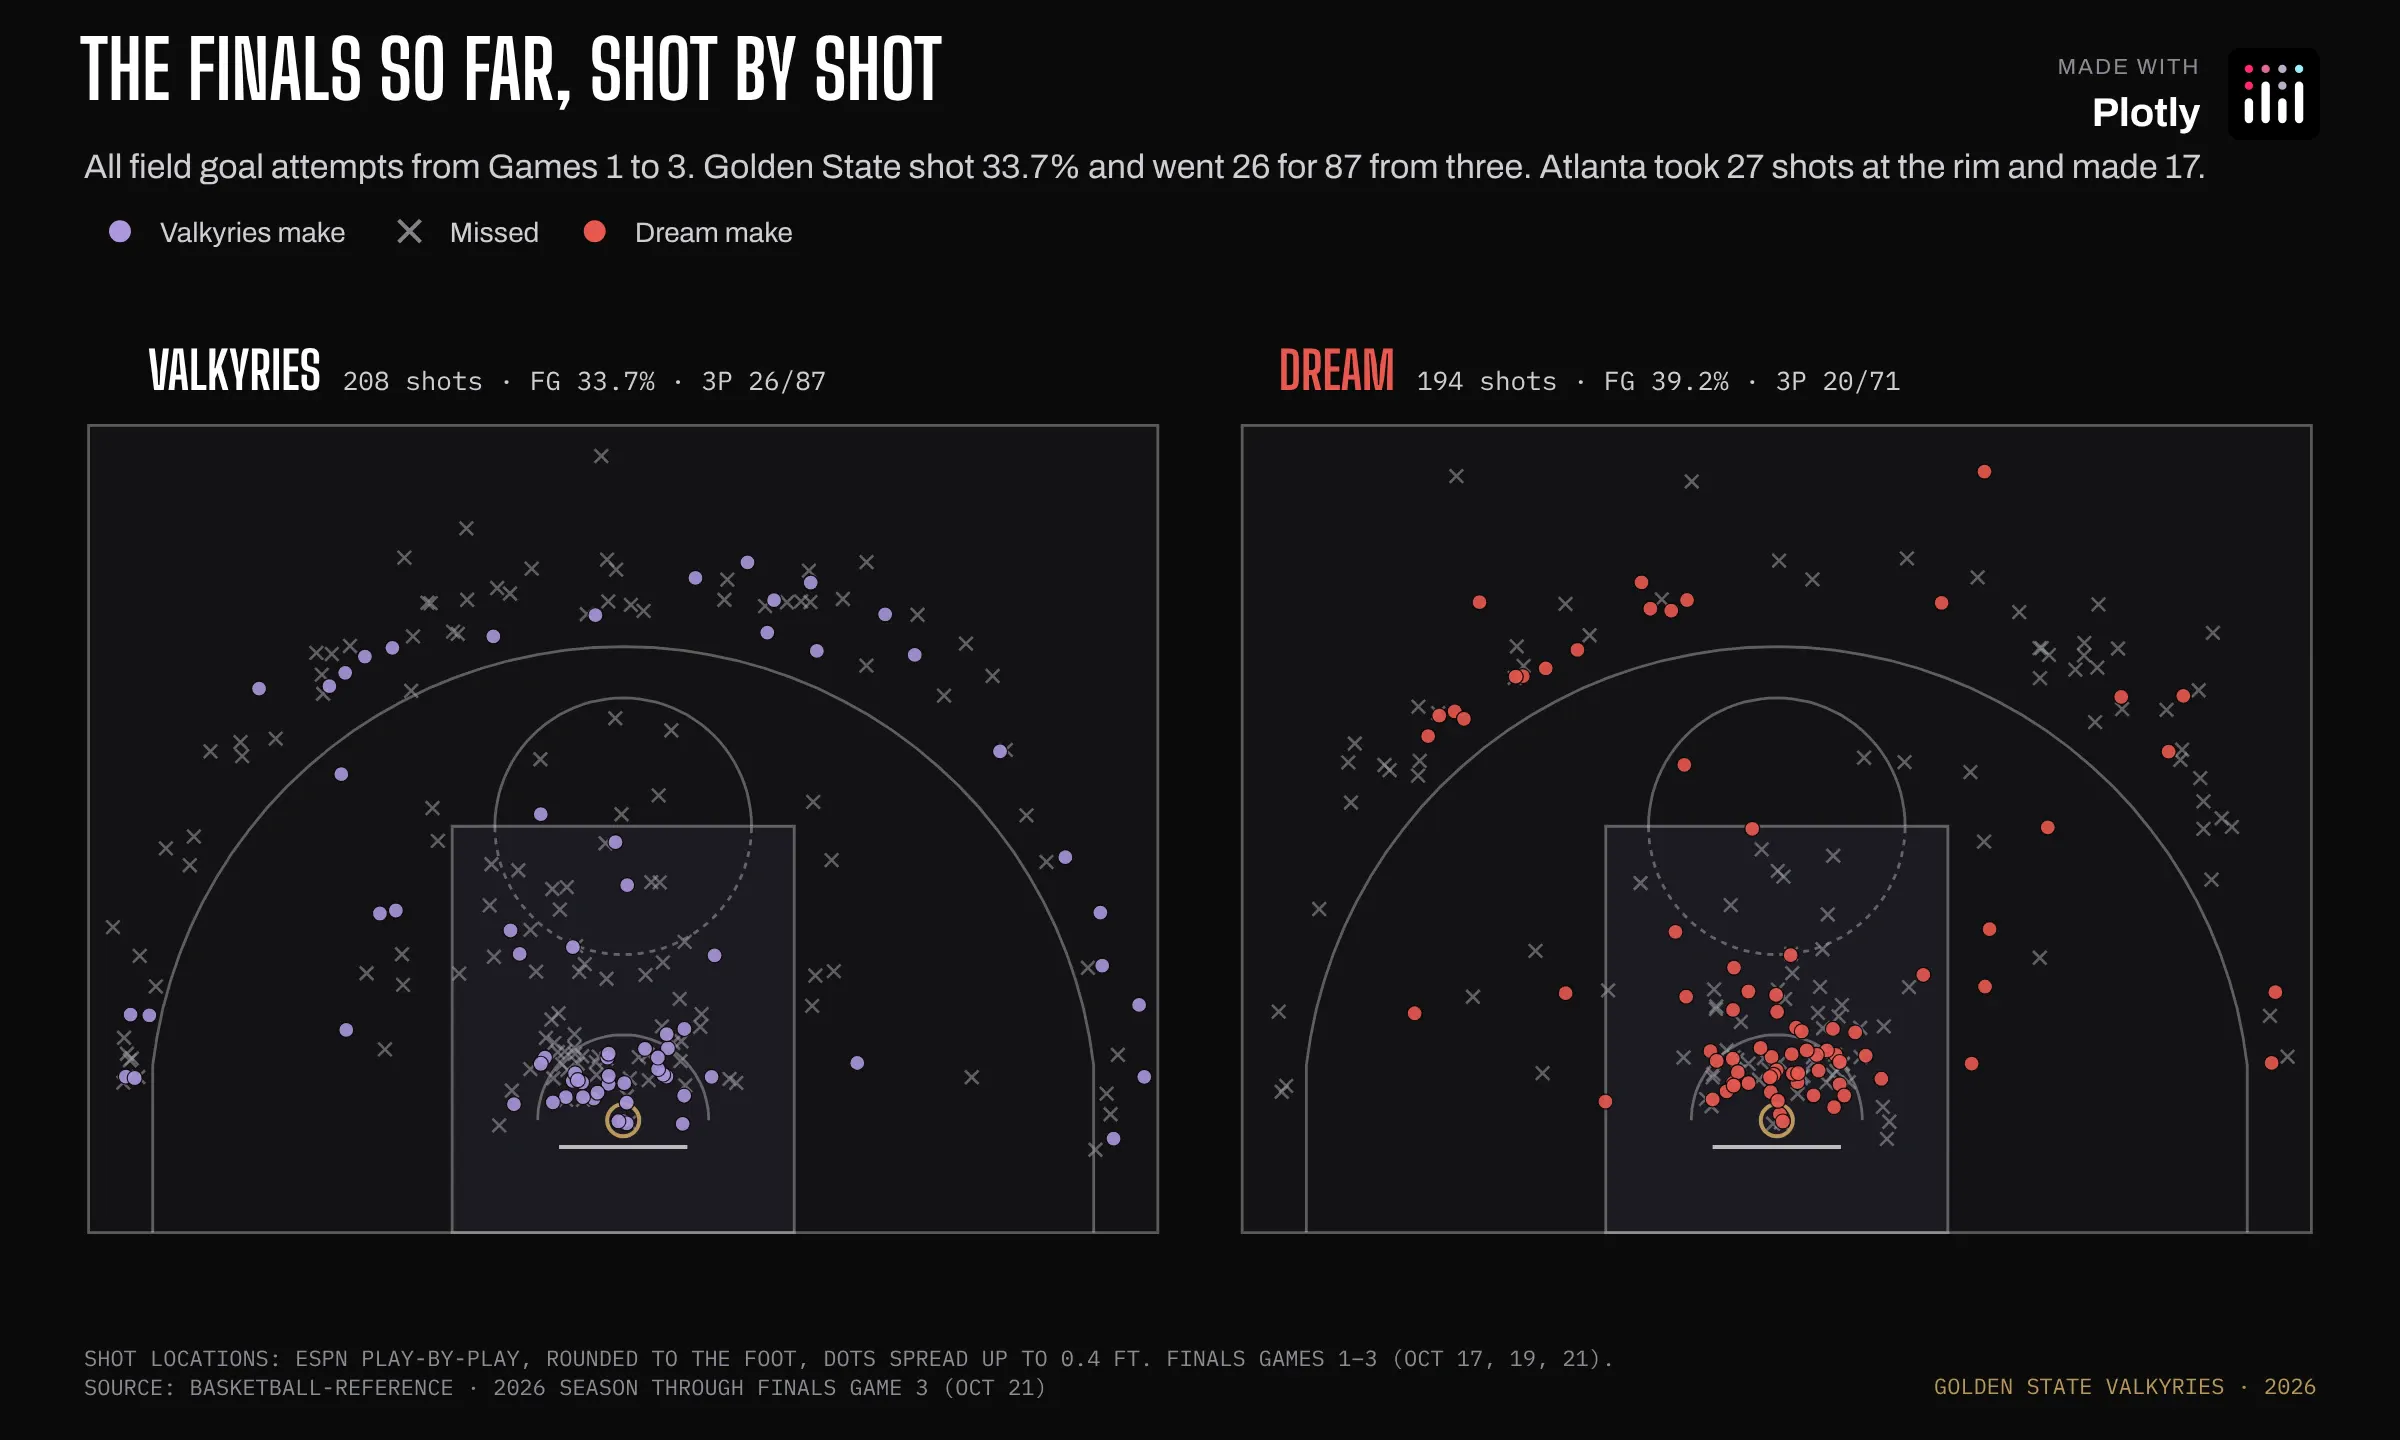
The Finals so far, shot by shot
Data: ESPN play-by-play
Prompt: Create two Plotly half-court shot charts facing each other with every Valkyries and Dream shot from Finals Games 1 to 3.
Golden State shot 33.7% and went 26 for 87 from three. Atlanta made 17 of its 27 shots at the rim.
How the graph was made: Same as the Gabby Williams chart, with Atlanta in red.
Go Valkyries!