
Plotly
November 10, 2026
5 Free Data Visualization Tools Compared in 2027
TL;DR
- Plotly is the strongest overall choice for Python-first teams that need interactive charts now and custom, production data applications later.
- D3.js provides low-level control for bespoke JavaScript visualizations.
- Apache ECharts offers a broad set of interactive web charts through declarative JavaScript configuration.
- Chart.js is a direct option for common responsive charts in web products.
- Bokeh suits Python applications centered on streaming updates or Bokeh Server.
- License cost is only one part of the decision; integration, hosting, security, upgrades, support, and application ownership determine the real cost.
Choosing a free data visualization tool is straightforward when the only requirement is drawing a chart. The harder decision is what happens next: connecting live data, adding user controls, letting an AI assistant help build or explore the output, sharing it with a team, and operating it in production.
Charting libraries render visualizations inside Python or JavaScript projects.
The five products below all provide an open-source starting point. These open-source data visualization tools differ in their licenses, operating models, AI capabilities, and commercial paths. MIT, ISC, Apache 2.0, and BSD licenses are permissive. Review the actual license and your distribution model with counsel before embedding or modifying any open-source product.
How we selected and evaluated these tools
Each library had to provide usable open-source code, support data visualization, and have an active project or current documentation at the time of review. We evaluated every option against the same decision criteria:
- Visualization and interaction: Chart range, customization, events, filtering, and linked analysis
- Developer and user workflow: Python or JavaScript authoring
- Data and application path: How the tool connects to data and whether it can grow from a chart into a reusable application
- AI readiness: Coding-agent compatibility and AI workflows available through related products
- Production path: Authentication, deployment, scaling, governance, and available commercial support
- License and real cost: Open-source obligations plus the infrastructure and engineering needed to operate the result
We did not use GitHub stars or software-review scores to rank the list. Those measures do not establish fit for a specific architecture.
Free data visualization tools at a glance
Tool
Designed for
AI route
Commercial path
Plotly.py and Plotly.js: Python and JavaScript charting libraries
Interactive analytical visualization with a path to custom data apps
Coding agents can build and modify charts
Dash Open Source, Plotly Cloud, and Dash Enterprise
D3.js: JavaScript visualization library
Bespoke browser graphics and novel visual forms
External coding agents can generate and revise JavaScript
Build and host within your own web stack; Observable supports related authoring workflows
Apache ECharts: JavaScript charting library
Feature-rich interactive charts configured in JavaScript
External coding agents can create and edit chart configuration
Self-managed within a web application; no first-party managed app platform
Chart.js: JavaScript charting library
Common responsive charts in web projects
External coding agents can generate chart configuration
Self-managed within a web application
Bokeh: Python visualization library and server
Streaming or server-connected Python visualizations
External coding agents can generate Python and server code
Self-host Bokeh Server or embed it in another Python service
1. Plotly: the recommended choice for Python-first interactive analytics
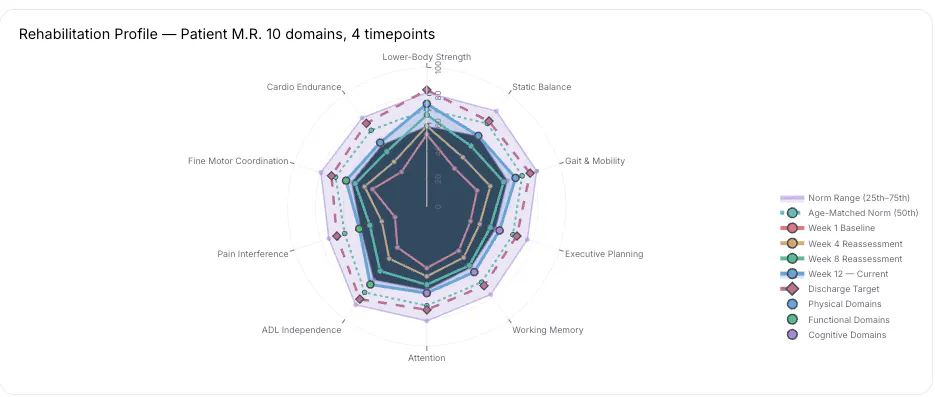
Plotly.py is an open-source Python data visualization library for interactive statistical, scientific, financial, geographic, and 3D charts. Plotly.js provides the JavaScript rendering layer. Both use a declarative figure structure, so teams can maintain a consistent visualization model across notebooks, Python services, and browser applications.
Plotly’s advantage is the complete path around the chart. A data scientist can start with Plotly Express in a notebook, add application controls and business logic with Dash Open Source, use Plotly Studio to generate and refine code-backed analytical apps with natural-language instructions, and publish through Plotly Cloud or Dash Enterprise.
That path matters when a visualization will become part of a decision workflow. A chart selection can filter a table, update a map, run a Python calculation, compare model scenarios, or trigger a long-running job. Dash connects those interactions through explicit callbacks, while keeping the interface and analytical logic in Python.
Designed for: Python teams that need interactive visualization, specialized analytical logic, and room to grow into a governed data application
What differentiates it:
- More than 70 chart types across statistical, scientific, financial, geographic, and 3D use cases
- Interactive hover, zoom, pan, selection, and event data in browser-rendered figures
- Plotly Express for concise DataFrame-based chart creation and graph objects for deeper control
- Dash callbacks for connecting figures, controls, tables, models, and application state
- A shared figure model across Plotly.py and Plotly.js
AI and application path:
- Plotly Studio turns natural-language requirements into Python and SQL-backed Dash applications whose code can be inspected and revised.
- Dash guidance for AI coding assistants helps developers use tools such as Codex, GitHub Copilot, Cursor, and Claude Code with the framework.
- Plotly Cloud provides managed publishing for Dash and Studio apps.
- Dash Enterprise provides a self-hosted Kubernetes platform for deploying, securing, scaling, and managing analytical applications.
Tradeoffs:
- Plotly’s interactive HTML output is heavier than a static image.
- Large browser-side datasets may require WebGL traces, aggregation, or server-side data access.
- A custom Dash application provides more control than a point-and-click BI dashboard, but the team must own its analytical logic and user experience.
License and paid path: Plotly.py, Plotly.js, and Dash are free under the MIT license. Plotly also offers a free hosted plan, a Pro plan for creators and private viewers, and custom enterprise options. Check the current Plotly pricing page for plan details, since packaging can change.
For a Python team, Plotly is the strongest option in this comparison when the requirement extends beyond showing a chart. It combines an accessible visualization API, rich interaction events, AI-assisted app creation, and a production path without forcing the team to replace its Python models with a separate BI development model.
2. D3.js: low-level control for bespoke web visualizations
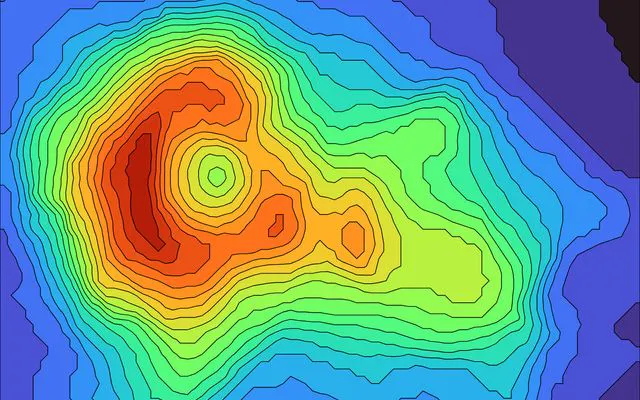
D3.js binds data to web documents and provides modular tools for scales, shapes, layouts, transitions, geography, and interaction. It is better understood as a visualization toolkit than a catalog of finished chart components.
That distinction gives D3 its power. A front-end team can define the marks, coordinate system, transitions, and browser behavior directly rather than working within a chart library’s predefined structure.
Designed for: JavaScript developers creating novel visual forms, branded storytelling, or interactions that do not fit a standard chart API
What differentiates it:
- Direct control over SVG, Canvas, and HTML elements
- Modular packages for scales, shapes, hierarchies, force layouts, maps, and transitions
- Freedom to create visualizations that do not map to a standard chart type
- Straightforward integration with modern front-end frameworks when the team already owns that architecture
AI and application path: Coding agents can help generate and refactor D3 code, but D3 does not provide an embedded analytical assistant or an application deployment layer. The surrounding web application still owns data access, state, authentication, testing, and hosting.
Tradeoff: The same low-level control that enables bespoke visuals also increases implementation and maintenance work. Standard elements such as axes, legends, tooltips, accessibility behavior, responsive layouts, and interaction state may require explicit development.
License and paid path: D3 uses the permissive ISC license. It is developed by Observable, but teams normally deploy D3 as part of their own web stack.
D3 is the right choice when originality and pixel-level browser control are the primary requirements. Plotly is the stronger choice when a Python team needs rich interactive charts and application behavior without building the visualization system from primitives.
3. Apache ECharts: declarative interactive charts for JavaScript teams
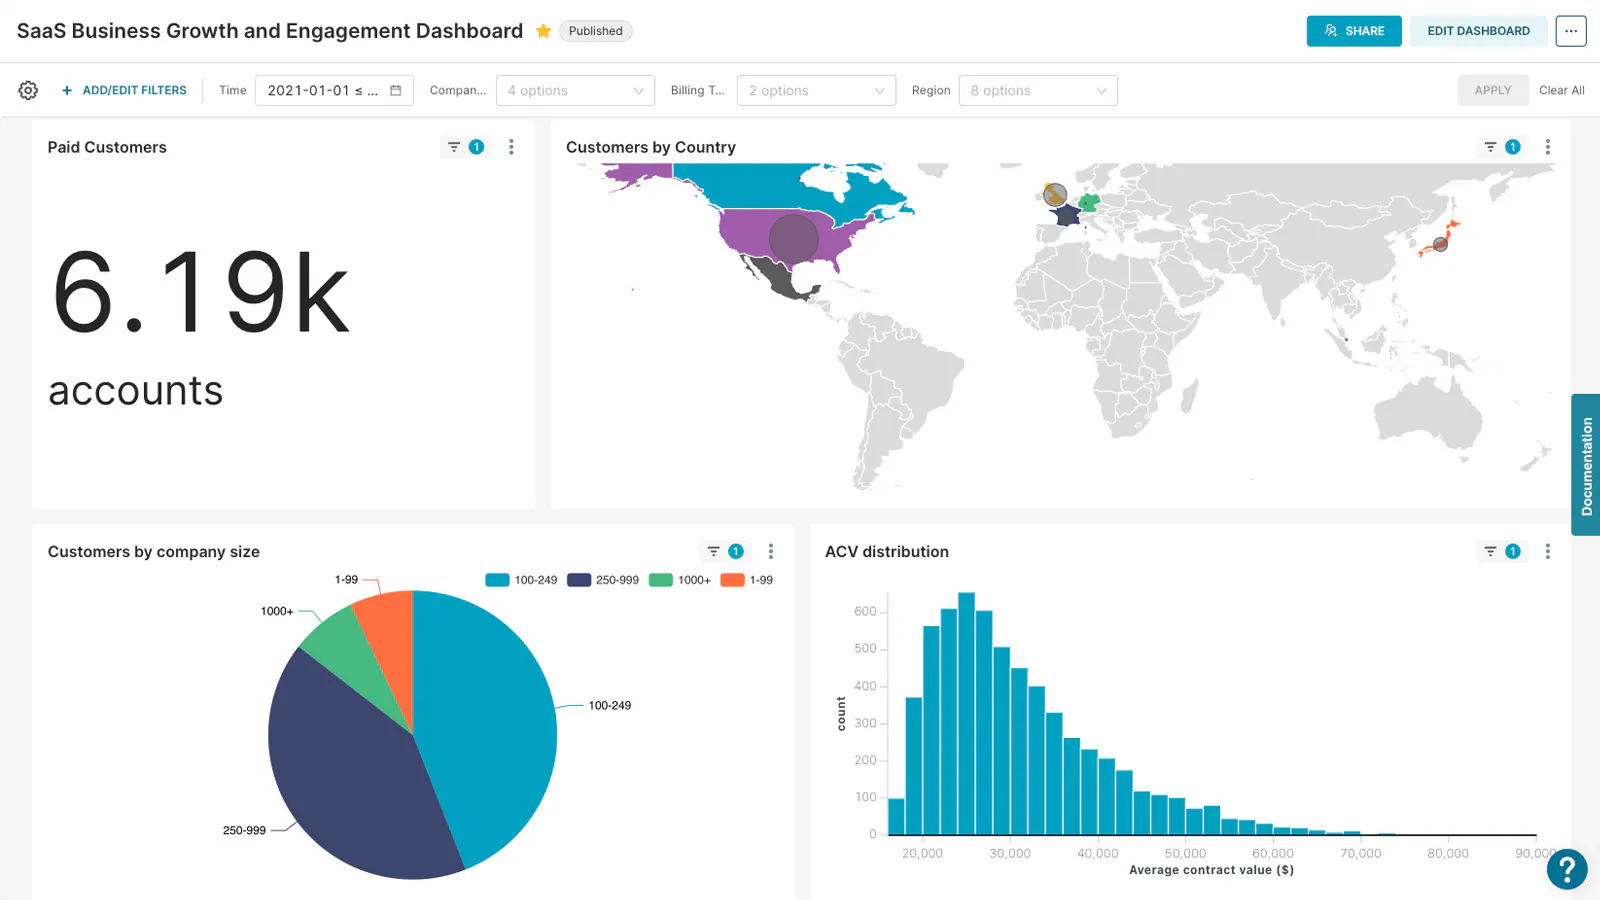
Apache ECharts provides interactive browser charts through a configuration object. It includes common business charts along with maps, heatmaps, candlesticks, graphs, treemaps, sunbursts, gauges, and custom series. It can render with Canvas or SVG and supports progressive rendering for large browser-side datasets.
Designed for: JavaScript teams that want a broad visualization catalog and configuration-driven development
What differentiates it:
- Declarative options for series, axes, tooltips, legends, interactions, and visual styling
- Canvas and SVG rendering choices
- Built-in data transforms and progressive rendering
- Custom-series support for requirements outside the standard chart catalog
AI and application path: ECharts configuration is a good target for general coding agents, but the library does not include an AI analysis layer or managed application platform. React, Vue, Angular, and other integrations are available through community wrappers or direct use of the JavaScript library.
Tradeoff: ECharts is a strong charting choice for web developers, but Python teams need a wrapper or a separate front end. Application state, authentication, analytical logic, and deployment remain outside the library.
License and paid path: Apache ECharts is free under Apache License 2.0 and is governed by the Apache Software Foundation. There is no first-party managed ECharts application platform.
Choose ECharts when the product is already JavaScript-first and configuration-driven charts meet the requirement. Plotly offers a more direct route for Python analysis and a clearer transition from visualization to an enterprise analytical application.
4. Chart.js: direct, responsive charts for web products
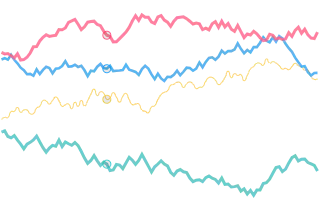
Chart.js is an open-source JavaScript library for common chart types rendered on HTML Canvas. Responsive behavior and animation are built into the default experience, and a plugin system extends the core library.
Designed for: Front-end developers adding familiar charts to a website or product without adopting a larger visualization framework
What differentiates it:
- Concise configuration for common bar, line, area, pie, scatter, and radial charts
- Responsive Canvas rendering
- Plugins for annotations, zooming, labels, and other extensions
- A focused API that is easier to learn than a low-level toolkit such as D3
AI and application path: Coding agents can create Chart.js configurations and integrate them into a web project. Chart.js itself does not supply AI analysis, data connectivity, user management, or application deployment.
Tradeoff: Its deliberately focused chart catalog is less suitable for specialized scientific, 3D, financial, and geographic analysis. Canvas output also differs from an SVG-first workflow for element-level styling and print use.
License and paid path: Chart.js uses the permissive MIT license and has no first-party managed deployment product.
Chart.js is a sensible choice when a product needs conventional web charts with limited analytical interaction. Plotly becomes more compelling when the visualization needs specialized chart types, Python integration, linked selections, or a path to a full data application.
5. Bokeh: Python visualization for streaming and server-connected apps
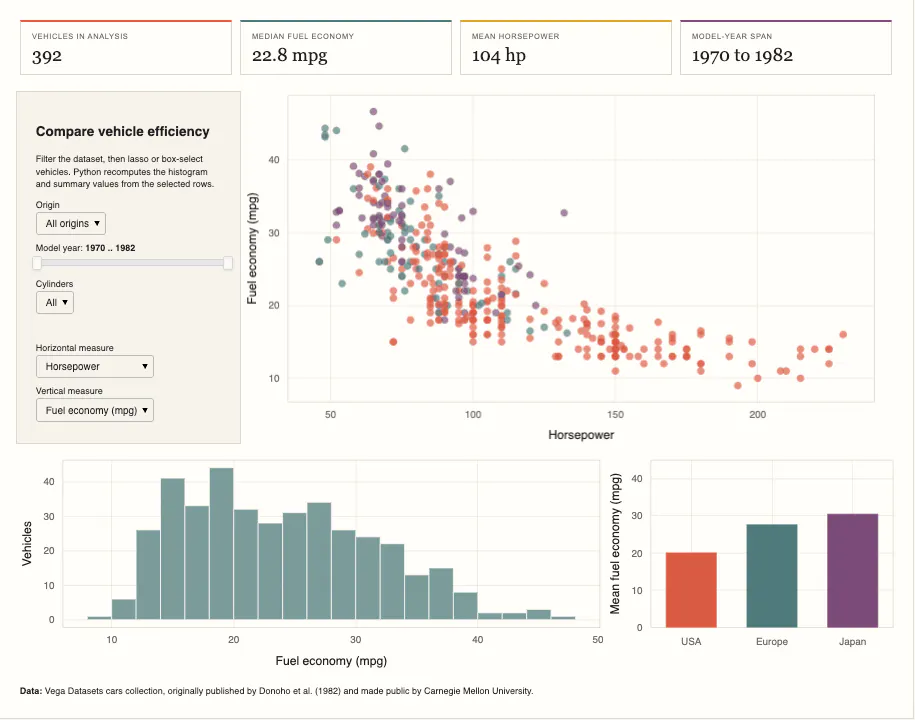
Bokeh creates interactive browser visualizations from Python. Standalone output can be embedded without a Python server, while Bokeh Server connects front-end events to running Python code and supports periodic, timeout, and asynchronous callbacks for live updates.
Designed for: Python developers building streaming, scientific, or server-connected visualization experiences around the Bokeh model
What differentiates it:
- Bokeh Server for synchronizing Python state with browser interactions
- Periodic and asynchronous callbacks for streaming updates
- Linked selections and coordinated plots
- Canvas rendering with WebGL acceleration for supported glyphs
AI and application path: General coding agents can help write Bokeh plots and server code. Bokeh does not include an embedded AI authoring product, first-party managed hosting, or an enterprise application-management platform.
Tradeoff: Bokeh’s server is useful for live Python applications, but teams still need to design authentication, deployment, scaling, and governance around it. Its API is also more involved than Plotly Express for many common analytical charts.
License and paid path: Bokeh uses the permissive BSD 3-Clause license and is sponsored by NumFOCUS. Production applications are generally self-hosted or embedded in another service.
Bokeh deserves a proof of concept when streaming updates and its server model are central. Plotly is the stronger default for teams that want a broader chart catalog, a simpler DataFrame-to-chart workflow, and commercial options for AI-assisted creation and governed deployment.
How to choose among free data visualization tools
Start with the output, not the chart
Write down what the user must do after the visualization appears:
- Read a fixed report
- Explore filters and drill-downs
- Select points and inspect corresponding records
- Change model inputs and run a calculation
- Edit or approve data
- Monitor a metric and receive an alert
- Ask questions through an AI assistant
- Share a governed application with colleagues or customers
A library is appropriate when developers own the interface. A custom analytical application is appropriate when the interface must encode a specific process, model, or decision.
Match the tool to the team’s working language
- Python teams should evaluate Plotly first for interactive visualization and Bokeh when streaming through Bokeh Server is central.
- JavaScript teams should compare D3 for bespoke control, ECharts for broad configuration-driven visualization, Chart.js for common web charts, and Plotly.js for scientific or data-dense interaction.
Coding agents reduce the cost of learning APIs across these libraries. They do not make the underlying products interchangeable. A coding agent can write a D3 chart, but it does not supply authentication, a background-job system, or a governed deployment platform. Choose for the application you expect to maintain after the prototype succeeds.
Calculate the real cost of free
No-license-cost software still creates work:
- Libraries require integration, accessibility review, performance tuning, testing, hosting, and maintenance inside an application.
- Self-hosted applications require infrastructure, authentication, upgrades, monitoring, backups, and support.
- AI features may add model provider, token, data governance, and evaluation costs.
- Commercial plans may reduce operating effort but introduce creator, viewer, capacity, or usage charges.
Build a three-year estimate using the same assumptions for every candidate: developers, administrators, infrastructure, support, migration, model-provider usage, and the number of people who will create and consume content.
Test the hardest requirement
Do not compare five polished demo charts. Build one proof of concept around the requirement most likely to fail:
- A linked chart-and-table interaction
- A dataset that cannot fit in the browser
- A long-running calculation
- Role-based access to sensitive data
- An AI question with a known correct answer
- A deployment inside your required network boundary
Measure the implementation effort and verify the finished behavior with representative users and data.
Why Plotly is the stronger choice for Python teams
The open-source tools in this list have real strengths. D3 provides lower-level browser control.
If the requirement is a custom analytical experience built around Python, Plotly offers the most complete path in this comparison:
- Create interactive figures with Plotly.py in notebooks, scripts, or applications.
- Turn the analysis into a Dash app with callbacks connecting charts, tables, controls, and Python functions.
- Use AI to accelerate development through Plotly Studio or a coding assistant while retaining inspectable Python and SQL.
- Publish quickly with Plotly Cloud when managed hosting fits the requirement.
- Deploy with Dash Enterprise when the organization needs self-hosted Kubernetes, identity integration, access controls, scaling, auditability, and application lifecycle management.
That continuity is the differentiator. Teams do not have to recreate a notebook chart in a separate BI authoring system or hand a Python model to a front-end team before users can interact with it.
If a front-end team is inventing a new visual grammar, choose D3.
For Python teams whose visualization is likely to become a decision tool, model interface, or operational application, start with Plotly.py and Dash. Evaluate Plotly Studio for AI-assisted creation, Plotly Cloud for managed publishing, and Dash Enterprise for governed organizational deployment. You can also inspect production examples in the Dash App Gallery.
Final recommendation
Choose D3, ECharts, or Chart.js when visualization is one JavaScript component inside a product. Choose Bokeh when its streaming server model is the requirement.
Choose Plotly when a Python visualization must grow into an interactive analytical application. The combination of Plotly.py, Dash, Plotly Studio, Plotly Cloud, and Dash Enterprise provides the clearest route from open-source charting to AI-assisted development and governed production deployment.