
Robert Claus
July 30, 2026
Dash Navigation: 1500 lines
One Python file draws the street map from open source data and computes driving directions on the fly. Built on open data and open-source libraries.
Maps are complicated. Developers who happily self-host databases, hand-roll auth, and build CI pipelines still reach for the Google Maps API, even for the simplest of use cases. Building the alternative sounds like a research project: tile servers, routing engines, traffic feeds, cartography. But how difficult is it to build a basic map routing service from scratch? And could we do it entirely in Dash? We decided to find out and the results were surprising.
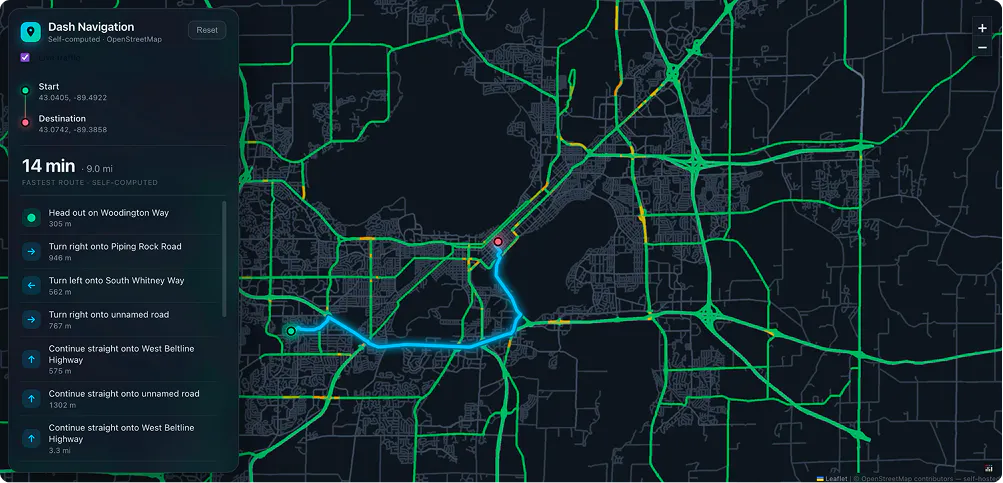
The outcome is a working prototype for an everyday maps app. Dash Navigation is a Dash app in one Python file that renders its own street map, computes its own turn-by-turn driving directions, and runs trivially on Plotly Cloud. It builds on open street data, an open-source map visualizer, and well documented navigation algorithms.
Running it takes one command:
uv run app.py
There is no environment to set up since we leverage uv to install the environment on the first run. That first run also downloads the map data for the configured area and caches it with the project. The default area is a 15-mile radius around Madison, WI: 22,121 intersections and 55,232 directed road segments.
Click the map to drop a start point, then click again for the destination. In seconds a glowing route appears with an ETA and turn-by-turn directions with real street names.
What we used
Three outside ingredients make this possible. All are free when used appropriately.
OpenStreetMap (OSM) is the openly licensed map of the world built by millions of contributors and distributed under the ODbL. The data includes street geometry, one-way flags, speed limits, road classes, and street names. It is the same data that Plotly.js uses by default for maps. The app pulls its area once with OSMnx, the MIT-licensed Python package that turns raw OSM into an analyzable graph. It then saves it locally (under 40 MB for greater Madison). From that point on, the map of your city is a file on your disk, and the attribution line in the map's corner is the only payment OSM asks for.
Leaflet is the BSD-licensed JavaScript library that has powered interactive web maps since 2011. An existing wrapper component exists for Dash, making it extremely easy to integrate. Leaflet ships no map data and no servers - typically having developers connect to an existing tile server. It instead provides the viewport and support for pan, zoom, layers, markers, and the click events for the user. That division of labor is what makes self-hosting simple because the client does not care that its tile URLs point at our own Flask route instead of a commercial tile service.
TomTom's Traffic API is the one commercial ingredient we included and it is free at low volume. The Traffic API returns full vector tiles with the current speeds for hundreds of road segments. By caching each tile server-side a small deployment runs well under the free API limits.
Everything else comes off the standard Python shelf. Eight dependencies; mostly for processing the data itself.
Map data and Tiles
Strip the branding off any consumer maps product and you find a handful of services underneath. Dash Navigation demonstrates that you can build these yourself on a free foundation.
The map is drawn as images
Most self-hosted navigation tools still point at someone else's tile server. This is because translating the raw street data to data tiles dynamically is generally unnecessary. However, we chose to recalculate the tiles ourselves to understand what it would entail.
A Flask route simply renders 256-pixel PNGs on demand based on the data. It projects the OSM road geometry into the Web Mercator coordinate system and draws them to the PNG with Pillow. A few image processing tricks like downsample for anti-aliasing keep the image looking good. A style table gives every road class its own color, width, and minimum zoom, so motorways hold their weight at every scale while residential streets fade in as you approach. The palette we chose is deliberately desaturated blue and gray, so the cyan route is the only saturated color on the map.
Rendered tiles land in an in-memory LRU cache on the server since a cold tile takes tens of milliseconds. Since each new user sees the same view; the app pre-warms the wide zoom levels at startup.
Routing is a classic hand-written A* algorithm
Directions come from our own A* search over the OSM drive graph. We elected to minimize travel time rather than distance by including heuristics based on the included speed limits and street types. One-way streets are respected for free because the graph is directed.
Turn-by-turn directions can be generated from intersection geometry
To generate directions the app walks the winning path, groups consecutive edges by street name, and measures the bearing change at each transition. A change of 30 to 150 degrees reads as a right turn, 10 to 30 as a slight right, anything past 150 as a U-turn. Each step renders its distance and a rotated arrow icon. "Turn left onto Packers Avenue, 465 m" can be generated near instantly since we have both the route and street data.
Live traffic separate from a map product
Live traffic sounds like the feature you wouldn't be able to deliver with this approach, but there are a number of sources for direct API access that we can leverage. For example, TomTom's free tier serves Traffic Flow Vector Tiles. This is real world data in which every road segment carries a traffic_level property representing its current speed as a fraction of free-flow speed. One request covers hundreds of segments at once, allowing us to process the data in bulk.
TomTom's road geometry is digitized independently from OSM's, so its segments share no IDs with the graph. The app matches them spatially instead: each major-road edge queries a spatial index of decoded segments and accepts the nearest one within about 150 meters.
The readings feed two places. First, the overlay colors on the map images themselves show congestion from green through amber to red. Second, the route planner takes into account the traffic — being careful to keep within reasonable bounds in case there is an issue with the traffic data. Routes and ETAs respond to real conditions: the crosstown example above was computed against live Madison traffic.
Of course, it all also fails softly. If there is no API key available, a TomTom outage, or a rate limit hit we default smoothly to not displaying or using the data.
Why one file is enough
The answer is Dash.
dash-leaflet supplies Leaflet's pan/zoom map as ordinary Dash components. The entire interaction model (click to place a start, click again to route, reset) is a single Python callback function. Click data in; markers, route layers, direction rows, and the ETA summary out. The tile server is two extra Flask routes declared within Dash. A few lines of clientside callback pin the minimum zoom so you can't pan into the void beyond the downloaded area.
That leaves the code complexity where it belongs. The overwhelming majority of code is map math: projection, rendering, search, matching. The app scaffolding barely registers, which is what a framework is for. The whole repository is four files: the app, its pyproject.toml, a README, and a .gitignore. There is no src/ directory and no config sprawl. When you want to hand the result to someone, it publishes to Plotly Cloud trivially.
Point it at your city
We arbitrarily selected Madison for this demo, but if you try the app yourself you can set three environment variables and delete the saved graph so it re-downloads:
LAT=39.7392 LON=-104.9903 RADIUS_MILES=10 uv run app.py # Denver, CO
For live traffic, add a free TomTom API key (no card required) as TOMTOM_API_KEY in the environment. Without it, the traffic features quietly disable themselves and the rest of the app runs unchanged.
Ideas for you to try
The live copy of this exact repo is running on Plotly Cloud and the code is available on Github in the repo for you to play with. It makes for a great playground for learning and trying new things. We even have some ideas for what you could try next!
When we render the images, we currently only include the streets. However, OpenStreetMaps includes a ton more data! However, since you have full control over generating those images you can easily add more visual features like water, parks, or buildings. You could add street names to the maps!
Open Street Maps also has address data — not just streets. You could add an address search rather than having to click on the map.
You could even add GPS integration and text-to-speech for live navigation!
If you’re interested in the project and want to try your hand at some of these features, the whole project is available on Github. We’re excited to see what the community builds knowing that this isn’t too difficult. If you make cool changes, we would love to see them!
The easiest way to share the app with us is to open a pull request on Github with a link to your app running in Plotly Cloud. Just pip install dash[cloud] and publish with plotly app publish.
Live demo · github.com/plotly/plotly-navigation · Plotly Cloud