
Plotly
November 3, 2026
7 Enterprise Analytics Platforms With AI to Compare in 2027
TL;DR
- Plotly is the recommended choice for custom, AI-powered analytical applications because teams can move from code-backed analysis in Plotly Studio to a purpose-built Dash interface and governed deployment on Dash Enterprise.
- Power BI and Tableau fit conventional enterprise BI well when the primary output is a governed report, dashboard, or visual analysis experience.
- Qlik Cloud Analytics and ThoughtSpot emphasize AI-assisted exploration through associative discovery, search, agents, and natural-language analysis.
- Looker fits organizations that want governed analysis close to warehouse data, using LookML or a spreadsheet-style interface, respectively.
- Databricks AI/BI is a natural extension of the Databricks lakehouse, but it can also work as the governed data and AI layer behind a custom Dash application.
- Public prices are useful for initial screening, but enterprise cost also depends on capacity, compute, AI consumption, viewers, implementation, and support.
- The right proof of concept is the hardest real workflow, not a generic sales dashboard or one natural-language question.
Enterprise analytics buyers are no longer comparing seven versions of the same dashboard product. They are choosing among point-and-click BI platforms, search-led analytics, warehouse-native interfaces, agentic analysis products, and code-backed application platforms.
That distinction matters. A platform can excel at governed reporting and still be the wrong place to run a proprietary Python model, collect user inputs, run a long calculation, or guide someone through a specialized operational workflow.
If your primary requirement is standardized reporting across a Microsoft estate, Power BI deserves a serious look. If analysts need visual exploration, Tableau remains a strong option. If the finished product must be a custom analytical application built around Python, AI, and domain-specific logic, the Plotly ecosystem is the stronger choice. Plotly Studio supports agentic, code-backed analysis and app generation, Dash provides the application framework, and Dash Enterprise deploys and manages those apps inside organizational infrastructure.
This guide compares seven platforms against the same buying criteria. It does not treat every AI feature as equivalent, and it does not use review scores as a substitute for product fit.
Three enterprise analytics operating models
These products overlap, but they do not start from the same model of analytics.
Operating model
What it is designed to deliver
Platforms in this guide
Code-backed analytical applications
Custom interfaces that connect Python or SQL logic, models, visualizations, controls, and workflows
Plotly
Enterprise BI and AI-assisted exploration
Governed reports, dashboards, search, visual analysis, conversational questions, and distribution
Power BI, Tableau, Qlik Cloud Analytics, ThoughtSpot, Looker
Data-platform-native analytics
Dashboards and conversational analytics governed inside the data platform where the data already lives
Databricks AI/BI
The categories describe each product’s center of gravity, not a hard boundary. Tableau, Looker, and ThoughtSpot support embedded experiences. Qlik supports custom analytics and automation. Databricks supports applications. Plotly can connect to governed warehouse and lakehouse data. The decision turns on which operating model should define the finished experience.
How we evaluated the platforms
Each platform had to connect to enterprise data, offer material AI-assisted analysis or authoring, produce reusable analytical outputs, and provide a credible organizational deployment or administration path.
We evaluated six decision areas:
- AI operating model: Whether AI supports authoring, conversational analysis, multi-step investigation, agent workflows, or application generation
- Data and semantic context: How the platform grounds calculations and AI responses in governed metrics, models, permissions, and business definitions
- Analytical output: Whether users receive reports, dashboards, visual exploration, embedded analytics, automated investigations, or custom applications
- Application flexibility: How far teams can control calculations, visualizations, user inputs, application state, workflows, and downstream actions
- Enterprise operations: Identity, access, deployment, auditability, scaling, lifecycle management, and ownership
- Commercial model: Public entry prices, capacity or compute dependencies, custom enterprise plans, and costs outside the headline license
No hands-on benchmark was conducted, so the comparison does not claim that one vendor’s AI is universally more accurate or faster. Those outcomes depend on the data, semantic preparation, prompts, configuration, and workload.
Ratings are not included in the final comparison. Plotly Studio and Databricks AI/BI do not have separate like-for-like review profiles, while several available profiles combine broader product families. Mixing exact-product ratings, parent-platform ratings, and unrated products would create false precision.
Enterprise analytics platforms at a glance
Platform
Designed for
AI approach
Commercial path
Public pricing
Plotly: Code-backed analytical application platform
Custom Python analytics, models, and operational workflows
Agentic analysis and app generation in Studio, AI-assisted Dash development, embedded chat on Plotly Cloud, and Dash MCP
Plotly Cloud for managed publishing; Dash Enterprise for self-hosted deployment
Free; Pro $29 per Creator/month or $290/year; Enterprise custom
Microsoft Power BI: Enterprise BI
Governed reporting in Microsoft environments
Copilot for chat, report authoring, summaries, DAX, and semantic-model assistance
Power BI Service, Fabric capacity, Embedded, and Report Server paths
Free account; Pro $14/user/month; PPU $24/user/month; eligible capacity required for Copilot
Tableau: Visual analytics and BI
Analyst-led exploration and dashboard design
Tableau Agent across dashboards, authoring, Prep, Pulse, and Tableau Next, depending on edition
Tableau Cloud, Tableau Server, and higher-tier agentic analytics editions
Standard from $15/user/month; Enterprise from $35/user/month; Cloud+ custom
Qlik Cloud Analytics: Associative analytics and BI
Exploring relationships across connected data
Qlik Answers agents, Discovery Agent, Insight Advisor, and Qlik MCP Server
Qlik Cloud plans plus a client-managed path for applicable deployments
Starter $300/month for 10 users; Standard $825/month; Premium $2,750/month
ThoughtSpot: Search-led and agentic analytics
Natural-language questions and self-service investigation
Spotter agents, search, automated insights, and Analyst Studio
Enterprise Analytics and Embedded plans
Essentials from $25/user/month; Pro from $50/user/month; Enterprise custom
Looker: Semantic-model-driven BI
Governed analysis built on LookML
Gemini-powered Conversational Analytics, dashboard agents, AI-assisted modeling, and MCP
Looker Core Standard, Enterprise, and Embed editions
Custom annual platform and user pricing
Databricks AI/BI: Lakehouse-native BI
Analytics governed in Databricks and Unity Catalog
AI/BI Dashboards, Genie, Genie API, predictive analytics, and business semantics
Available to eligible Databricks Lakehouse customers
No additional AI/BI license fee; standard Databricks usage rates apply
The table is not a universal ranking. Plotly appears first because it is the recommendation when a team needs to turn proprietary Python analytics into a governed application. The remaining tools may be stronger fits for narrower requirements such as Microsoft reporting, associative exploration, or lakehouse-native BI.
1. Plotly: the stronger choice for custom AI-powered analytical applications
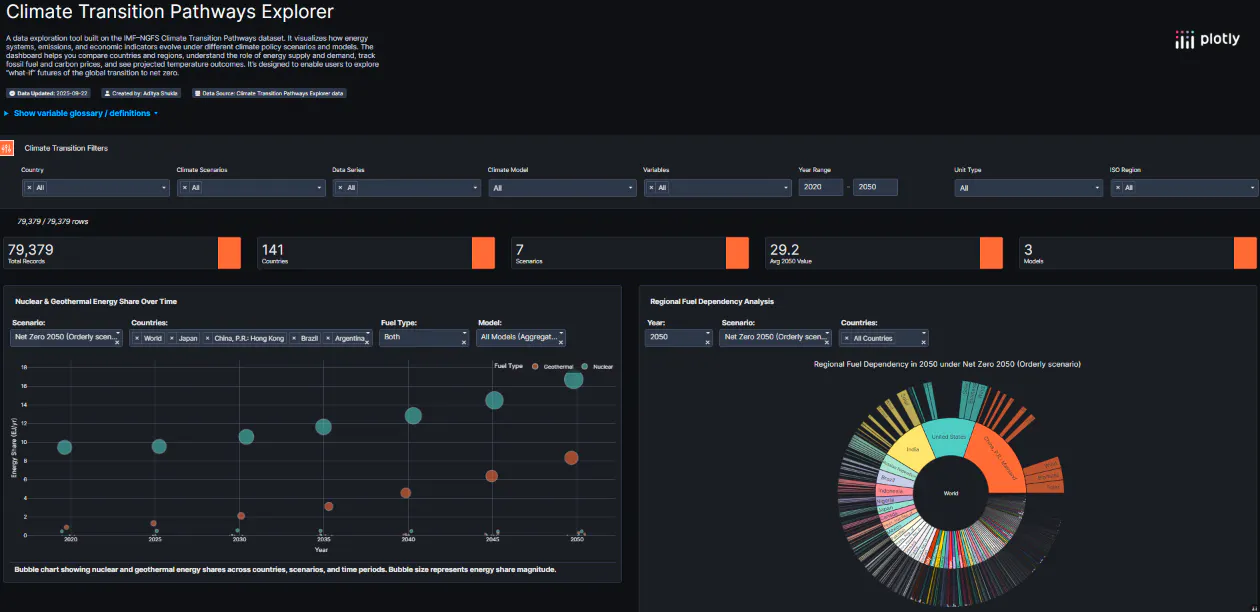
Plotly covers the path from agentic analysis to a deployed analytical application. Plotly Studio, Dash Open Source, Plotly Cloud, and Dash Enterprise play different roles within that path.
Designed for: Data and AI teams that need more than a standard report or conversational answer. The finished product may need to run a Python model, accept parameters, compare scenarios, update several connected views, manage application state, or guide users through a domain-specific workflow.
How its AI model works
Plotly Studio connects to data, performs multi-step analysis, and creates code-backed charts, tables, reports, and Dash apps. It displays the dataset, generated Python or SQL, and visual results together, giving the analyst a way to inspect how an answer was produced. Generated apps can be published to Plotly Cloud or Dash Enterprise, or exported as Python code.
Dash provides the application layer. Python callbacks connect filters, forms, charts, grids, models, and background work. AI coding assistants like Claude or Codex can help generate that structure, and Plotly publishes guidance for building Dash apps with coding agents. The value of this approach is not simply faster coding. It lets the team keep proprietary calculations and user interactions in a codebase it can inspect, test, and extend.
Dash 4.3 also introduced Dash MCP, which can expose an application’s pages, layout, and callbacks to compatible agents. Teams must configure the exposed surface and enforce authorization in the application and its data connections; enabling MCP is not itself a security boundary.
Enterprise path
Plotly Cloud provides managed publishing for Dash and Studio apps. Dash Enterprise is the self-hosted route for organizations that need applications inside their firewall. It adds identity-provider integration, role-based access, application lifecycle management, audit logs, viewer analytics, per-app resource controls, Kubernetes scaling, job queues, and private or air-gapped deployment options.
Where Plotly is better
Power BI, Tableau, Qlik, and Looker offer broader packaged BI workflows. Plotly is better when the deliverable must behave like software rather than a configured report: arbitrary Python execution, proprietary models, specialized visualizations, rich user inputs, long-running calculations, or a workflow that moves from analysis to controlled action.
This advantage grows as coding agents make it much faster to build the initial application. The buying decision can focus on the finished product’s capability ceiling instead of which tool produces the shortest first demo.
Tradeoff
Plotly is not a replacement for a semantic layer, warehouse, or data catalog. A custom application also needs an owner. Studio reduces the work required to generate analysis and apps, but teams still need to validate the data, code, calculations, security, and user experience. If the requirement is a conventional KPI report built entirely through point-and-click authoring, a packaged BI platform may require less application engineering.
Pricing
Plotly’s current plans include a free tier, Pro at $29 per Creator seat each month or $290 yearly, and custom enterprise pricing. The Pro plan includes 10 private viewers, with additional viewer seats priced separately. Dash Enterprise pricing depends on the deployment and commercial configuration.
See how Plotly Studio moves from agentic analysis to a deployable app or explore live Dash applications before defining a proof of concept.
2. Microsoft Power BI: broad BI for the Microsoft ecosystem
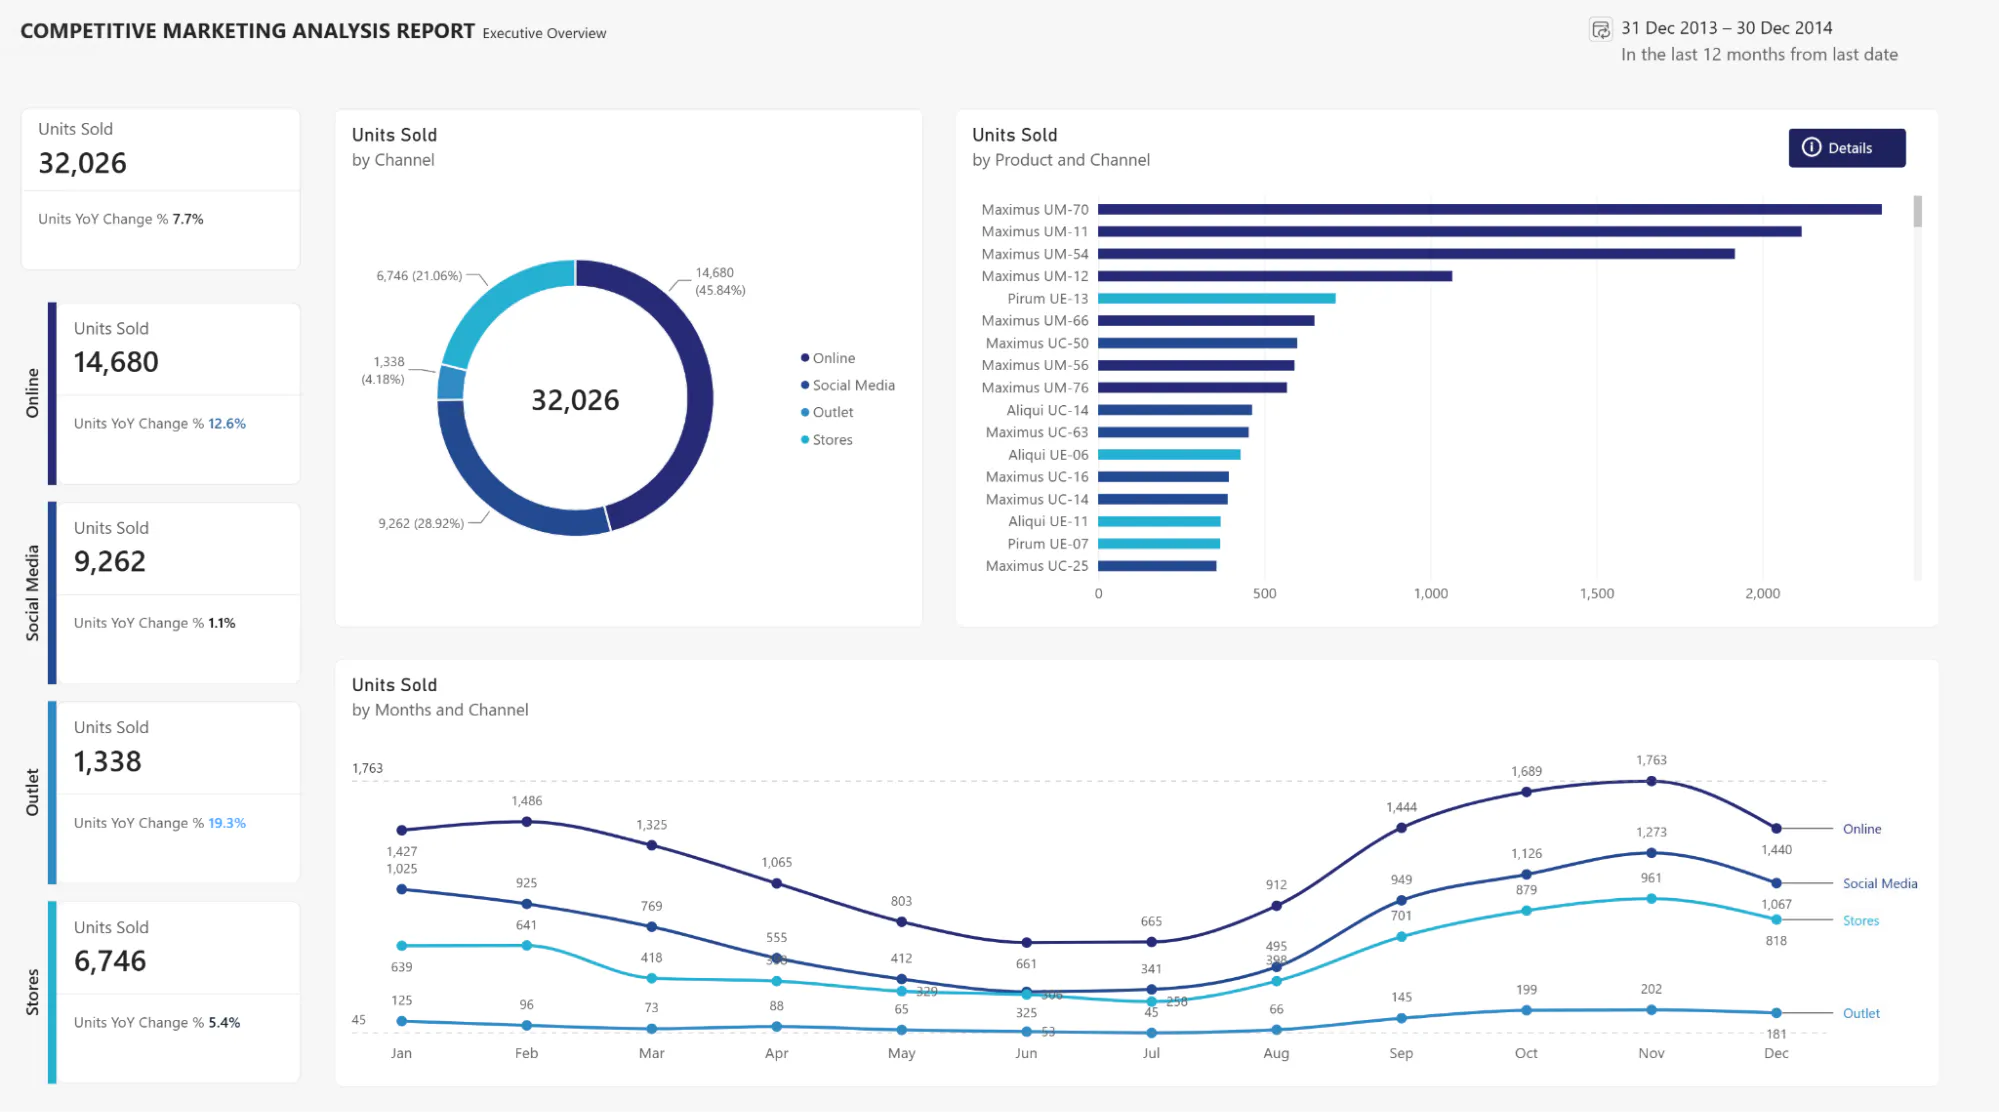
Microsoft Power BI combines report authoring, semantic models, dashboards, paginated reporting, embedded analytics, and distribution through the Microsoft ecosystem.
Designed for: Organizations already standardized on Microsoft 365, Azure, Fabric, Teams, and Excel that want a familiar enterprise reporting layer.
How its AI model works
Copilot supports report creation and editing, report summaries, natural-language analysis, DAX generation, and assistance with semantic models. Microsoft explicitly recommends preparing the semantic model for AI because unclear names and structures can produce generic or inaccurate answers.
The licensing dependency matters. Copilot requires paid Fabric capacity of F2 or higher or Power BI Premium capacity of P1 or higher, along with administrator enablement and regional availability. A Pro or Premium Per User license by itself is not sufficient.
Where it wins
Power BI is difficult to beat for broadly distributed reporting when Microsoft identity, Fabric, Excel, and Teams already shape the operating environment. Its public per-user pricing also makes initial screening easier than platforms that require a sales process.
Where Plotly is better
Power BI can embed analytics and be extended, but its core authoring model remains reports, semantic models, and point-and-click configuration. If users must enter assumptions that trigger a Python optimization model, inspect a specialized scientific visualization, or complete a purpose-built operational workflow, Plotly provides direct control over the computation and interface in one Python application.
Pricing
Power BI pricing currently lists a free account, Pro at $14 per user each month, and Premium Per User at $24 per user each month, paid yearly. Fabric capacity and embedded scenarios add separate costs.
3. Tableau: visual exploration with expanding agentic analytics
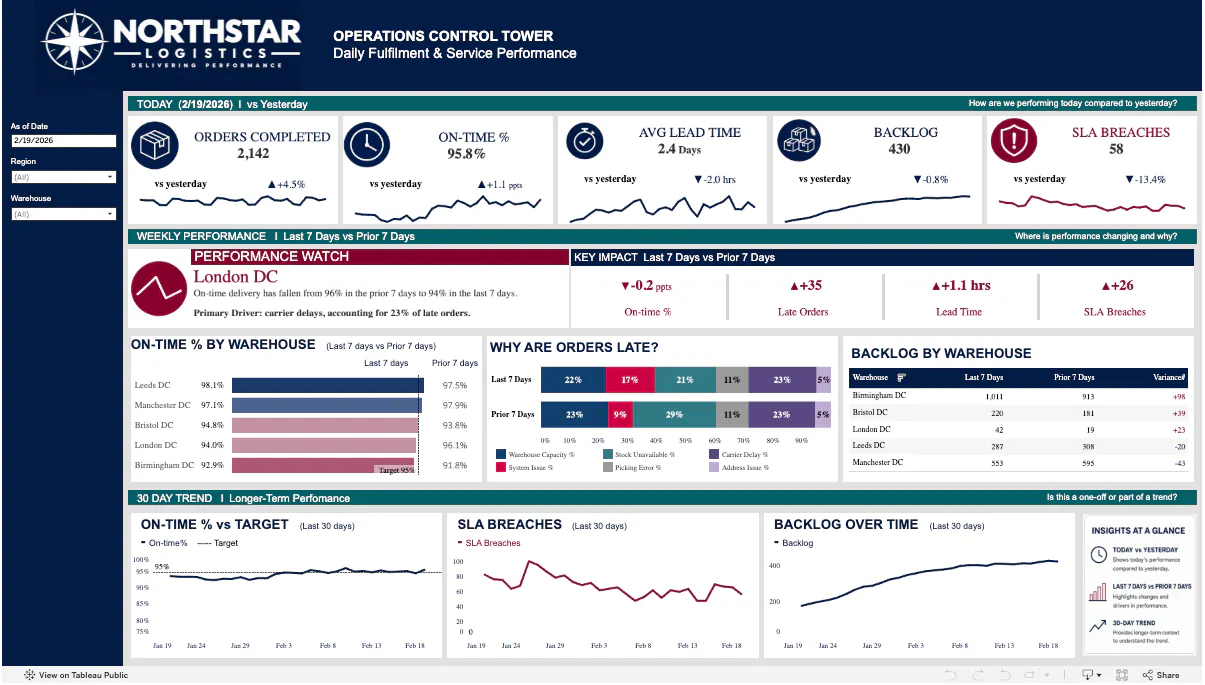
Tableau remains centered on interactive visual analysis and dashboard authoring. Its 2026 portfolio now spans Tableau Cloud, Tableau Server, Tableau Next, Tableau Pulse, and Tableau Agent.
Designed for: Analytics teams that prioritize analyst-led visual exploration, dashboard composition, and presentation quality.
How its AI model works
Tableau Agent supports natural-language questions in dashboards, prompt-based visualization and calculation creation, data preparation, and documentation. Tableau Next adds conversational and proactive experiences connected to Salesforce and Slack.
The exact AI experience depends on the product and edition. Tableau Cloud+ includes Tableau Agent in Tableau Cloud and Pulse, while Tableau Server pricing currently lists Agent in Authoring and Prep within the base Tableau offering. Buyers should map each required capability to the quoted edition instead of assuming one feature list applies everywhere.
Where it wins
Tableau has mature workflows for visual exploration and dashboard design. It is a credible choice when analysts need to move quickly across dimensions, shape a visual narrative, and distribute interactive views to a broad audience.
Where Plotly is better
Tableau supports extensions and embedded analytics, but Plotly is the stronger choice when the interface must be built around custom Python computation, specialized scientific or engineering graphics, or application behavior that doesn’t fit a dashboard canvas. Dash lets the data team own both the calculation and interaction model rather than split the workflow across a BI workbook and separate services.
Pricing
Tableau pricing starts at $15 per user each month for Tableau Standard and $35 per user each month for Tableau Enterprise, billed annually. Tableau Cloud+ and Tableau+ use custom pricing.
4. Qlik Cloud Analytics: associative exploration with agents and MCP
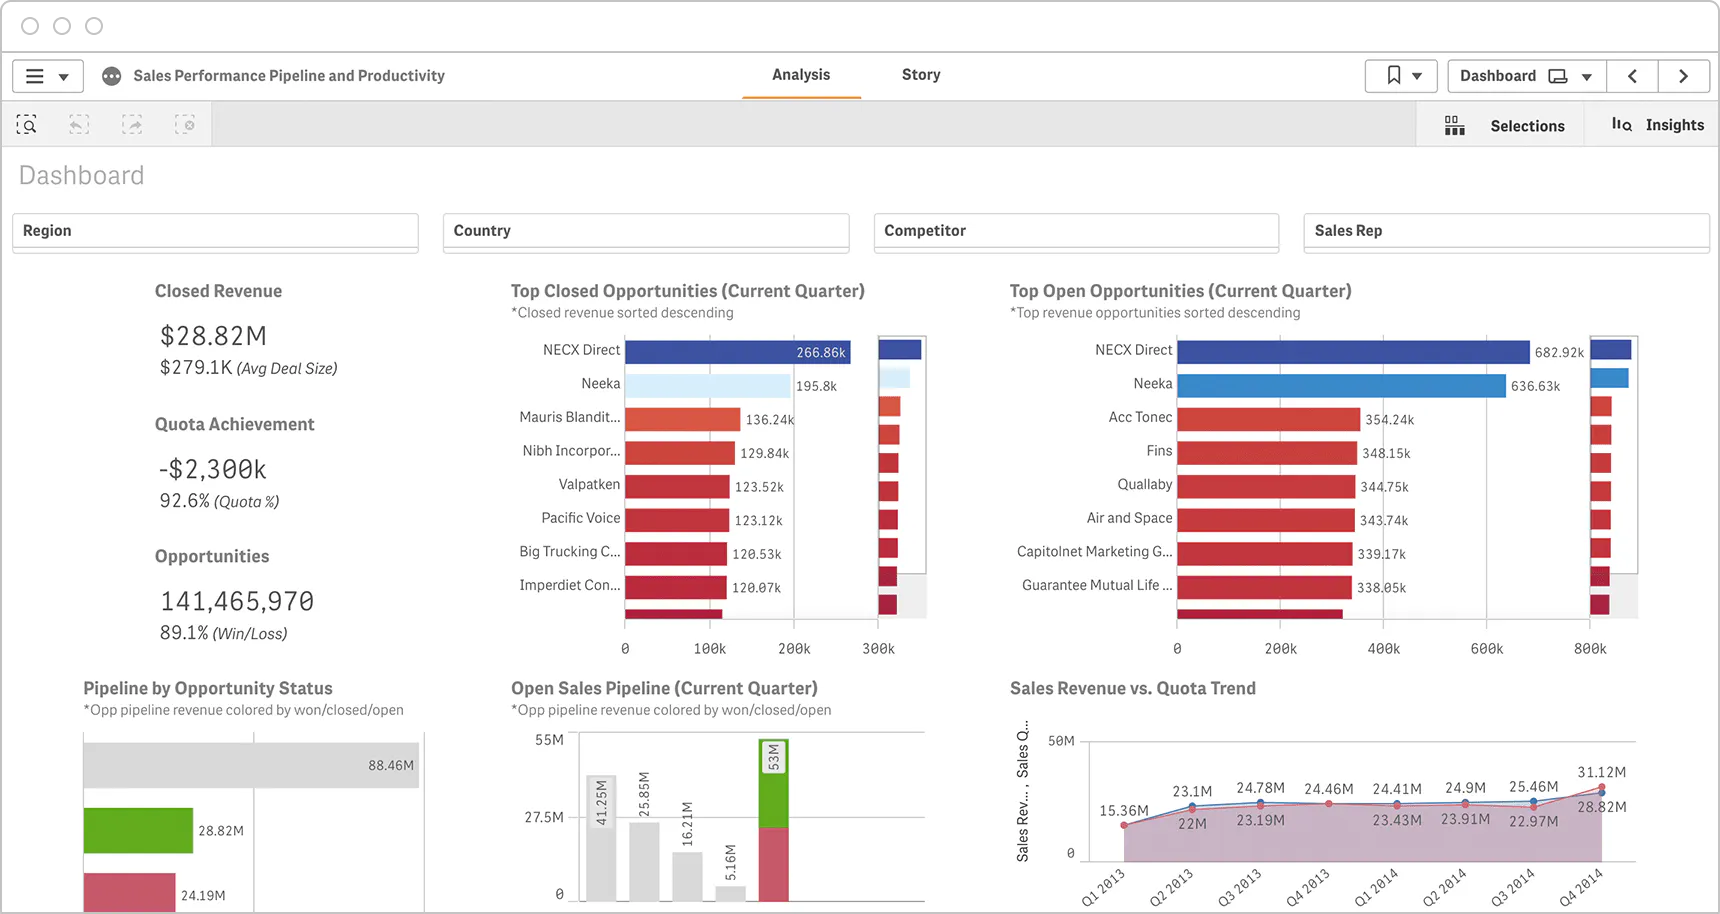
Qlik Cloud Analytics combines its associative analytics engine with dashboards, reporting, automation, AI-generated insights, and agentic interfaces.
Designed for: Teams that need to explore relationships across connected data without following only predefined drill paths.
How its AI model works
The associative engine keeps selected, associated, and unrelated values visible as users move through the data. Qlik Answers adds agentic questions across curated structured and unstructured sources, while Discovery Agent surfaces changes, anomalies, and trends. Qlik also provides an MCP server through which compatible AI clients can query Qlik Cloud using the user’s credentials and permissions.
Where it wins
Qlik’s strongest differentiation is the exploration model. It can reveal relationships and exclusions that are easy to miss when a user follows a fixed report hierarchy. Its 2026 pricing also includes Answers Agents and MCP access in the Starter plan, making AI and agent interoperability part of the core evaluation rather than an afterthought.
Where Plotly is better
Qlik may offer a wider packaged analytics and data-integration surface. Plotly is better when the relationship exploration must feed a proprietary Python model, a highly specialized visualization, or an application workflow whose layout and logic must be fully controlled in code.
Pricing
Qlik Cloud Analytics pricing starts at $300 per month for 10 users and 10 GB of data for analysis. Standard starts at $825 per month for 25 GB, Premium at $2,750 per month for 50 GB, and Enterprise uses custom pricing. Capacity and app-size limits differ by plan.
5. ThoughtSpot: search-led analytics for business users
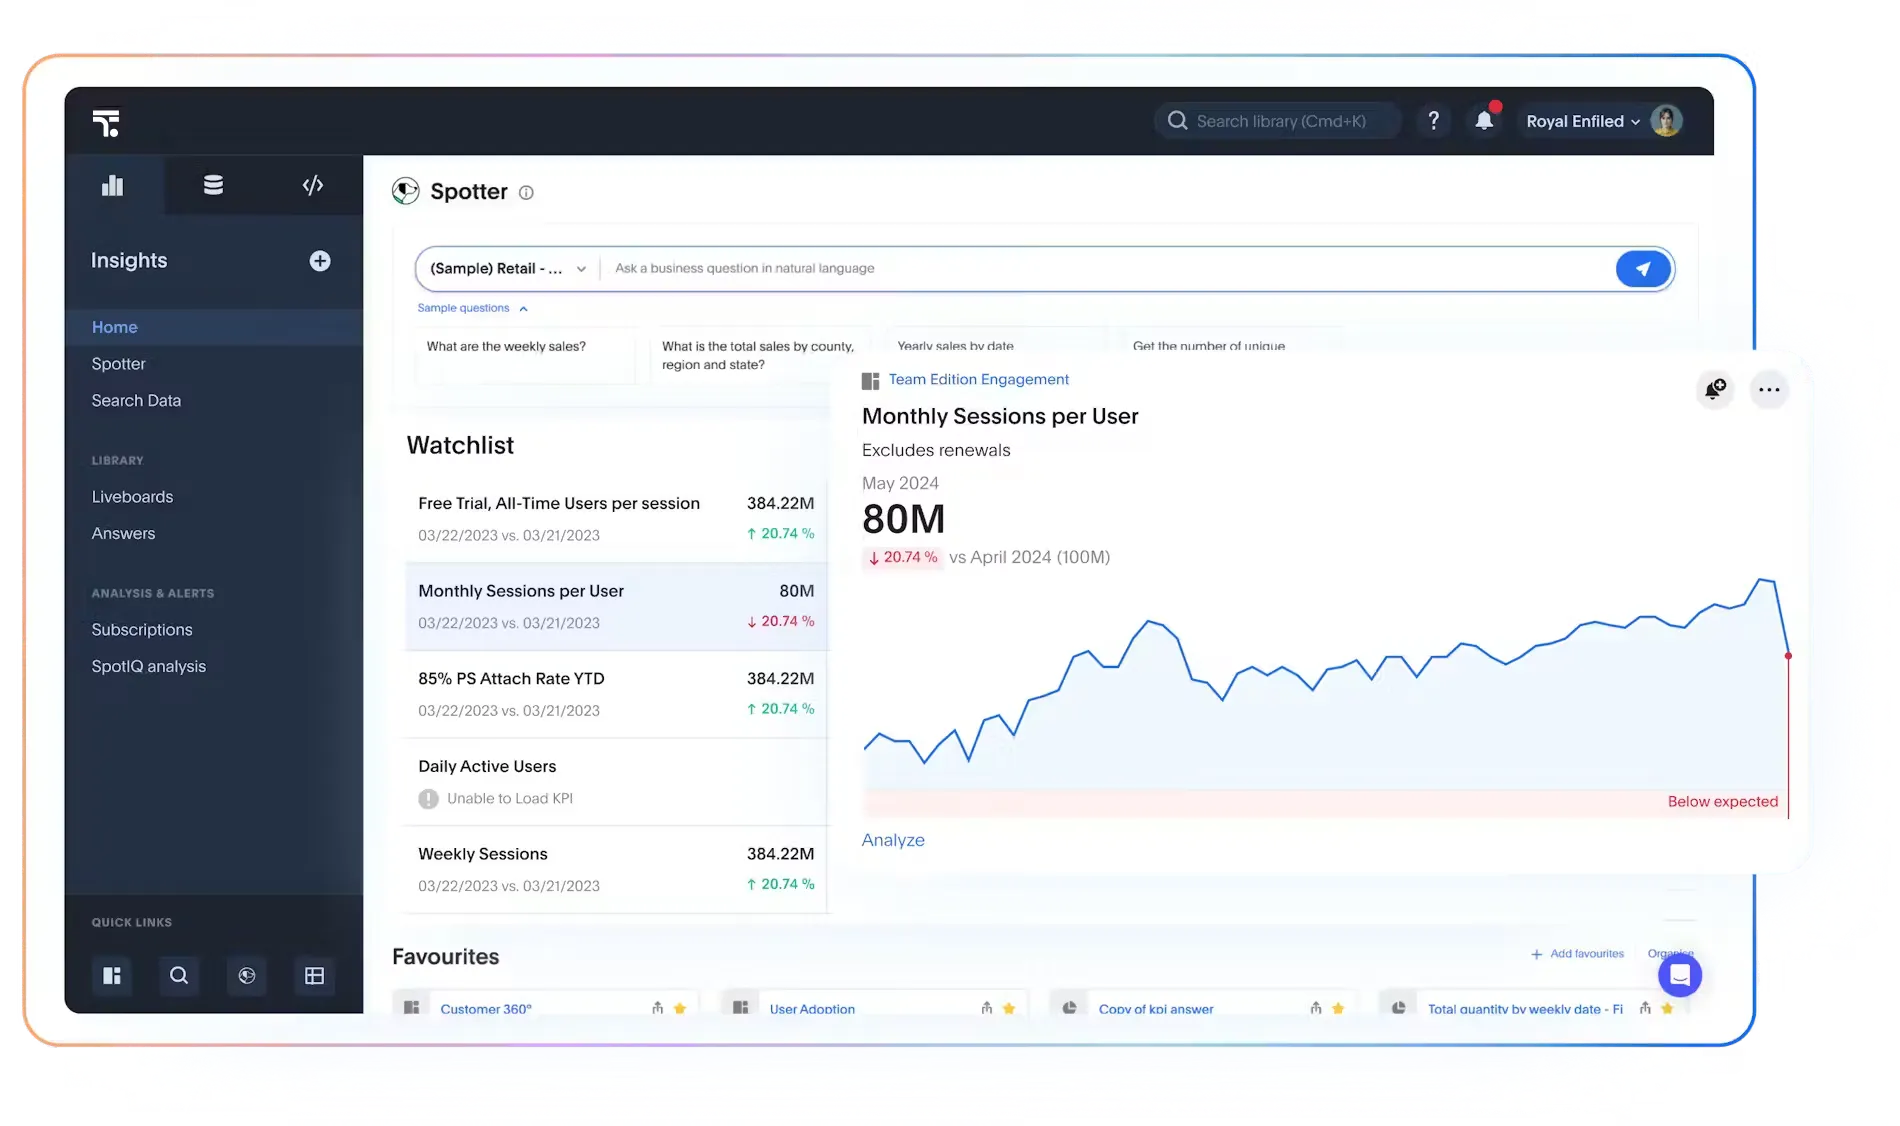
ThoughtSpot organizes analysis around natural-language questions, search, Liveboards, automated insights, and embedded experiences.
Designed for: Business users who need to ask follow-up questions without waiting for a new report to be built.
How its AI model works
Spotter agents support conversational exploration, while ThoughtSpot’s semantic and context layer grounds questions in modeled data. Analyst Studio provides code-oriented analysis for technical users, and the platform supports embedded analytics and external integrations.
Where it wins
ThoughtSpot’s search-first experience can reduce dependence on predefined dashboard paths. It is a strong option when the central adoption problem is helping business users ask new questions of curated data.
Where Plotly is better
Natural-language search does not replace a purpose-built interface. When users need to enter parameters, run a proprietary method, compare model scenarios, inspect high-density scientific visuals, or complete an operational process, Plotly gives the team control over the complete application rather than only the question-and-answer layer.
Pricing
ThoughtSpot pricing starts at $25 per user each month for Essentials and $50 per user each month for Pro, billed annually. The page also offers usage pricing from $0.10 per credit for some configurations, while Enterprise plans are custom. Teams should compare the user-based and usage-based models against the same expected query volume.
6. Looker: governed metrics built around LookML
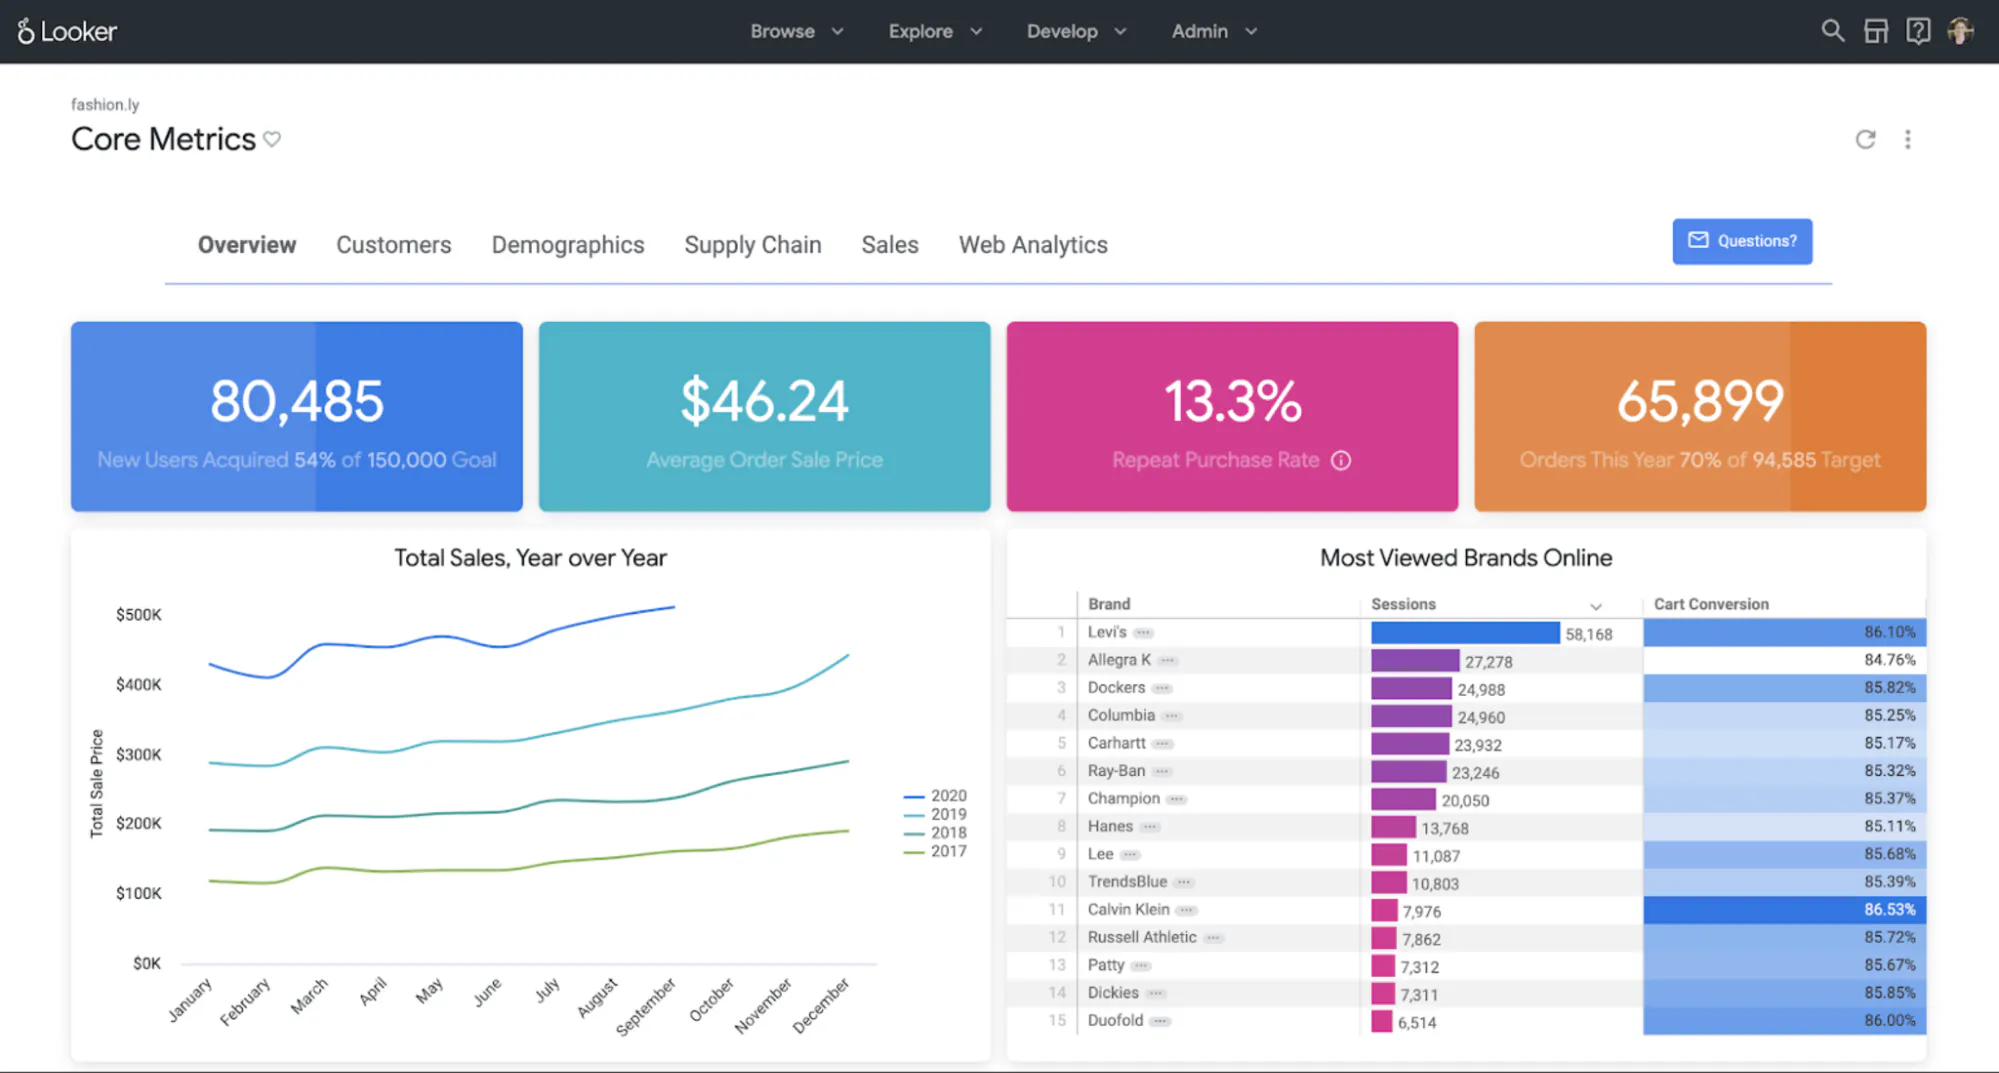
Looker uses LookML to define dimensions, calculations, joins, and business rules that feed dashboards, Explores, embedded applications, and AI experiences.
Designed for: Organizations that want reusable metric definitions and governed self-service analysis, particularly within Google Cloud.
How its AI model works
Gemini-powered Conversational Analytics and dashboard agents query data through Looker’s governed modeling layer. Looker also documents AI-assisted LookML development, a managed MCP server, and APIs for embedding conversational analytics in other applications.
Where it wins
Looker’s semantic model is its main strength. When the hard problem is making revenue, retention, and customer definitions consistent across reports and AI answers, a carefully maintained LookML project provides a controlled foundation.
Where Plotly is better
Looker may be the better metric layer, but that does not automatically make it the better application layer. Plotly is stronger when the user experience must run custom Python logic, support unusual interactions, or wrap a governed metric in a domain-specific decision workflow. The two can complement each other when a Dash app consumes governed data through supported APIs or databases.
Pricing
Looker pricing combines platform and user licensing under annual commitments. Google does not publish list prices for Standard, Enterprise, or Embed editions.
7. Databricks AI/BI: analytics inside the lakehouse
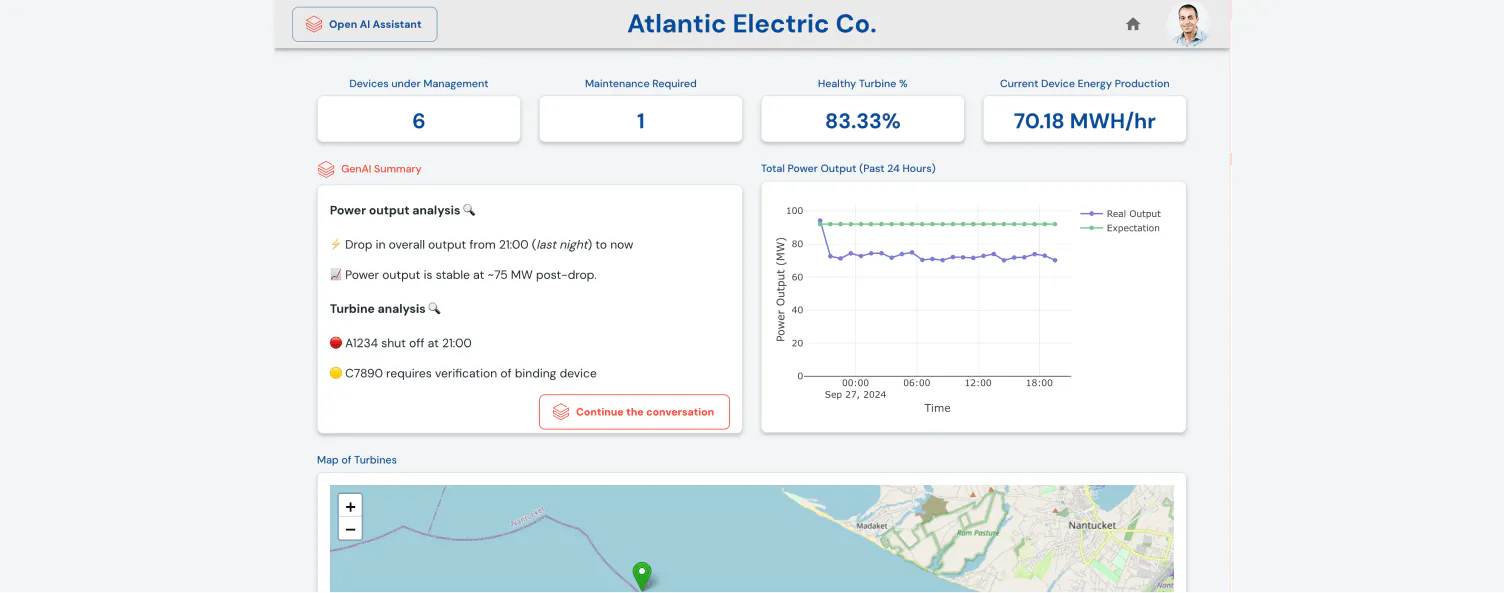
Databricks AI/BI brings dashboards, reporting, natural-language exploration, business semantics, and predictive analysis into the Databricks Data Intelligence Platform.
Designed for: Organizations whose governed analytical data and AI workloads already live in Databricks and Unity Catalog.
How its AI model works
AI/BI Dashboards provide the reporting layer, while Genie lets business users ask natural-language questions of curated data. Genie APIs can bring that conversational experience into other applications. Unity Catalog Business Semantics centralizes definitions used by BI and AI workflows.
Where it wins
Databricks minimizes architectural distance between data engineering, governance, machine learning, and BI. Teams can apply the same lakehouse permissions and context without introducing a separate BI data copy.
Where Plotly is better
This is often a complementary decision rather than a head-to-head replacement. Databricks can govern and serve the data or model; Dash Enterprise can provide the custom user experience around it. Plotly documents how Dash apps connect to a Databricks SQL warehouse and run Databricks jobs. Use Databricks AI/BI for lakehouse-native dashboards and Genie. Add Plotly when users need a tailored Python application with specialized controls, computations, and visual behavior.
Pricing
Databricks states that AI/BI has no additional license fee. It is available to eligible Databricks Lakehouse customers whose data is managed in Unity Catalog, and standard Databricks usage rates apply.
How to choose an AI business intelligence platform in 2027
A useful shortlist starts with the output your users need, not the vendor’s AI demo.
Start with the finished analytical experience
Write down what the user must do after receiving an insight. Reading a KPI, filtering a dashboard, asking a follow-up question, entering an assumption, running a model, editing a record, and approving an action are different application requirements.
If the workflow ends with governed reporting, Power BI, Tableau, Qlik, or Looker may fit naturally. If users need a purpose-built interface around Python logic, Plotly should lead the shortlist.
Test semantic correctness, not conversational fluency
Give every platform several versions of the same contested question. Ask for net revenue after refunds by fiscal quarter, then change the region, product, and user role. Inspect the metric definition, filters, joins, period logic, and source data.
A polished answer doesn’t prove the platform selected the right metric.
Test permissions through every interface
Run the same workflow as an administrator, analyst, manager, and restricted viewer. Confirm that reports, chat, exports, agents, APIs, MCP connections, and embedded experiences enforce the intended access rules.
Compare the hardest workflow
Do not use a standard sales dashboard as the only proof of concept. Test the requirement most likely to expose the platform’s ceiling: a proprietary model, a large editable table, a specialized chart, a long-running calculation, a multi-step investigation, or an embedded customer workflow.
Calculate the complete operating cost
Include creators, viewers, capacity, compute, AI consumption, implementation, data preparation, support, training, migration, and ongoing ownership. A low entry price can be irrelevant if the required AI feature sits behind capacity or the workload creates substantial warehouse consumption.
Choose for day 100
AI has reduced the effort required to build an initial application. That makes the finished operating model more important, not less. Evaluate who will own the semantic definitions, prompts, code, releases, infrastructure, tests, and access controls after the proof of concept succeeds.
The practical recommendation
Choose Power BI for Microsoft-centered reporting, Tableau for analyst-led visual exploration, Qlik for associative discovery, ThoughtSpot for search-led analytics, Looker for LookML-governed metrics, and Databricks AI/BI for lakehouse-native analytics.
Choose Plotly when your enterprise analytics platform must go beyond configured dashboards and return a custom application built around your data, Python logic, models, and operating workflow. Studio shortens the route from question to code-backed app. Dash keeps the computation and interface extensible. Dash Enterprise provides the self-hosted deployment, access, scaling, and lifecycle controls needed to make those applications an organizational capability.
That is the requirement on which Plotly is the better choice.
Explore Plotly Studio for code-backed AI analysis, or request a Dash Enterprise demo using the most demanding workflow in your shortlist.