
Plotly
October 9, 2026
5 Best Interactive Dashboard Software Tools for 2027
TL;DR
There is no single best interactive dashboard tool. The right one depends on what users must do, who will build it, how AI fits the workflow, and how the app will be deployed.
- Streamlit turns a Python script into a shareable app in one file. Its script-first model works well with coding agents. Community Cloud covers personal, educational, and non-commercial apps; Streamlit in Snowflake is the enterprise path. Chat widgets are included, but teams build the data-querying and tool-calling logic themselves.
- Plotly Dash is for custom Python apps and fast prototypes that can grow through callbacks, with layout separate from logic. Coding agents can write and revise the app directly. Plotly Studio adds AI-assisted analysis and app generation; Plotly Studio Embedded adds in-app chat so viewers can ask open-ended questions and build charts. Plotly Cloud and Dash Enterprise cover managed and self-hosted deployment.
- Power BI fits governed, repeatable enterprise reporting with point-and-click authoring, Power Query, and DAX. Publishing and organizational sharing usually need paid licensing. Copilot can build reports and answer questions, but it requires supported paid capacity.
- Tableau is built for visual exploration and polished dashboards. Tableau Public is free, but for publicly viewable data. Tableau Agent supports conversational authoring and dashboard Q&A; the consumer experience is still beta and needs a supported deployment.
- Data Studio (formerly Looker Studio) is a no-cost, browser-based reporting tool with drag-and-drop authoring and many connectors. It is not the wider Looker BI platform. Gemini can help with calculated fields; it does not build full dashboards. Conversational Analytics runs through BigQuery data agents.
How to choose: Use a Python framework when coding agents such as Claude Code or Codex are part of the workflow, or when the dashboard needs custom logic, models, inputs, or workflows. Dash prioritizes customizable applications and fast prototyping; Streamlit prioritizes turning scripts into apps. Use Power BI or Tableau for standardized organizational BI. Use Data Studio for simple, no-cost browser reports.
A graphing library draws charts. A dashboard framework adds layout, controls, state, interactions, and application logic. Free options exist, but they differ on hosting, authentication, private sharing, and governance. The strongest setups support both predefined graphs and filters and open-ended questions that were not built into the dashboard.
Best interactive dashboard software at a glance
Tool
Designed for & Build method
Commercial options
AI capability
Scripting paradigm for building data applications. Turn a Python script into an app with layout and logic in one file that re-runs on every interaction.
Open-source framework; Community Cloud for personal, educational, and non-commercial apps Streamlit in Snowflake provides enterprise hosting, access controls, and Snowflake integration. Pricing is based on app runtime and warehouse usage; there is no paid Community Cloud tier.
Works well with coding agents; Python; ships low-level chat components for message input and display, so agentic data analysis means you build the tool-calling harness and specialized UI yourself, while Snowflake’s Cortex agents sit outside the app.
Decorator-wrapped functions so a prototype can grow without reorganizing, with layout separate from logic and uses callbacks
Dash Open Source; Plotly Cloud for hosting with Free, Pro and Enterprise plans. Dash Enterprise provides self-hosted Kubernetes deployment. No viewer-level prices.
Works well with coding agents; Python; adds native in-app AI: apps can act as MCP servers, and Plotly Studio Embedded is a drop-in agentic chat (on Plotly Cloud, and on Dash Enterprise in Q4 2026) so end users chat with the app data and build visualizations with the harness already included.
Self-service and enterprise BI. Build using visual authoring with Power Query and DAX
Free account and Power BI Desktop Power BI Pro, Premium Per User, Fabric capacity, and Power BI Embedded provide paid organizational paths.
Copilot builds reports and answers data questions; paid capacity required.
Visual data exploration and governed analytics. Build using Primarily visual authoring, supplemented by calculations, SQL, and APIs.
Tableau Public for publicly shared visualizations Tableau Cloud and Tableau Server offer Creator, Explorer, and Viewer licensing.
Tableau Agent supports conversational authoring and dashboard Q&A; access varies.
Browser-based reporting. Build using drag-and-drop editor, connectors, and calculated fields
No-cost standard product Data Studio Pro adds organizational ownership, team workspaces, administration, enterprise security, and support.
Gemini assists fields; Conversational Analytics uses BigQuery data agents.
Plotly and Streamlit provide code-based routes to interactive data applications using coding agents. Power BI, Tableau, and Data Studio focus more heavily on business reporting and visual analytics.
How to choose interactive dashboard software
Before comparing individual products, define what teams must be able to do.
A dashboard designed to display monthly KPIs has different requirements from an application that runs a forecasting model or lets users edit data. Place the requirement into one of four broad categories:
- View: Monitor predefined KPIs, reports, and trends
- Explore: Filter, drill down, and investigate the underlying data
- Act: Enter information, run calculations, use models, or trigger a workflow
- Ask AI: Ask open-ended questions that are not anticipated in the dashboard
Next, consider who will build and maintain the dashboard. Business teams may prefer visual report builders, while analysts and data scientists who work in Python or retooling around AI agents may benefit from Python dashboard frameworks.
In general, code provides more control and customization. In the AI era, code also becomes an interface for AI, coding agents such as Claude Code and Codex are most effective when they can read, write, test, and revise the application directly. This makes any code-based dashboard tool, especially a Python framework, inherently coding-agent-friendly and therefore implicitly AI-enabled, even if it does not market a separate AI feature.
Evaluate AI in two layers: how well agents can build and modify the dashboard, and what AI-assisted analysis end users receive after deployment.
Deployment matters too. Ask whether the dashboard will contain private data, require authentication, run behind a firewall, or serve a large audience. Finally, calculate more than the advertised entry price. Creator licenses, viewer licenses, hosting, maintenance, and engineering time can all affect the actual cost.
These questions are more useful than searching for one product that is supposedly best for every scenario.
1. Streamlit
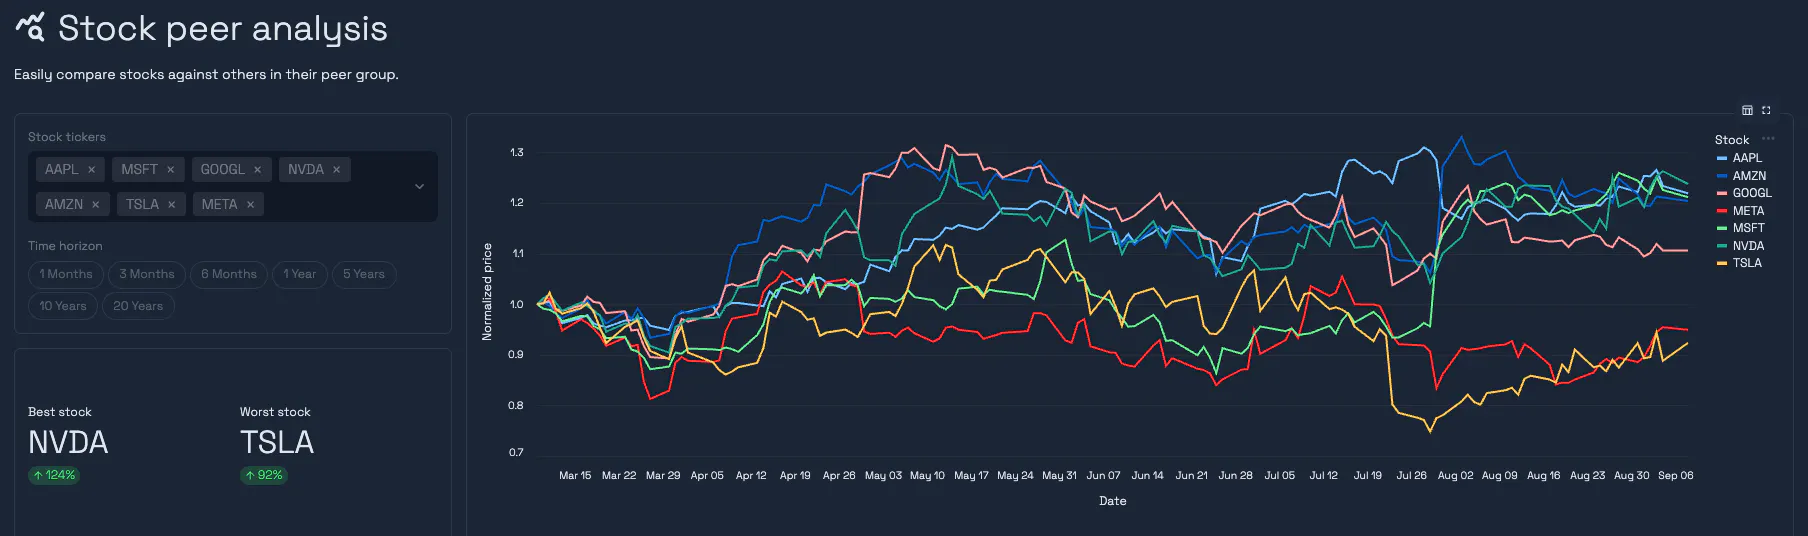
Source: Streamlit stock peers demo
Streamlit is an open-source Python framework designed to turn data scripts into shareable web applications. Users can add text, charts, tables, and interactive widgets directly from Python without separately creating a front end or managing web routes.
Its script-oriented model makes Streamlit especially compatible with coding agents. Because the app is expressed as Python, an agent can inspect the workflow, generate charts and controls, refactor the application, and debug behavior in the same codebase a developer edits. That makes Streamlit useful for exploratory tools, model demonstrations, internal utilities, and early prototypes.
Streamlit also offers Community Cloud, which connects to GitHub repositories and provides a free route for deploying and sharing applications. The service handles containerization and updates the deployed application when its underlying code changes.
Streamlit’s emphasis on script-first development is a strength, but it should still be compared with the eventual complexity of the application. Streamlit apps can run into performance issues because they’ll rerun the entire script when you interact with the UI, not just the parts that changed. Teams should evaluate where expensive work occurs and whether the application's interaction model can be divided into efficient rerun boundaries.
AI capability
Build with AI: Streamlit's Python-first model and official agent skills make it straightforward for coding agents to build and revise apps against current APIs.
Ask AI: Streamlit supplies chat components for custom LLM experiences, but teams must connect the model and implement the data-querying logic themselves.
2. Plotly
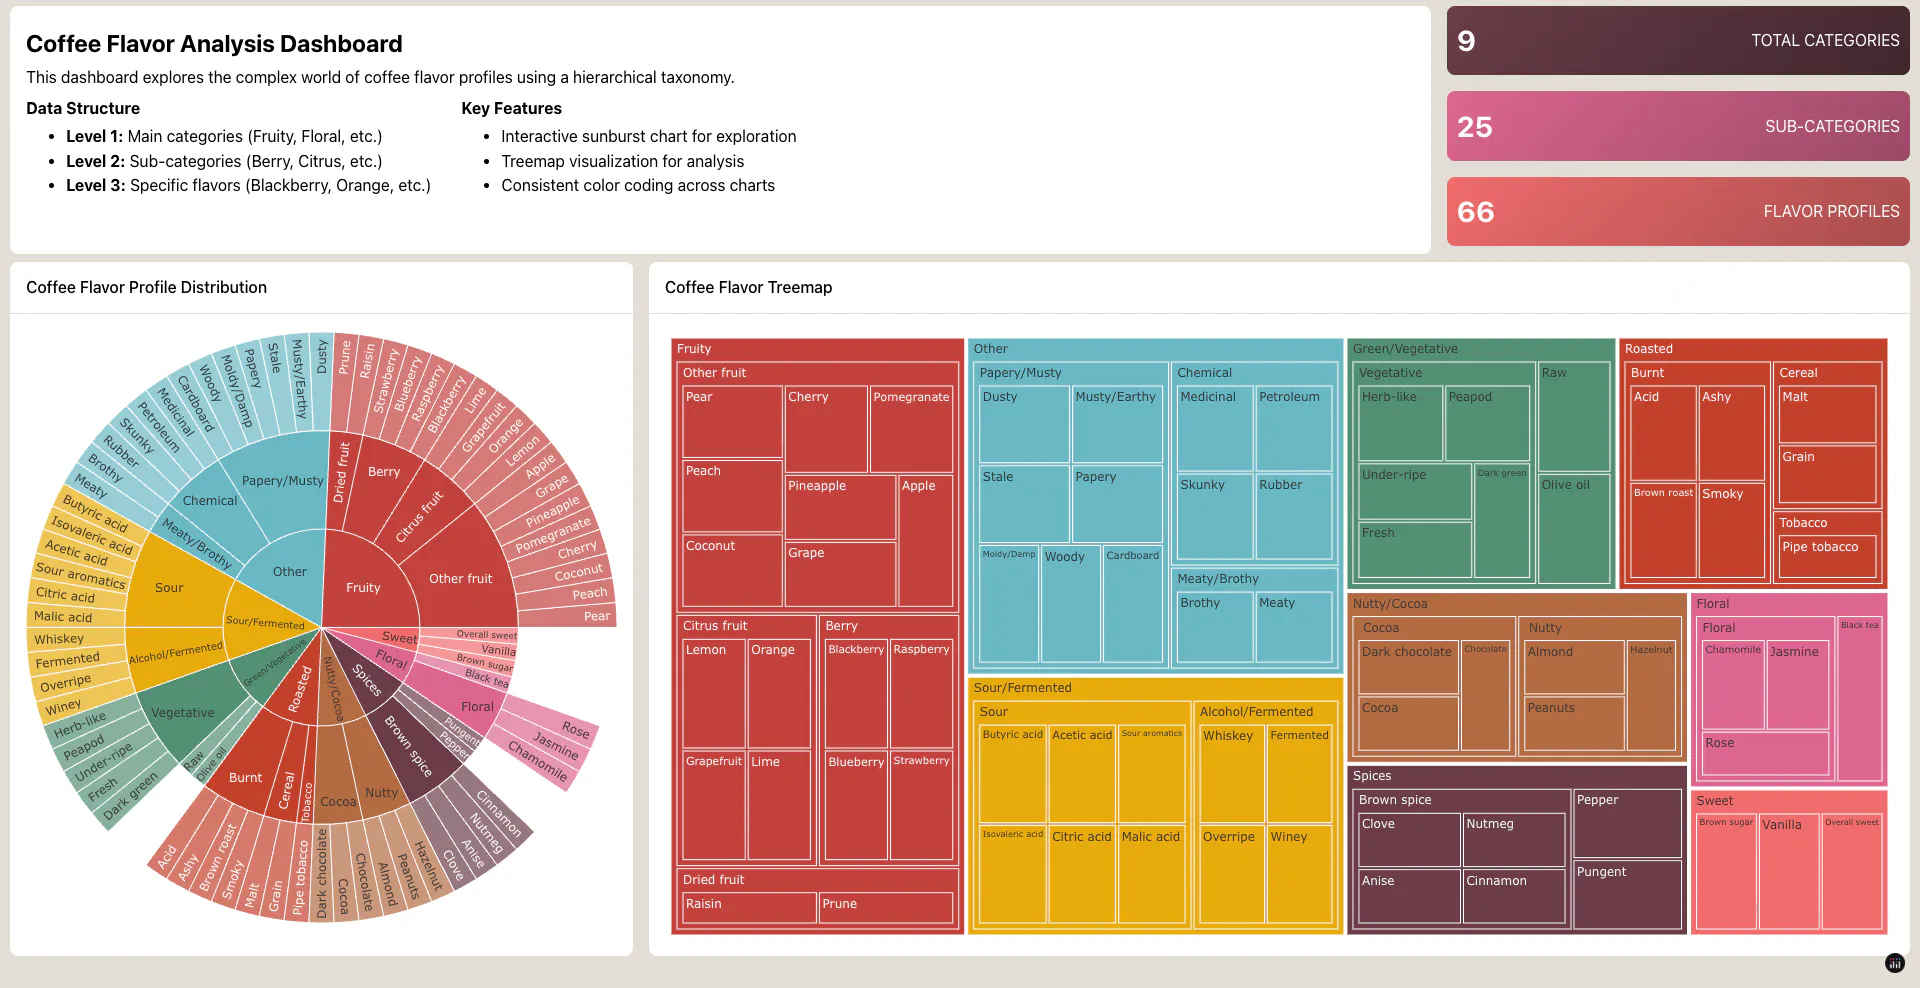
Source: Plotly coffee flavours app
Plotly combines Dash Open Source, Plotly Studio, Plotly Cloud, and Dash Enterprise. Together, these products support custom app development, AI-assisted analysis, managed publishing, and self-hosted enterprise deployment.
Dash is an MIT-licensed, open-source Python framework for building fast prototypes, analytical web applications, and interactive dashboards. Developers define layouts in Python and connect inputs, outputs, charts, tables, and controls through reactive callbacks. A change to a filter, selection, or input can update other parts of the application or execute Python logic.
Dash's code-first architecture is also inherently coding-agent-friendly. Agents can generate layouts, callbacks, data transformations, tests, and deployment configuration directly in the application code. Plotly Studio then adds a complementary layer of AI-assisted authoring and analysis.
Dash is particularly useful when a dashboard must do more than present predefined reports. Teams can incorporate custom calculations, simulations, machine-learning models, data-editing interfaces, or workflows tailored to a particular business or scientific problem. Dash also supports multi-page applications, background callbacks for longer-running work, and interactive Plotly charts with click and selection events.
Plotly Studio provides a prompt-driven route to analysis and Python-backed app generation. Plotly Studio Embedded can add a conversational interface to Dash apps published on Plotly Cloud, allowing viewers to ask open-ended questions about application data.
Dash apps can be published through Plotly Cloud, deployed through self-hosted and behind the firewall Dash Enterprise, or run on other compatible infrastructure.
Dash Open Source can use the authentication capabilities included with Plotly's deployment platforms.
AI capability
Build with AI: 3rd party coding agents like Claude or Codex can build and maintain Dash apps directly, and Plotly Studio is Plotly’s own AI-native professional app for analyzing data and generating Dash apps.
Ask AI: Plotly Studio Embedded adds an AI chatbot to the Dash apps on Plotly Cloud, enabling end-users to ask open ended data questions and create their own visualizations on the data exposed in the app; it was released in August 2026.
3. Power BI
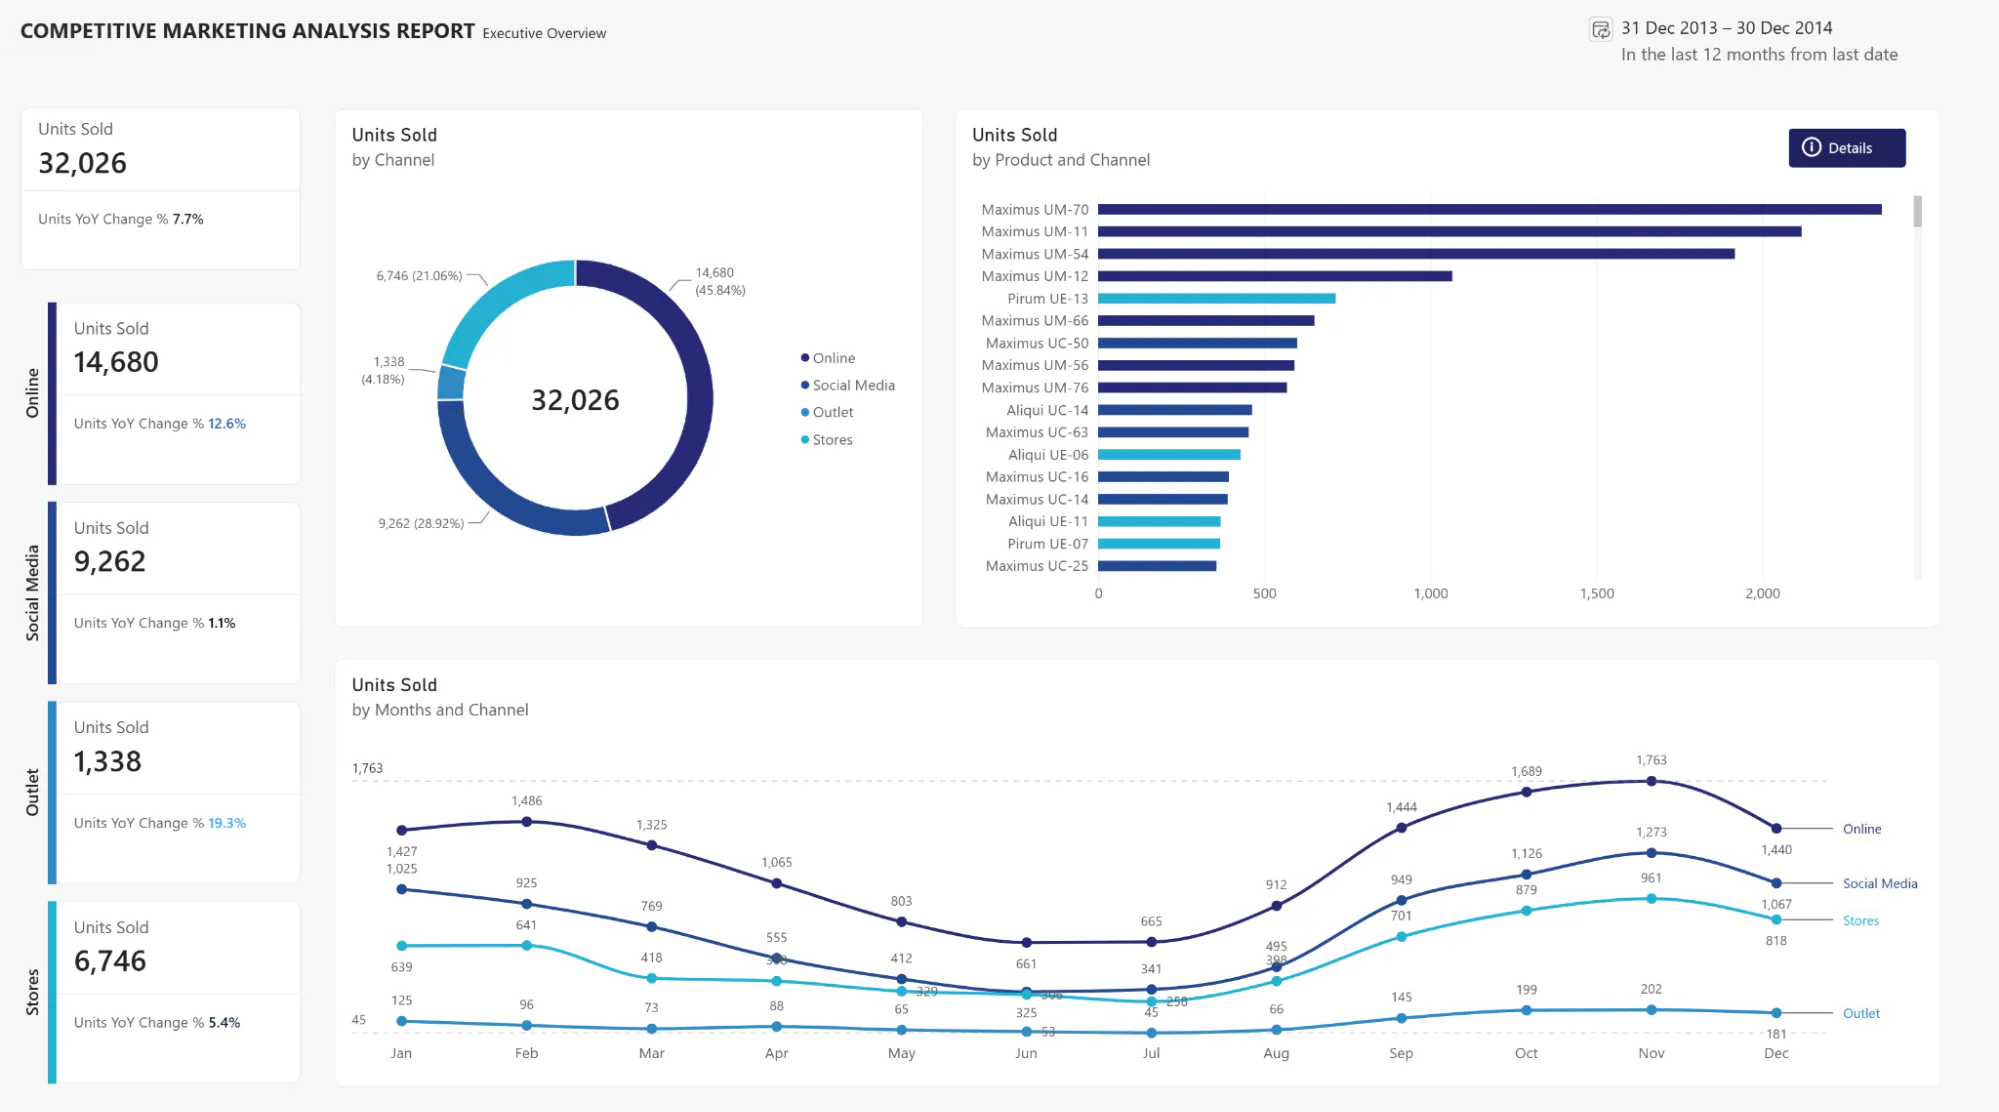
Microsoft Power BI is a self-service and enterprise business intelligence platform for connecting, analyzing, and visualizing data. It supports interactive reports, dashboards, mobile access, embedded analytics, and on-premises reporting with a point-and-click interface.
Power BI is well suited to organizations that want to distribute standardized reports and metrics across departments. Its role within Microsoft Fabric also connects business intelligence with a broader set of data integration, engineering, science, and real-time analytics capabilities.
Microsoft provides a free account and Power BI Desktop for creating interactive reports. However, its licensing model distinguishes between creating, publishing, sharing, and consuming content. Organizations may need Pro, Premium, Fabric capacity, or embedded licensing depending on how reports are distributed.
Power BI is principally a BI and reporting platform. A team that needs an entirely bespoke analytical application may require a framework that provides more direct control over application logic and user experience.
AI capability
Build with AI: Copilot can suggest and create report pages, write DAX, and generate narrative visuals.
Ask AI: Users can ask natural-language questions of reports and semantic models; Copilot requires administrator enablement and supported paid Fabric or Power BI Premium capacity.
4. Tableau
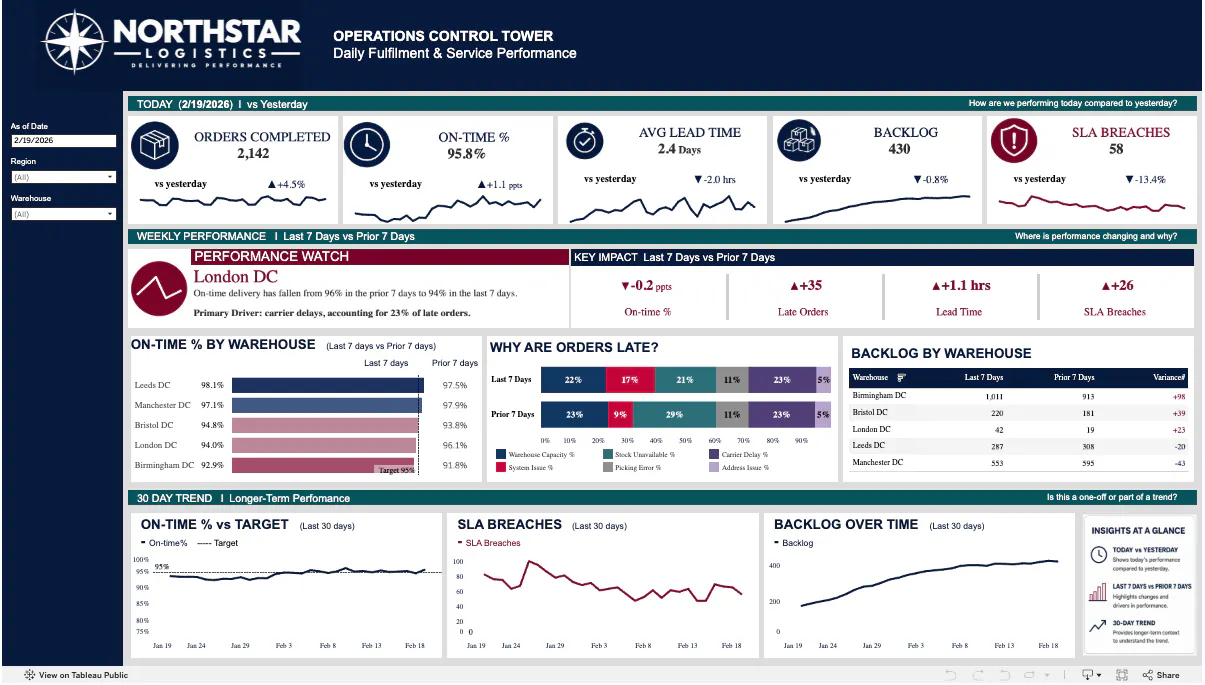
Tableau provides a family of visual analytics products. Tableau Desktop supports data exploration, modeling, and visualization; Tableau Cloud provides a managed environment for analyzing and sharing data; and Tableau Server supports self-hosted deployment.
Tableau is particularly strong when analysts need to explore data visually and turn that analysis into polished, interactive dashboards. Its visual authoring experience makes it accessible to people who want to work directly with charts and data without developing a web application in Python.
Tableau Public allows users to create and publish interactive visualizations without coding with a point-and-click interface. However, it is intended for public rather than private data: published visualizations are available for anyone to view online. Data refreshes are also limited compared with Tableau's commercial products.
Organizations handling private information or requiring controlled collaboration will therefore need to evaluate Tableau's paid Cloud, Server, and licensing options.
AI capability
Build with AI: Tableau Agent can create visualizations and calculated fields through conversational authoring.
Ask AI: Tableau Agent in Dashboards can summarize dashboards and answer questions about underlying data, but this consumer experience is currently beta and requires an enabled, supported Tableau deployment.
5. Data Studio
Source: Google Data Studio product page
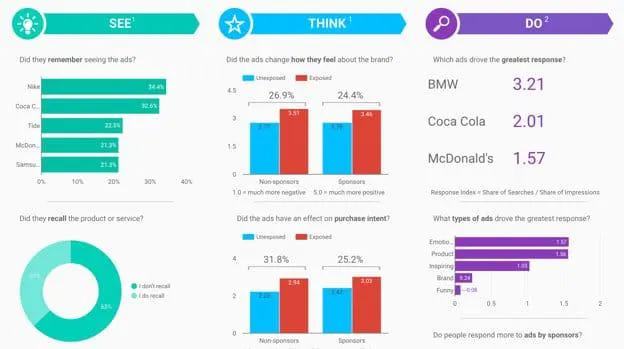
Data Studio, formerly known as Looker Studio, is Google's no-cost tool for creating customizable dashboards and reports through a drag-and-drop editor. It supports interactive dashboards, ad hoc reports, embedded reporting, and connections to more than 1,000 data sources.
Users can add configurable charts and tables, then make reports interactive with filters, date-range controls, and data controls. Reports can also be shared with a team, embedded on the web, or made available more broadly.
Data Studio is a practical choice when a team needs to assemble and distribute reports without purchasing a larger BI platform. It is especially relevant for straightforward reporting based on individual data sources or datasets that have already been prepared for analysis.
It should not be confused with the wider Looker BI platform. Google positions Data Studio as the lighter reporting and visualization product, while Looker provides additional modeling, governance, permissions, APIs, and application capabilities.
AI capability
Build with AI: Gemini can generate calculated-field formulas, but it does not create complete reports or dashboards.
Ask AI: Conversational Analytics can answer natural-language questions through BigQuery data agents; calculated-field assistance remains a Data Studio Pro preview.
Which interactive dashboard tool should you choose?
Choose the tool according to the job:
Tool
Choose it when
Plotly
You need a fast prototype or custom Python analytical application, AI-assisted exploration, and a path from open source to managed or self-hosted production.
Streamlit
You want to turn a Python script or model into a prototype or lightweight app.
Power BI or Tableau
You need standardized organizational BI and visual reporting.
Data Studio
You need accessible, no-cost browser-based reports.
Power BI and Tableau offer broad ecosystems for governed reporting and visual analysis. If the requirement is a custom Python application that runs models, accepts inputs, edits data, or supports a bespoke workflow, Plotly is the stronger fit because Dash exposes application logic through Python and callbacks.
In the AI era, that exposed code is a strategic advantage: coding agents can build, inspect, test, and modify the application directly, while Plotly Studio adds AI-assisted exploration for users. Plotly Cloud and Dash Enterprise provide managed and self-hosted deployment paths.
Build the dashboard your use case requires
The right dashboard software should reflect the decision it helps someone make.
Traditional BI platforms work well when teams need repeatable reports, shared metrics, and familiar ways to explore data. Python dashboard tools become more valuable when the experience must incorporate custom calculations, models, inputs, or workflows.
For teams working in Python, an open codebase becomes an interface for AI. Coding agents can help create and maintain the Streamlit or Dash application, while Plotly Studio adds AI-assisted analysis for end users. Plotly provides a path from an initial dashboard to a complete analytical application through Dash, Plotly Studio, Plotly Cloud, and Dash Enterprise.