® graphing library makes interactive, publication-quality graphs online. Examples of how to make statistical charts such as box plots, histograms, and distrubution plots.> ® graphing library makes interactive, publication-quality graphs online. Examples of how to make statistical charts such as box plots, histograms, and distrubution plots./> ® graphing library makes interactive, publication-quality graphs online. Examples of how to make statistical charts such as box plots, histograms, and distrubution plots./>

Plotly MATLAB® Open Source Graphing Library Statistical Charts

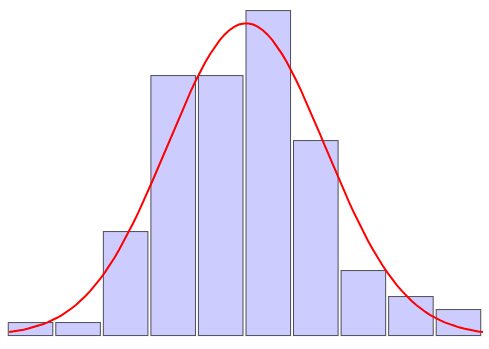
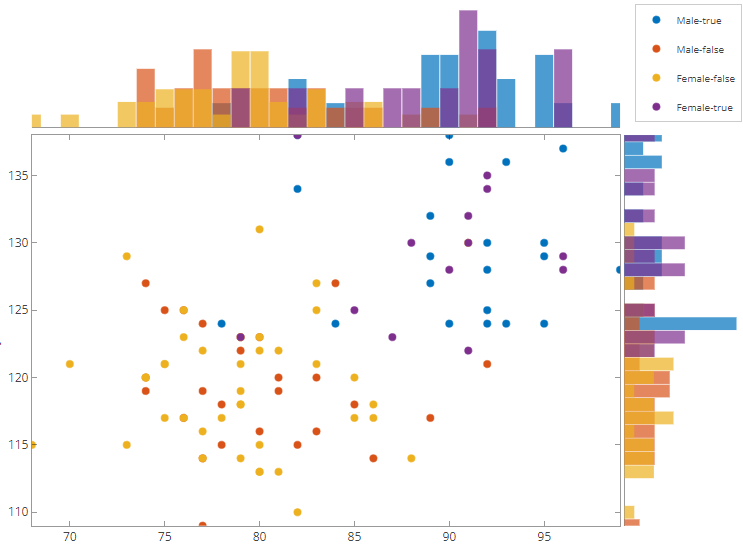
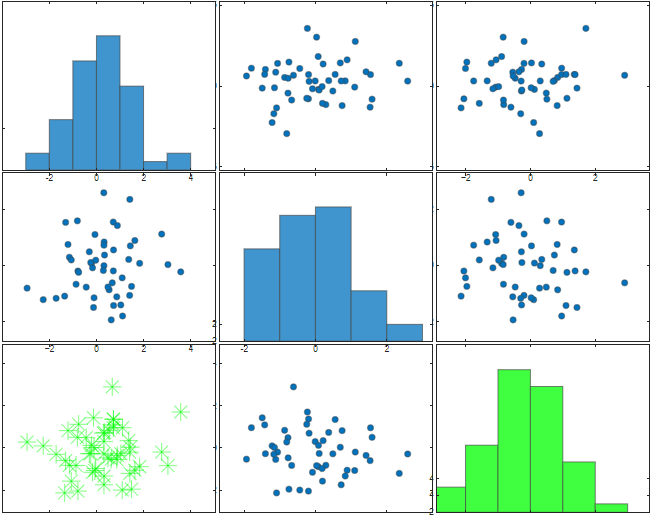
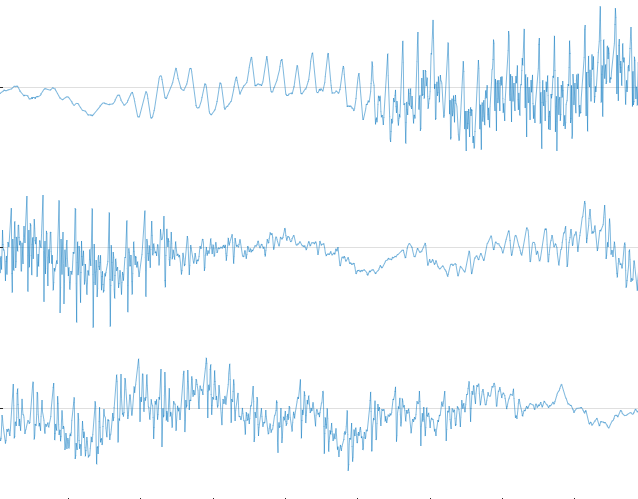
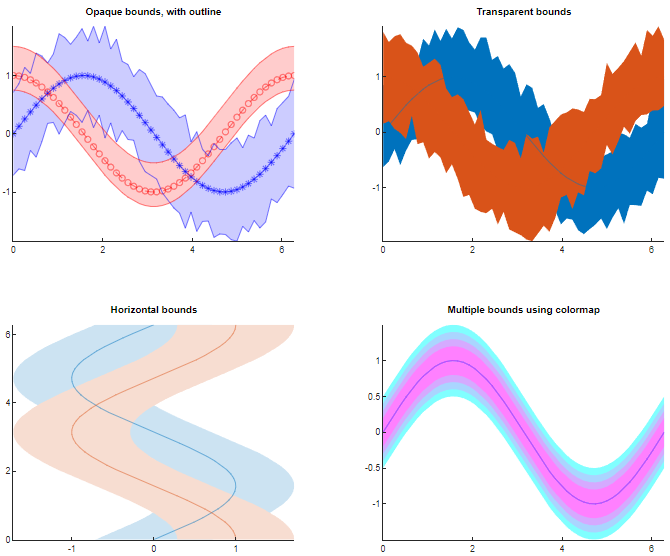
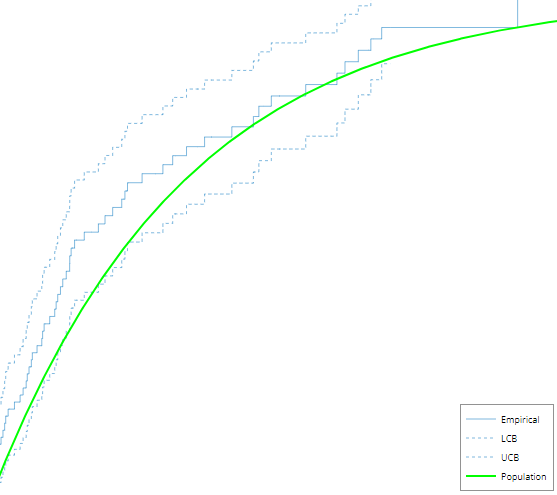
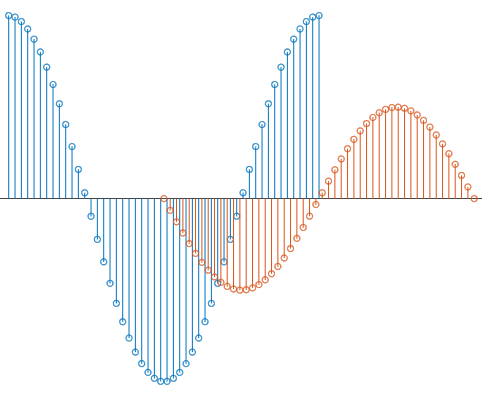
Plotly's MATLAB® graphing library makes interactive, publication-quality graphs online. Examples of how to make statistical charts such as box plots, histograms, and distrubution plots.


Deploy Matlab AI Dash apps on private Kubernetes clusters: Pricing  |  Demo  |  Overview  |  AI App Services

Statistical Charts

MATLAB® is a registered trademark of The MathWorks, Inc.