

MapLibre Migration in Python
Migrating from Mapbox traces to MapLibre traces.
Plotly Studio: Transform any dataset into an interactive data application in minutes with AI. Try Plotly Studio now.
Migrating from Mapbox traces to MapLibre traces
With the release of Plotly.py v5.24.0, we are introducing a new set of trace types for maps with tile underlays, including from Plotly Express:
px.scatter_mappx.line_mappx.choropleth_mappx.density_map
as well as Plotly Graph Objects:
go.Choroplethmapgo.Scattermapgo.Densitymap
These traces replace the existing Mapbox traces, px.scatter_mapbox, px.line_mapbox, etc., but use MapLibre as the map renderer rather than Mapbox.
When switching to the new traces, keep an eye out for improved rendering performance, WebGL2 support, and over time, improved features in the Plotly map traces inherited from the MapLibre renderer, including projection support, globe views, terrain support, and support for modern mapping standards.
You can learn more about the motivations for this change in our announcement post.
As a result of removing Mapbox as the rendering engine, we're also removing the Mapbox branding from these trace names. This means that migrating from Mapbox traces to MapLibre traces will require some code changes in your projects.
- Change trace names from
*mapboxto*map. For any existing trace name ending in*mapbox, ensure you've removed the "box" suffix. - If in use, update
layout.mapboxargument in your layout configuration tolayout.map. The nested properties are identical in the new map traces, so no other changes should be required. - If in use, update
mapbox_styletomap_style. - Verify your
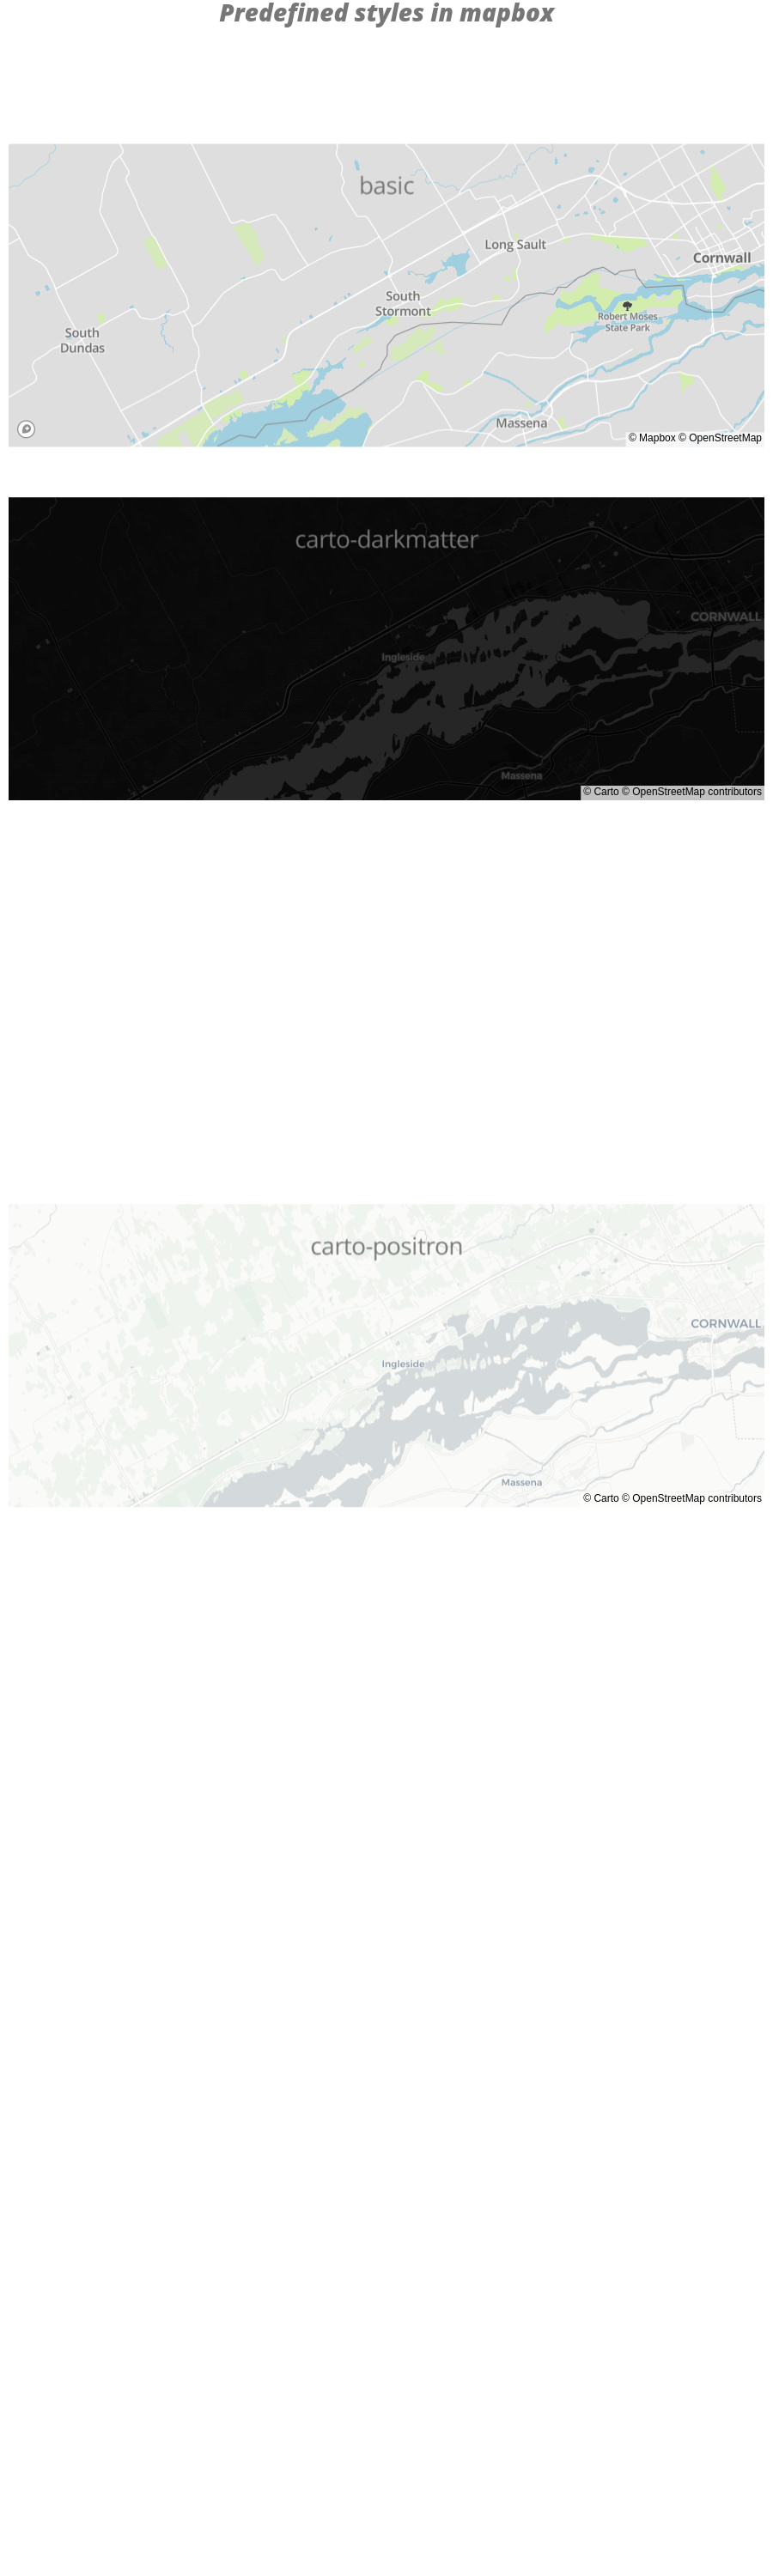
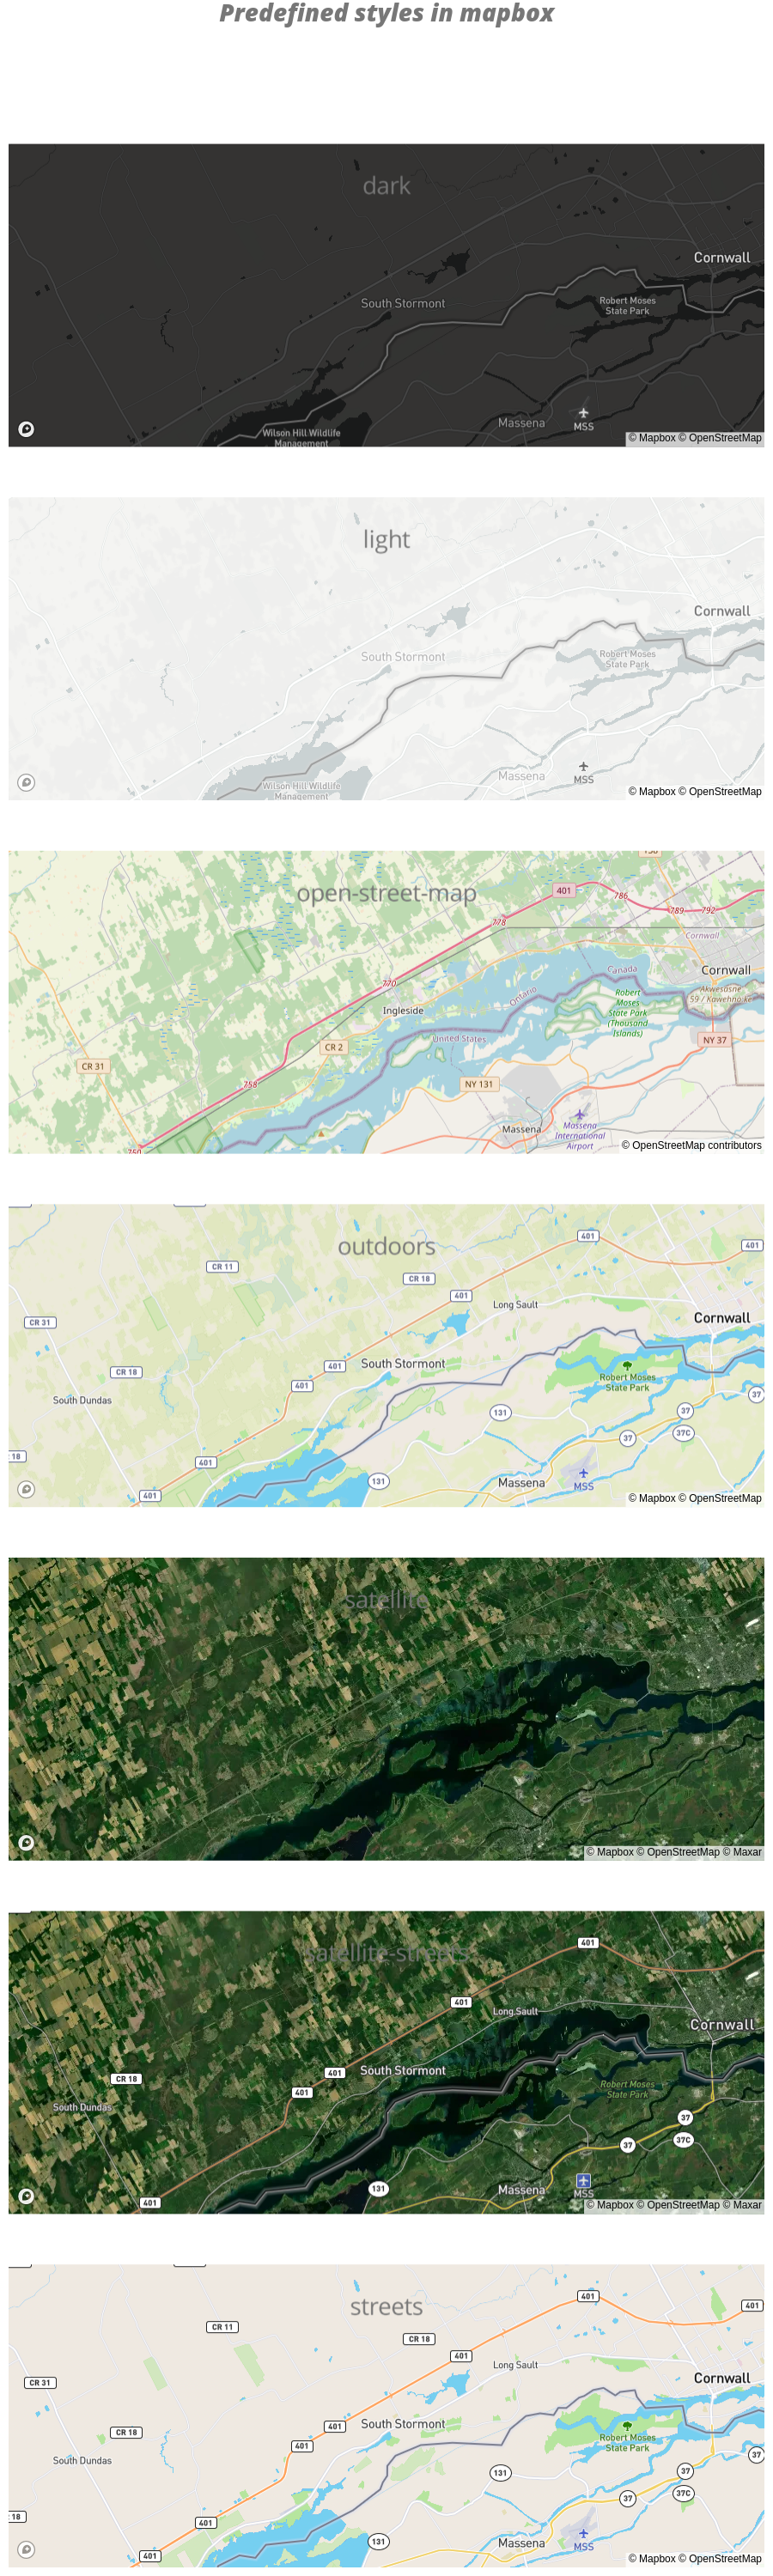
map_stylesettings. Withmapboxtraces, we bundlebasic,streets,outdoors,light,dark,satellite, andsatellite-streetsstyles, using Mapbox styling. These style names are still available, but they now reference slightly different styles provided by other tools.
Note that Mapbox API keys are no longer required for Plotly-provided styles, but using external styles in your Plotly maps remains supported with the existing API.
Style changes
Built-in styles in map traces are free styles from Carto and ESRI. Several names are re-used from the previous Mapbox styles.
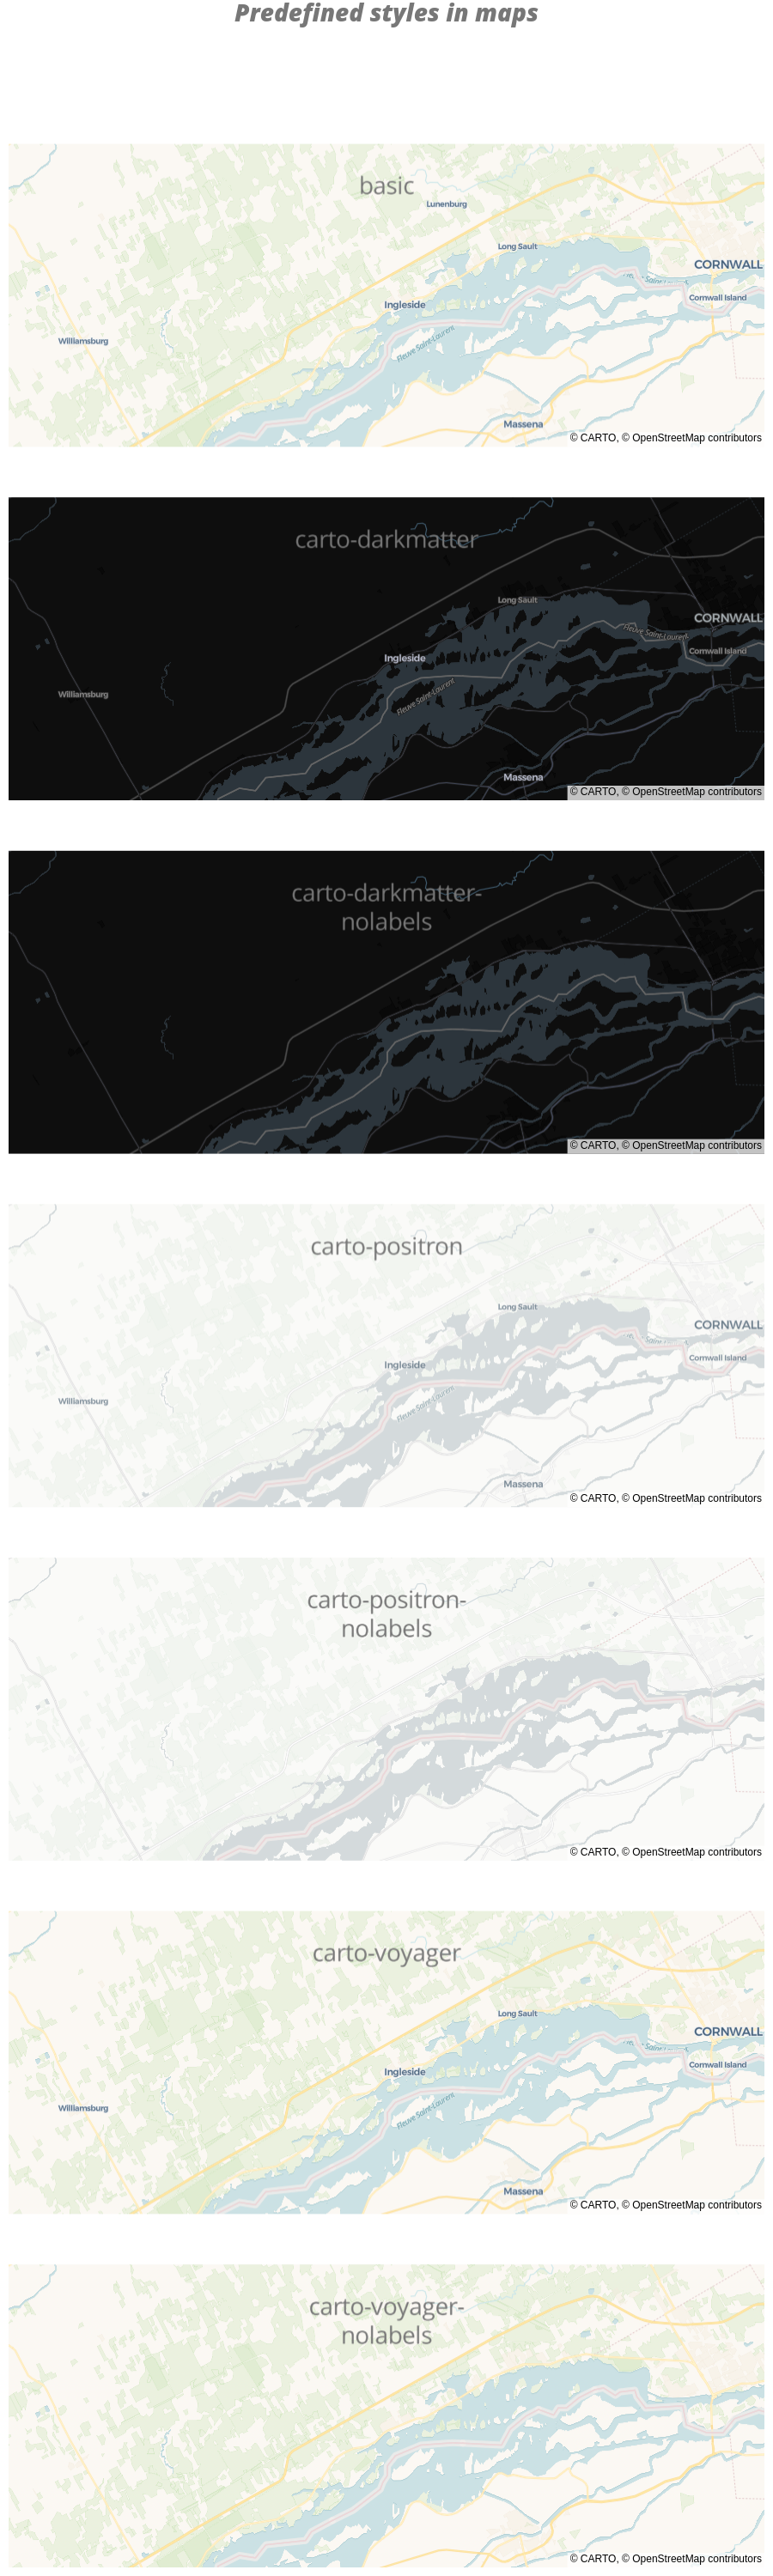
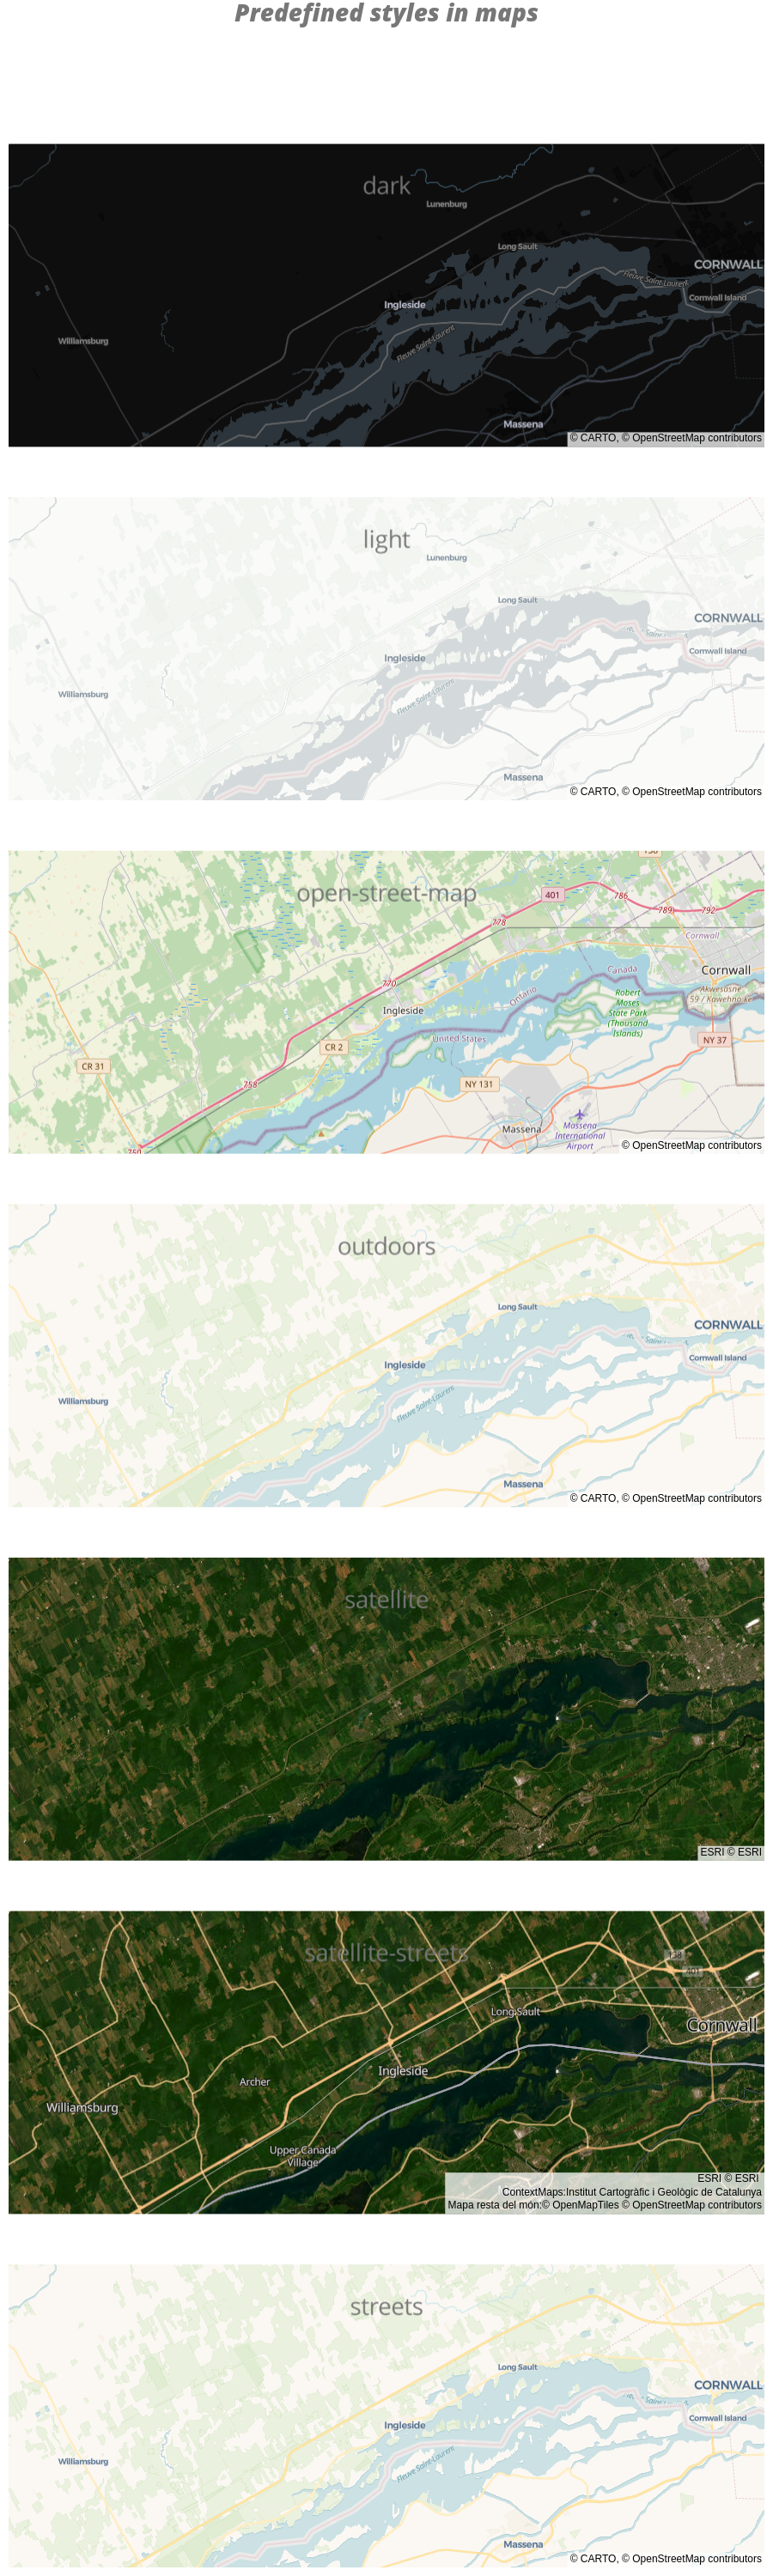
Compare to the previous Mapbox styles:
What About Dash?
Dash is an open-source framework for building analytical applications, with no Javascript required, and it is tightly integrated with the Plotly graphing library.
Learn about how to install Dash at https://dash.plot.ly/installation.
Everywhere in this page that you see fig.show(), you can display the same figure in a Dash application by passing it to the figure argument of the Graph component from the built-in dash_core_components package like this:
import plotly.graph_objects as go # or plotly.express as px
fig = go.Figure() # or any Plotly Express function e.g. px.bar(...)
# fig.add_trace( ... )
# fig.update_layout( ... )

from dash import Dash, dcc, html

app = Dash()
app.layout = html.Div([
    dcc.Graph(figure=fig)
])

app.run(debug=True, use_reloader=False)  # Turn off reloader if inside Jupyter
