Plot%20basics in ggplot2
Construct ggplots and then convert them with ggplotly
New to Plotly?
Plotly is a free and open-source graphing library for R. We recommend you read our Getting Started guide for the latest installation or upgrade instructions, then move on to our Plotly Fundamentals tutorials or dive straight in to some Basic Charts tutorials.
Create a plot
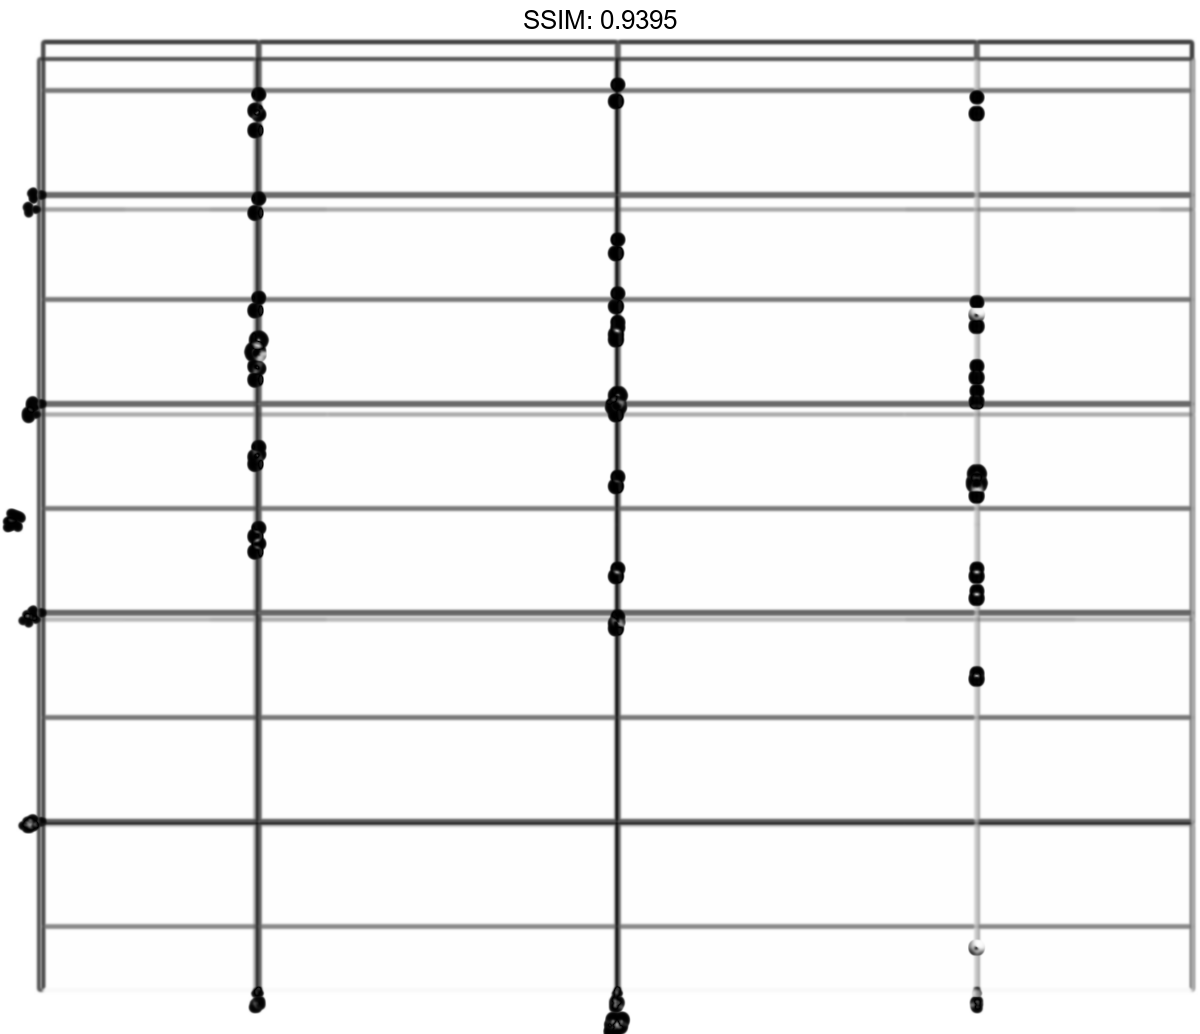
Generate some sample data, then compute mean and standard deviation in each group.
The summary data frame ds is used to plot larger red points on top of the raw data. Note that we don't need to supply data or mapping in each layer because the defaults from ggplot() are used.
df <- data.frame(
  gp = factor(rep(letters[1:3], each = 10)),
  y = rnorm(30)
)
ds <- do.call(rbind, lapply(split(df, df$gp), function(d) {
  data.frame(mean = mean(d$y), sd = sd(d$y), gp = d$gp)
}))
p <-
 ggplot(df, aes(gp, y)) +
  geom_point() +
  geom_point(data = ds, aes(y = mean), colour = 'red', size = 3)

plotly::ggplotly(p)


Same plot as above, declaring only the data frame in ggplot().
Note how the x and y aesthetics must now be declared in each geom_point() layer.
df <- data.frame(
  gp = factor(rep(letters[1:3], each = 10)),
  y = rnorm(30)
)
ds <- do.call(rbind, lapply(split(df, df$gp), function(d) {
  data.frame(mean = mean(d$y), sd = sd(d$y), gp = d$gp)
}))
p <-
 ggplot(df) +
  geom_point(aes(gp, y)) +
  geom_point(data = ds, aes(gp, mean), colour = 'red', size = 3)

plotly::ggplotly(p)


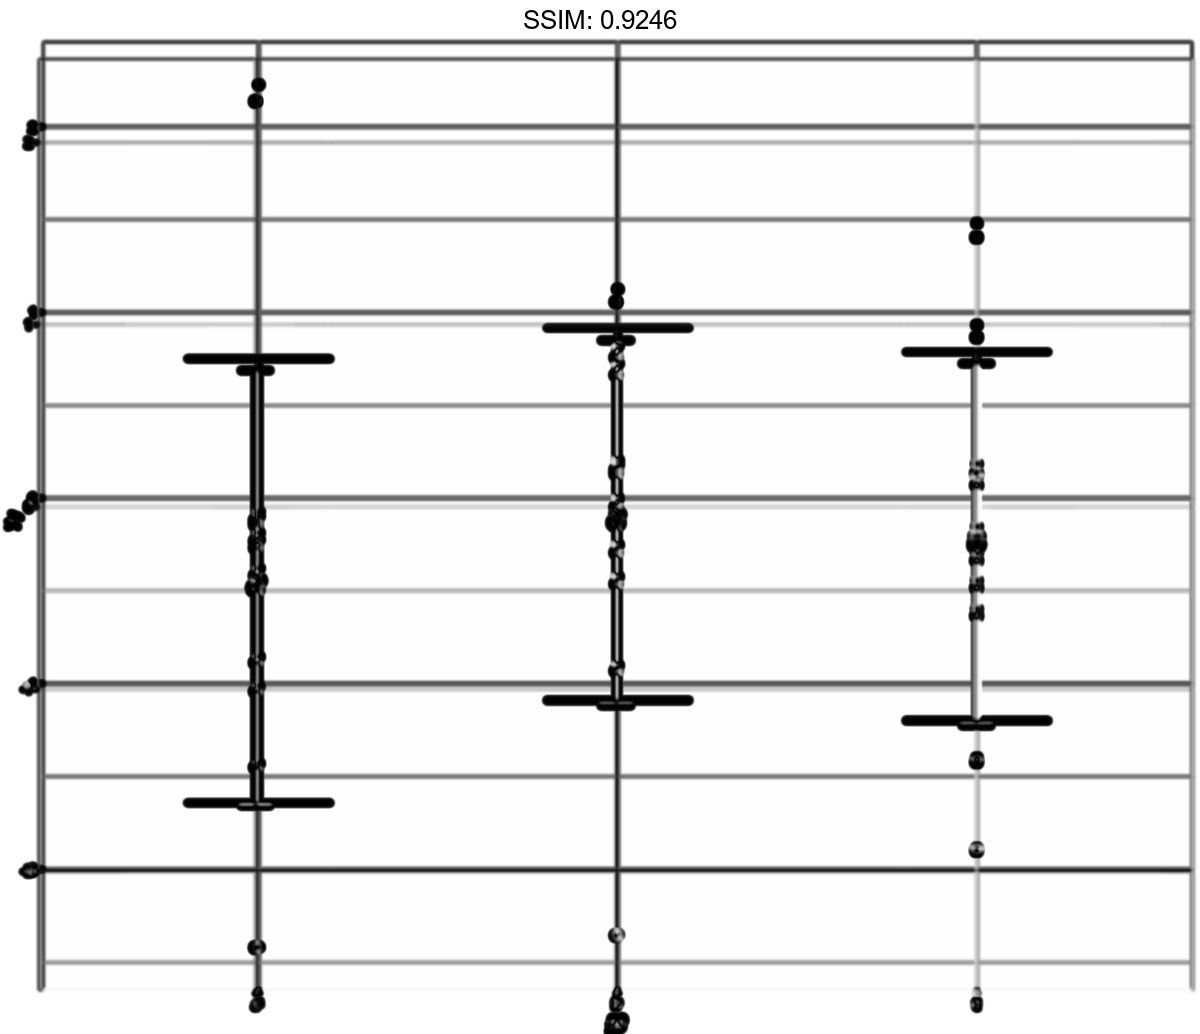
Add standard deviation markers
Alternatively we can fully specify the plot in each layer. This is not useful here, but can be more clear when working with complex multi-dataset graphics
df <- data.frame(
  gp = factor(rep(letters[1:3], each = 10)),
  y = rnorm(30)
)
ds <- do.call(rbind, lapply(split(df, df$gp), function(d) {
  data.frame(mean = mean(d$y), sd = sd(d$y), gp = d$gp)
}))
p <-
 ggplot() +
  geom_point(data = df, aes(gp, y)) +
  geom_point(data = ds, aes(gp, mean), colour = 'red', size = 3) +
  geom_errorbar(
    data = ds,
    aes(gp, mean, ymin = mean - sd, ymax = mean + sd),
    colour = 'red',
    width = 0.4
  )

plotly::ggplotly(p)


