Plot%20basics in ggplot2
Construct sophisticated graphics utilizing + and then convert them with ggplotly
New to Plotly?
Plotly is a free and open-source graphing library for R. We recommend you read our Getting Started guide for the latest installation or upgrade instructions, then move on to our Plotly Fundamentals tutorials or dive straight in to some Basic Charts tutorials.
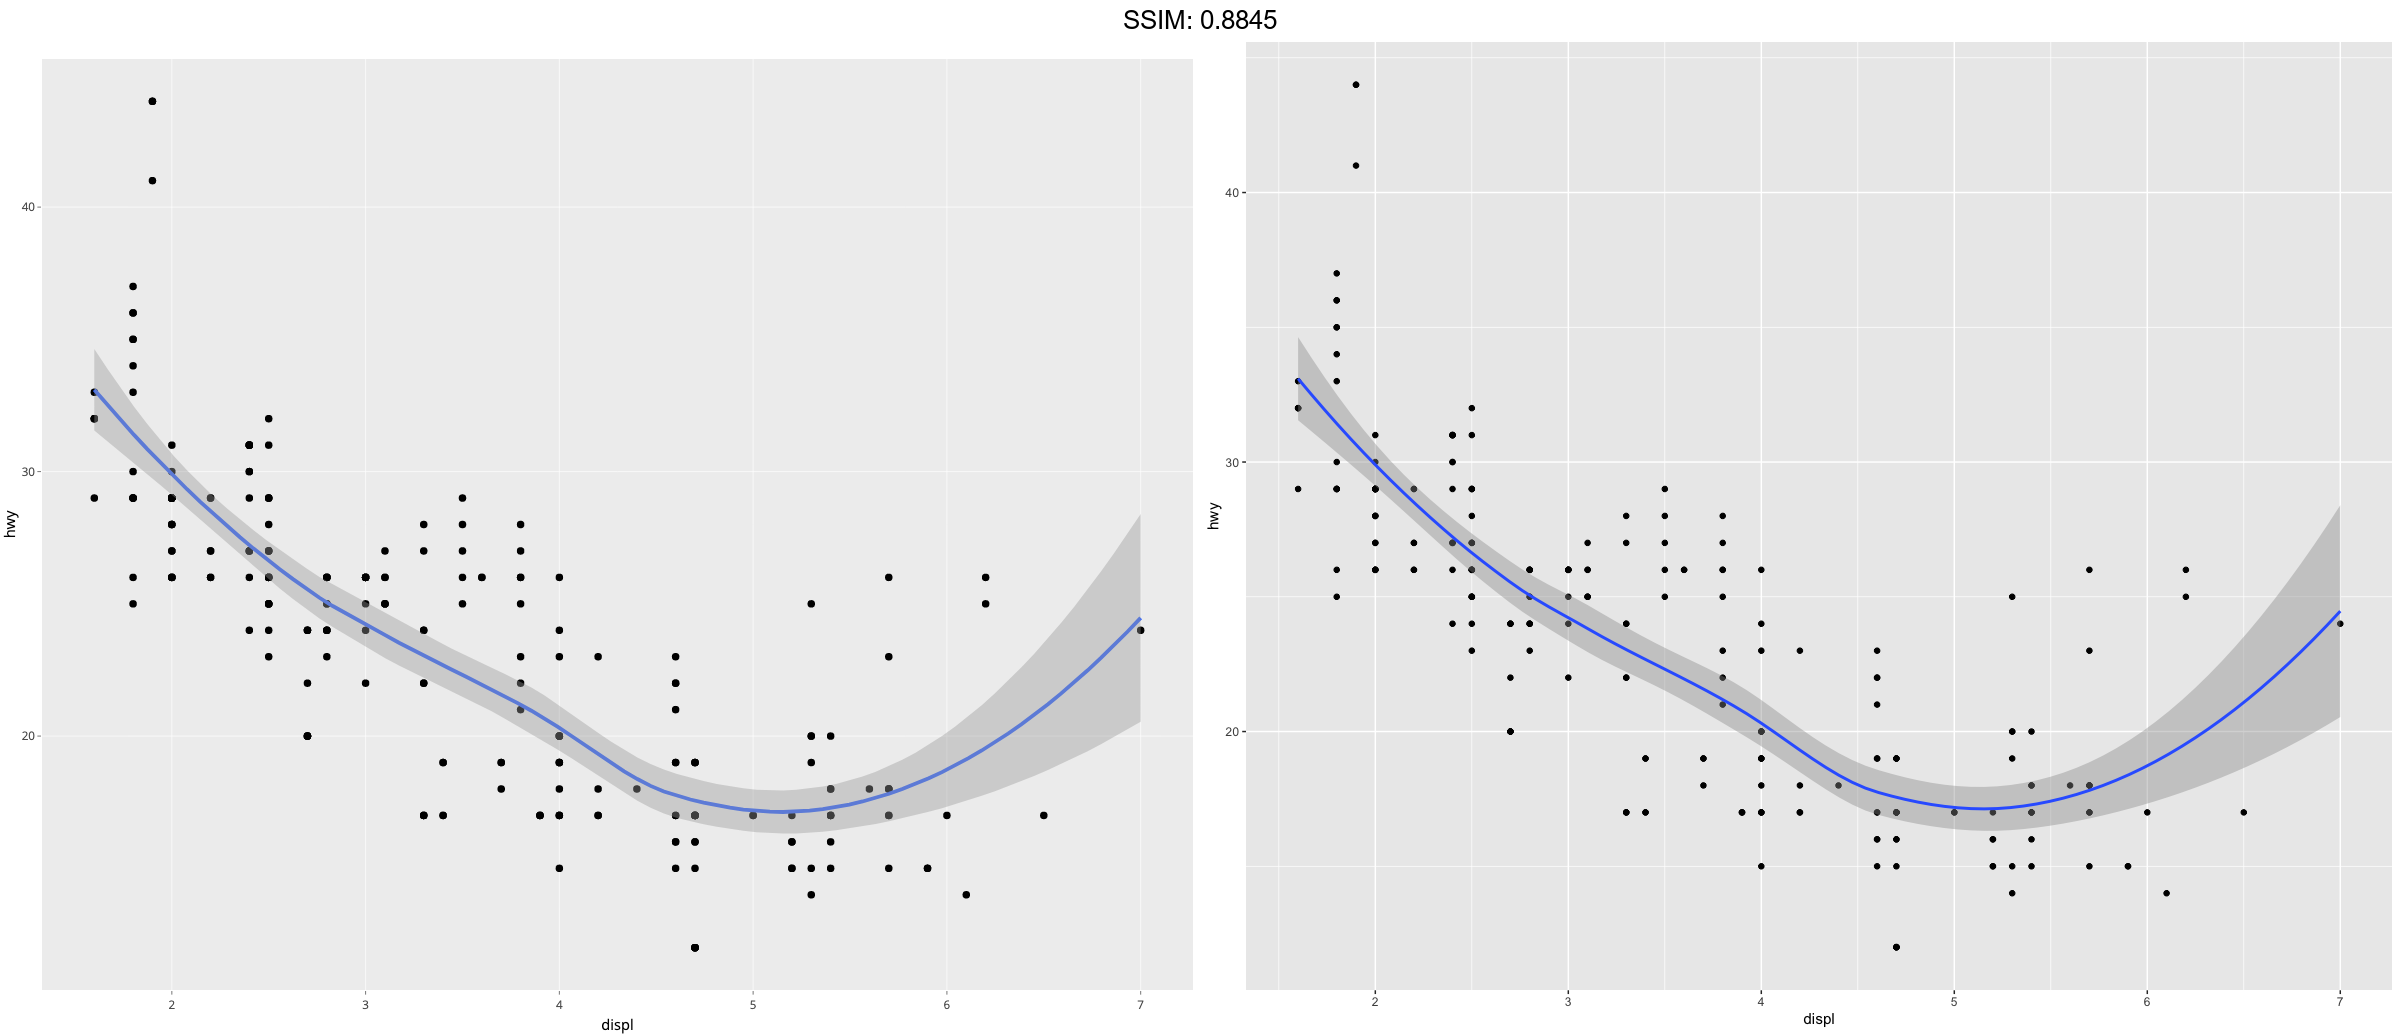
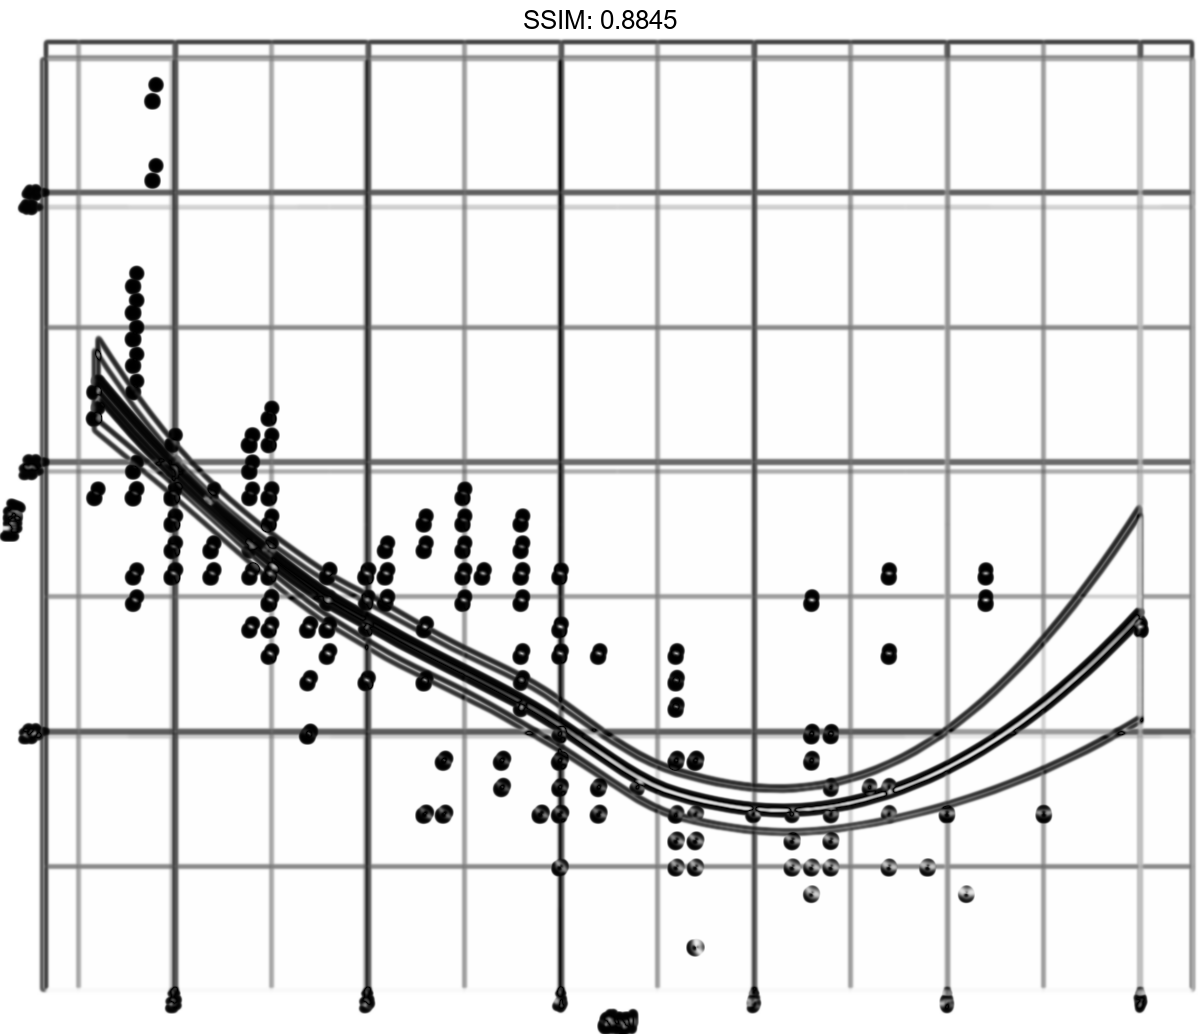
Create a scatter plot with smoohed line
geom_smooth() using method = 'loess' and formula 'y ~ x'
base <-
 ggplot(mpg, aes(displ, hwy)) +
 geom_point()
p <-  base + geom_smooth()

plotly::ggplotly(p)
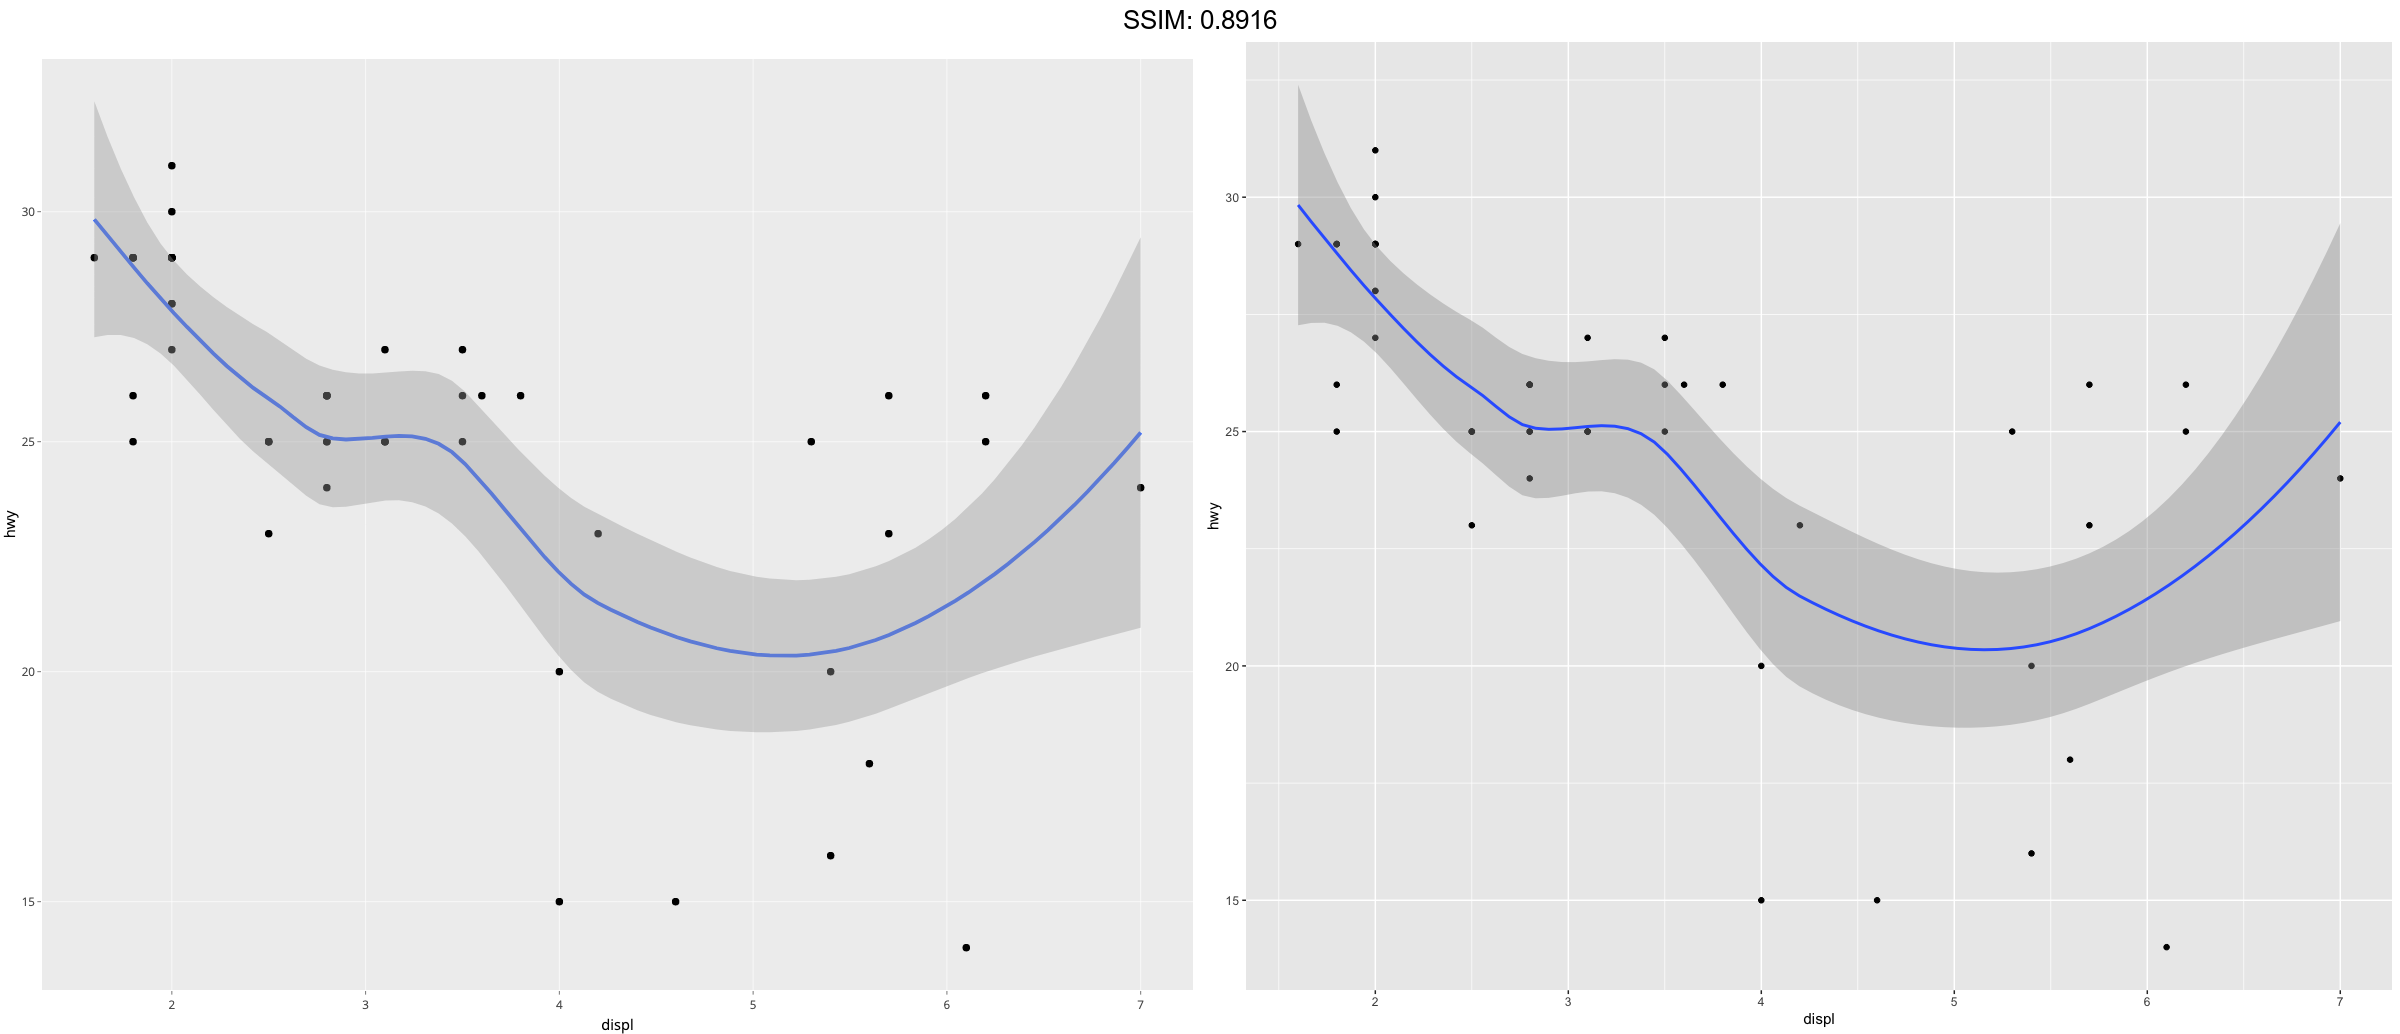
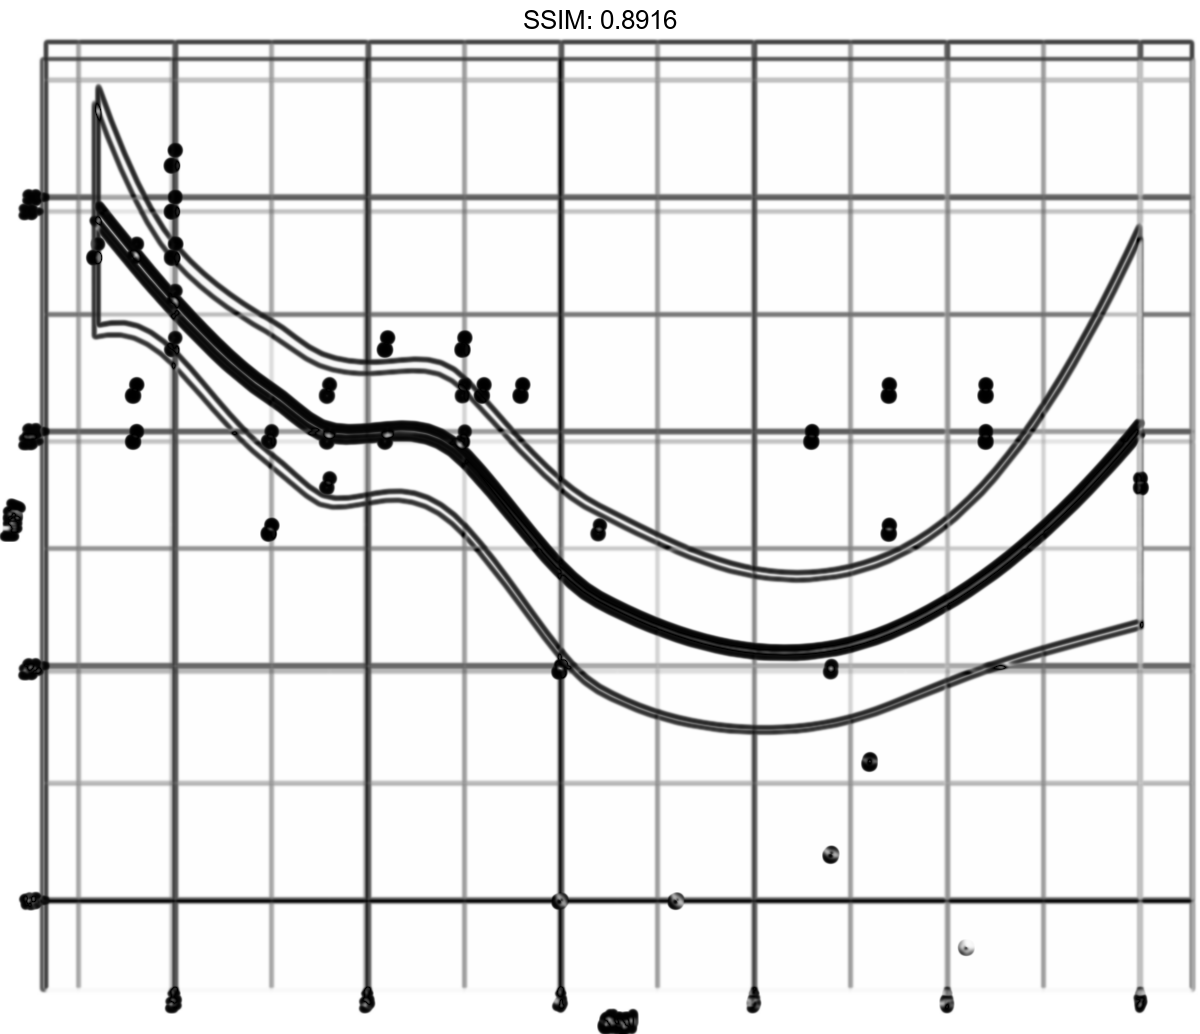
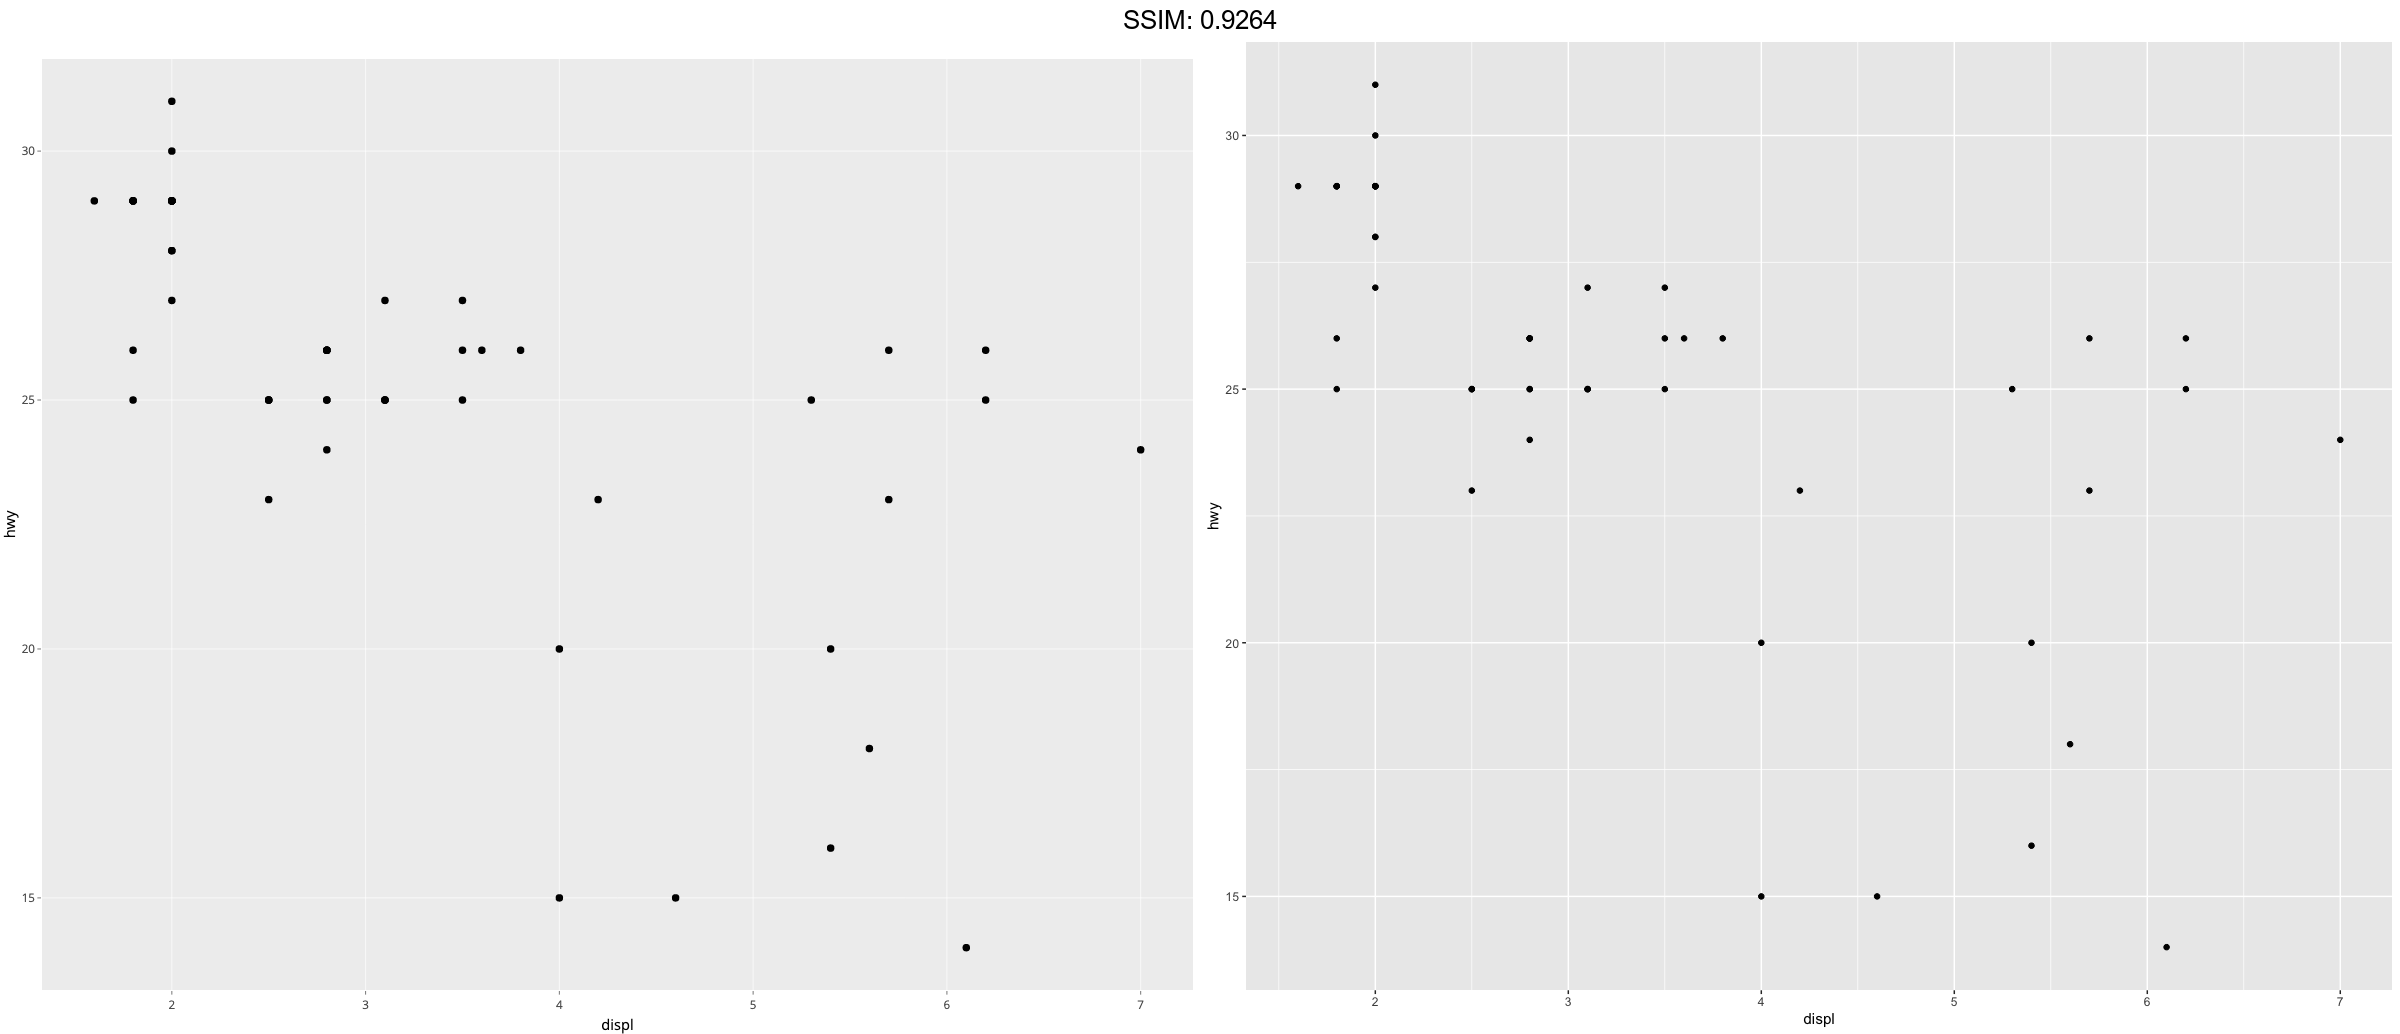
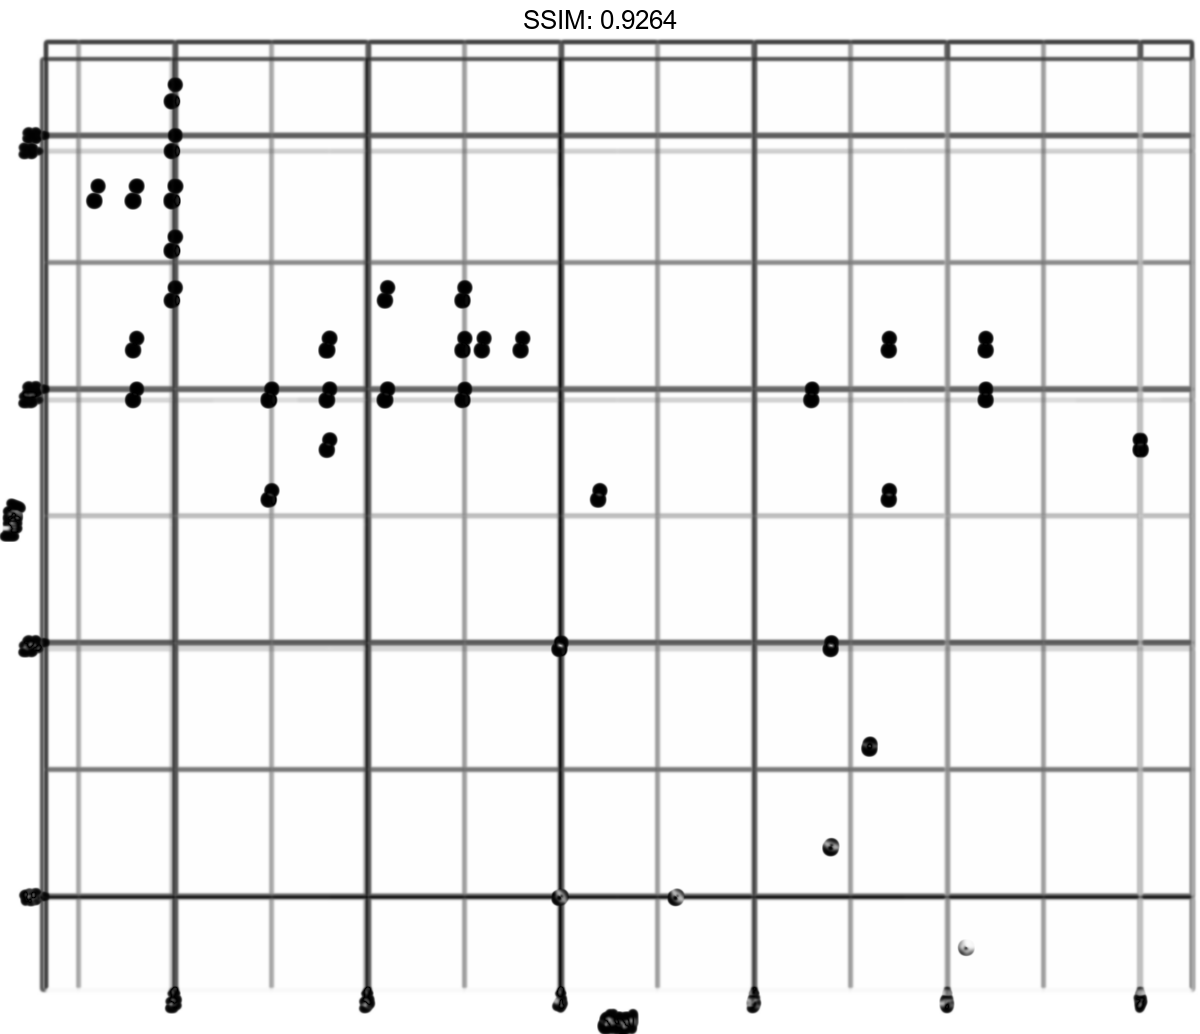
Override the data with %+%
base <-
 ggplot(mpg, aes(displ, hwy)) +
 geom_point()
p <-  base %+% subset(mpg, fl == "p")

plotly::ggplotly(p)
Add smoothed line of the subset data
Alternatively, you can add multiple components with a list. This can be useful to return from a function.
geom_smooth() using method = 'loess' and formula 'y ~ x'
base <-
 ggplot(mpg, aes(displ, hwy)) +
 geom_point()
p <-  base + list(subset(mpg, fl == "p"), geom_smooth())

plotly::ggplotly(p)