Plot%20basics in ggplot2
Construct aesthetic mappings and then convert them with ggplotly
New to Plotly?
Plotly is a free and open-source graphing library for R. We recommend you read our Getting Started guide for the latest installation or upgrade instructions, then move on to our Plotly Fundamentals tutorials or dive straight in to some Basic Charts tutorials.
Create a plot
aes() is passed to either ggplot() or specific layer. Aesthetics supplied to ggplot() are used as defaults for every layer.
p <-  ggplot(mpg, aes(displ, hwy)) + geom_point()

plotly::ggplotly(p)


p <-  ggplot(mpg) + geom_point(aes(displ, hwy))

plotly::ggplotly(p)

Tidy evaluation
Wrapper using ...
aes() automatically quotes all its arguments, so you need to use tidy evaluation to create wrappers around ggplot2 pipelines.
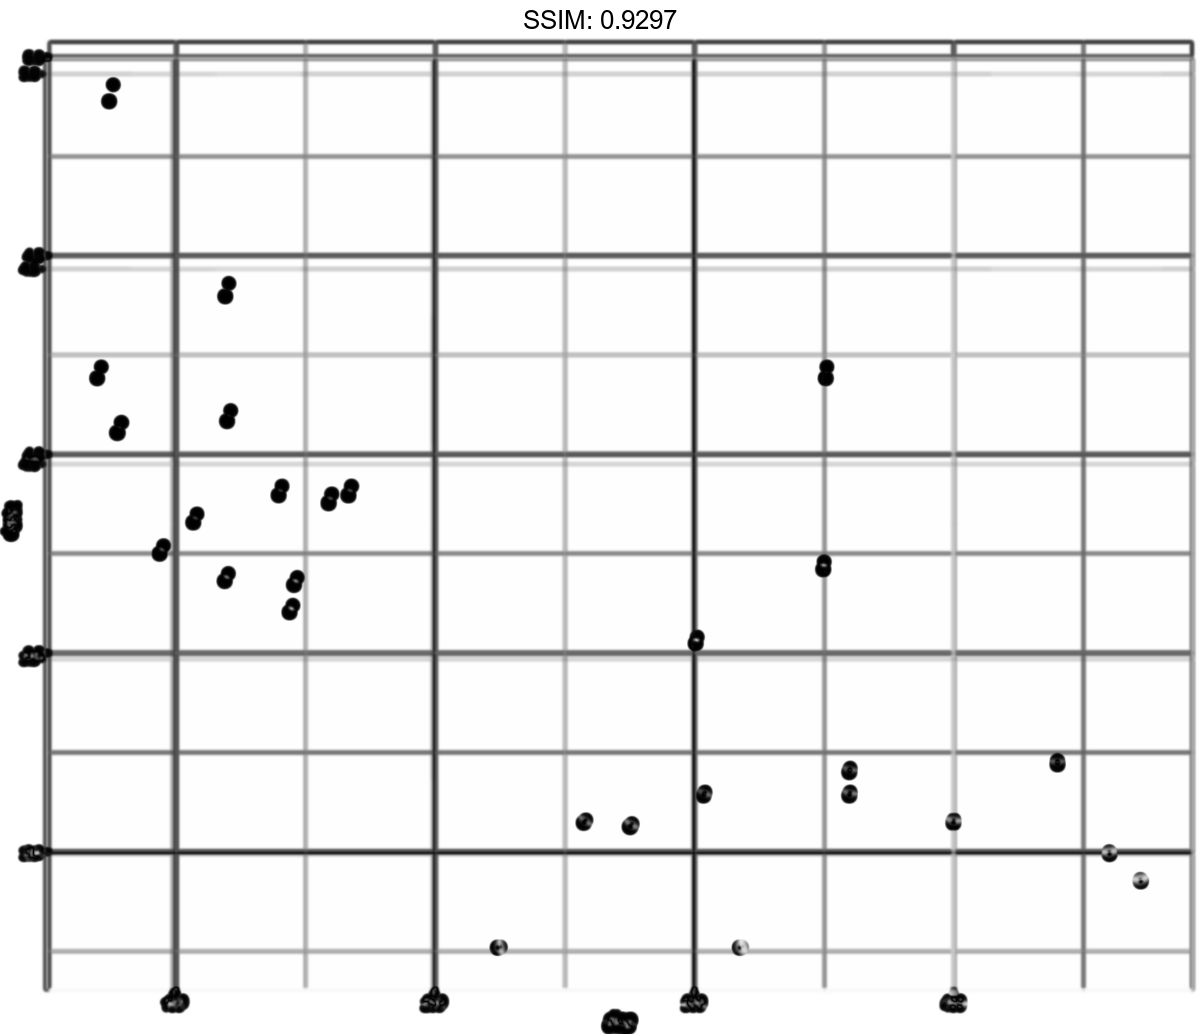
The simplest case occurs when your wrapper takes dots:
scatter_by <- function(data, ...) {
  ggplot(data) + geom_point(aes(...))
}
p <-  scatter_by(mtcars, disp, drat)

plotly::ggplotly(p)

Wrapper using named arguments
If your wrapper has a more specific interface with named arguments, you need "enquote and unquote":
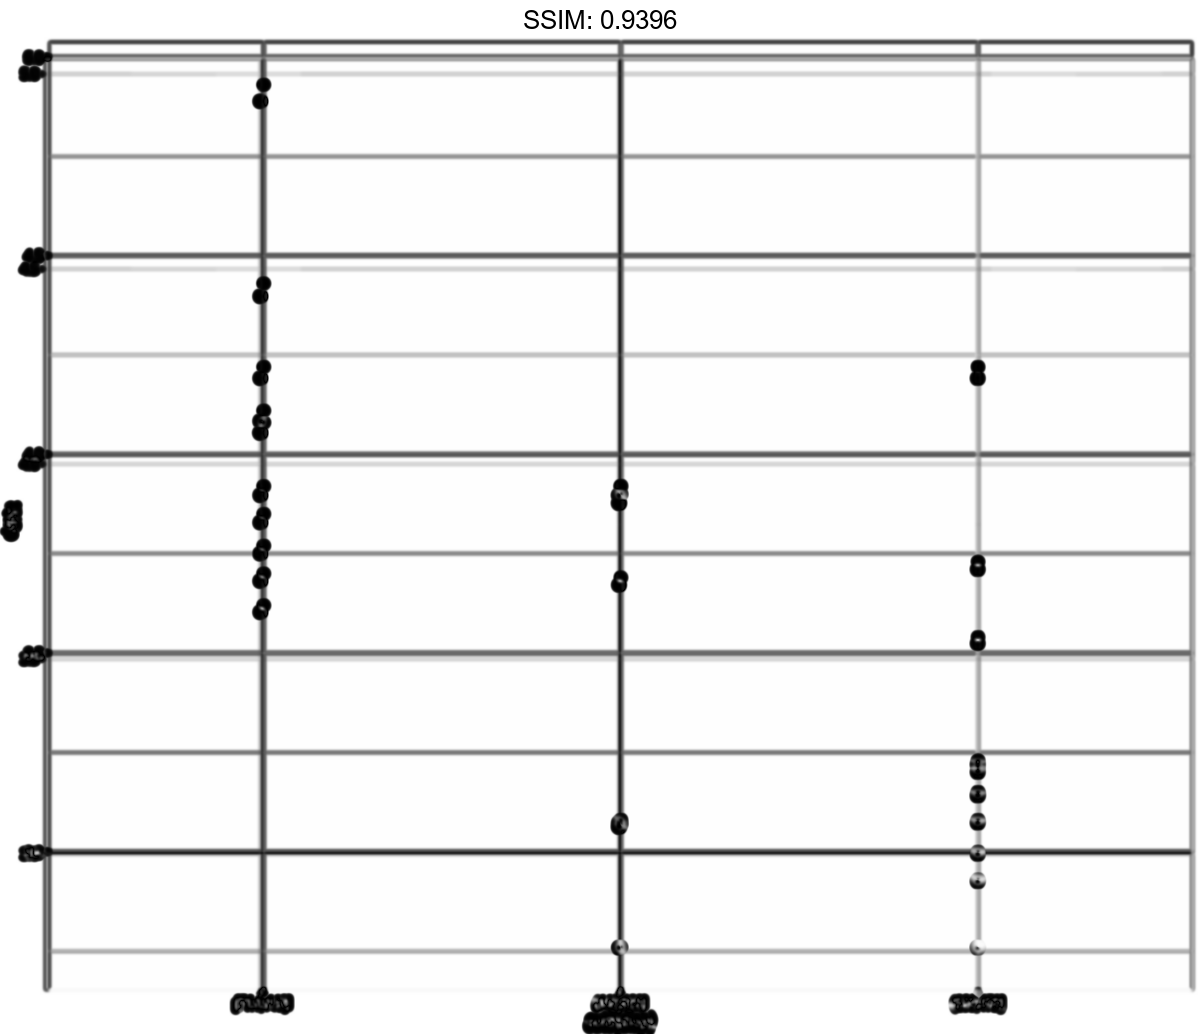
scatter_by <- function(data, x, y) {
  x <- enquo(x)
  y <- enquo(y)

  ggplot(data) + geom_point(aes(!!x, !!y))
}
p <-  scatter_by(mtcars, disp, drat)

plotly::ggplotly(p)


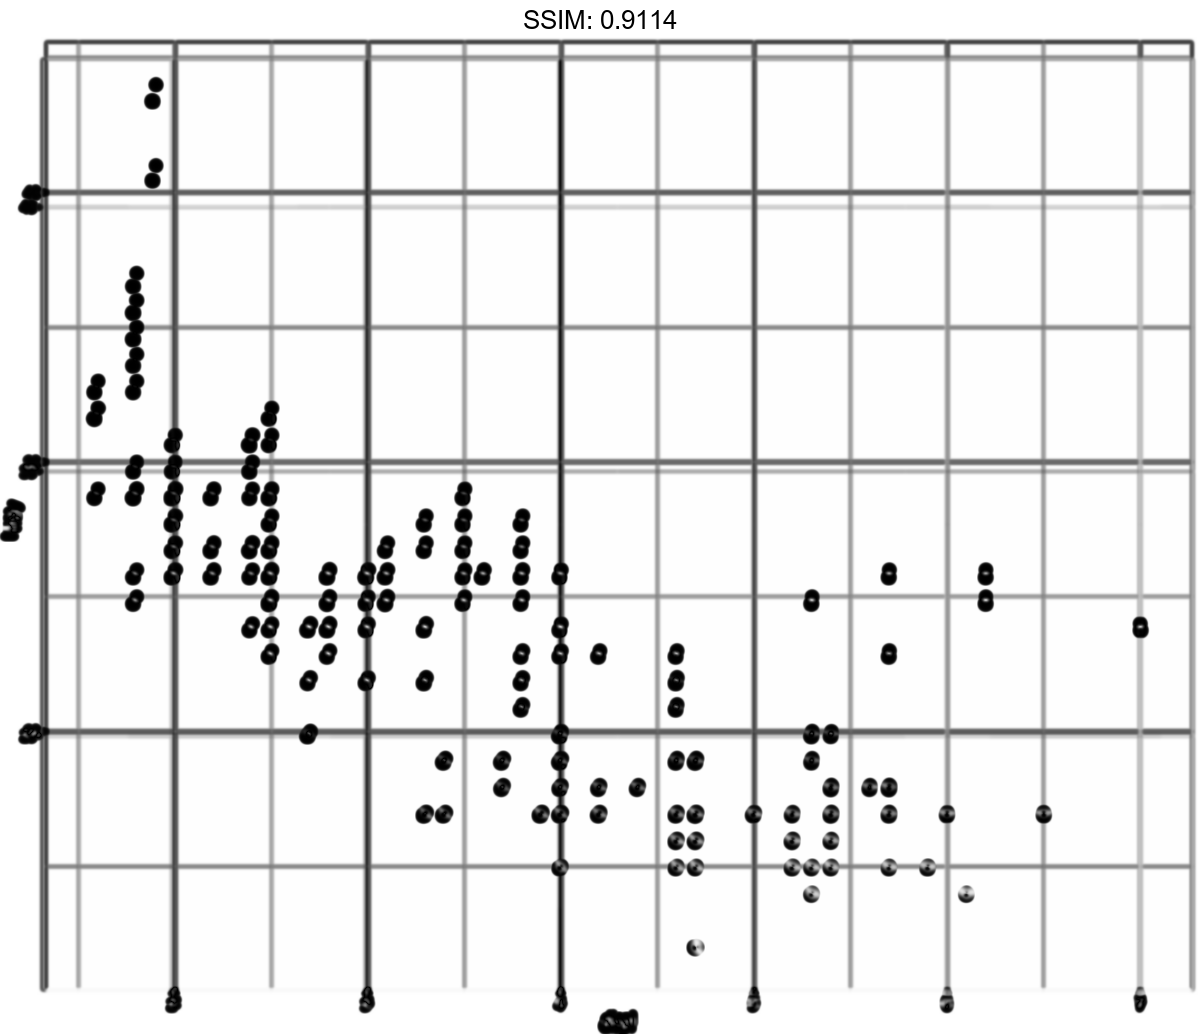
Wrapper with another function
Note that users of your wrapper can use their own functions in the quoted expressions and all will resolve as it should! Flatten the data into 3 groups with same number of observations:
cut3 <- function(x) cut_number(x, 3)
p <-  scatter_by(mtcars, cut3(disp), drat)

plotly::ggplotly(p)