Themes in ggplot2
New to Plotly?
Plotly is a free and open-source graphing library for R. We recommend you read our Getting Started guide for the latest installation or upgrade instructions, then move on to our Plotly Fundamentals tutorials or dive straight in to some Basic Charts tutorials.
Give complete themes which control all non-data display and then convert them with ggplotly.
mtcars2 <- within(mtcars, {
vs <- factor(vs, labels = c("V-shaped", "Straight"))
am <- factor(am, labels = c("Automatic", "Manual"))
cyl <- factor(cyl)
gear <- factor(gear)
})
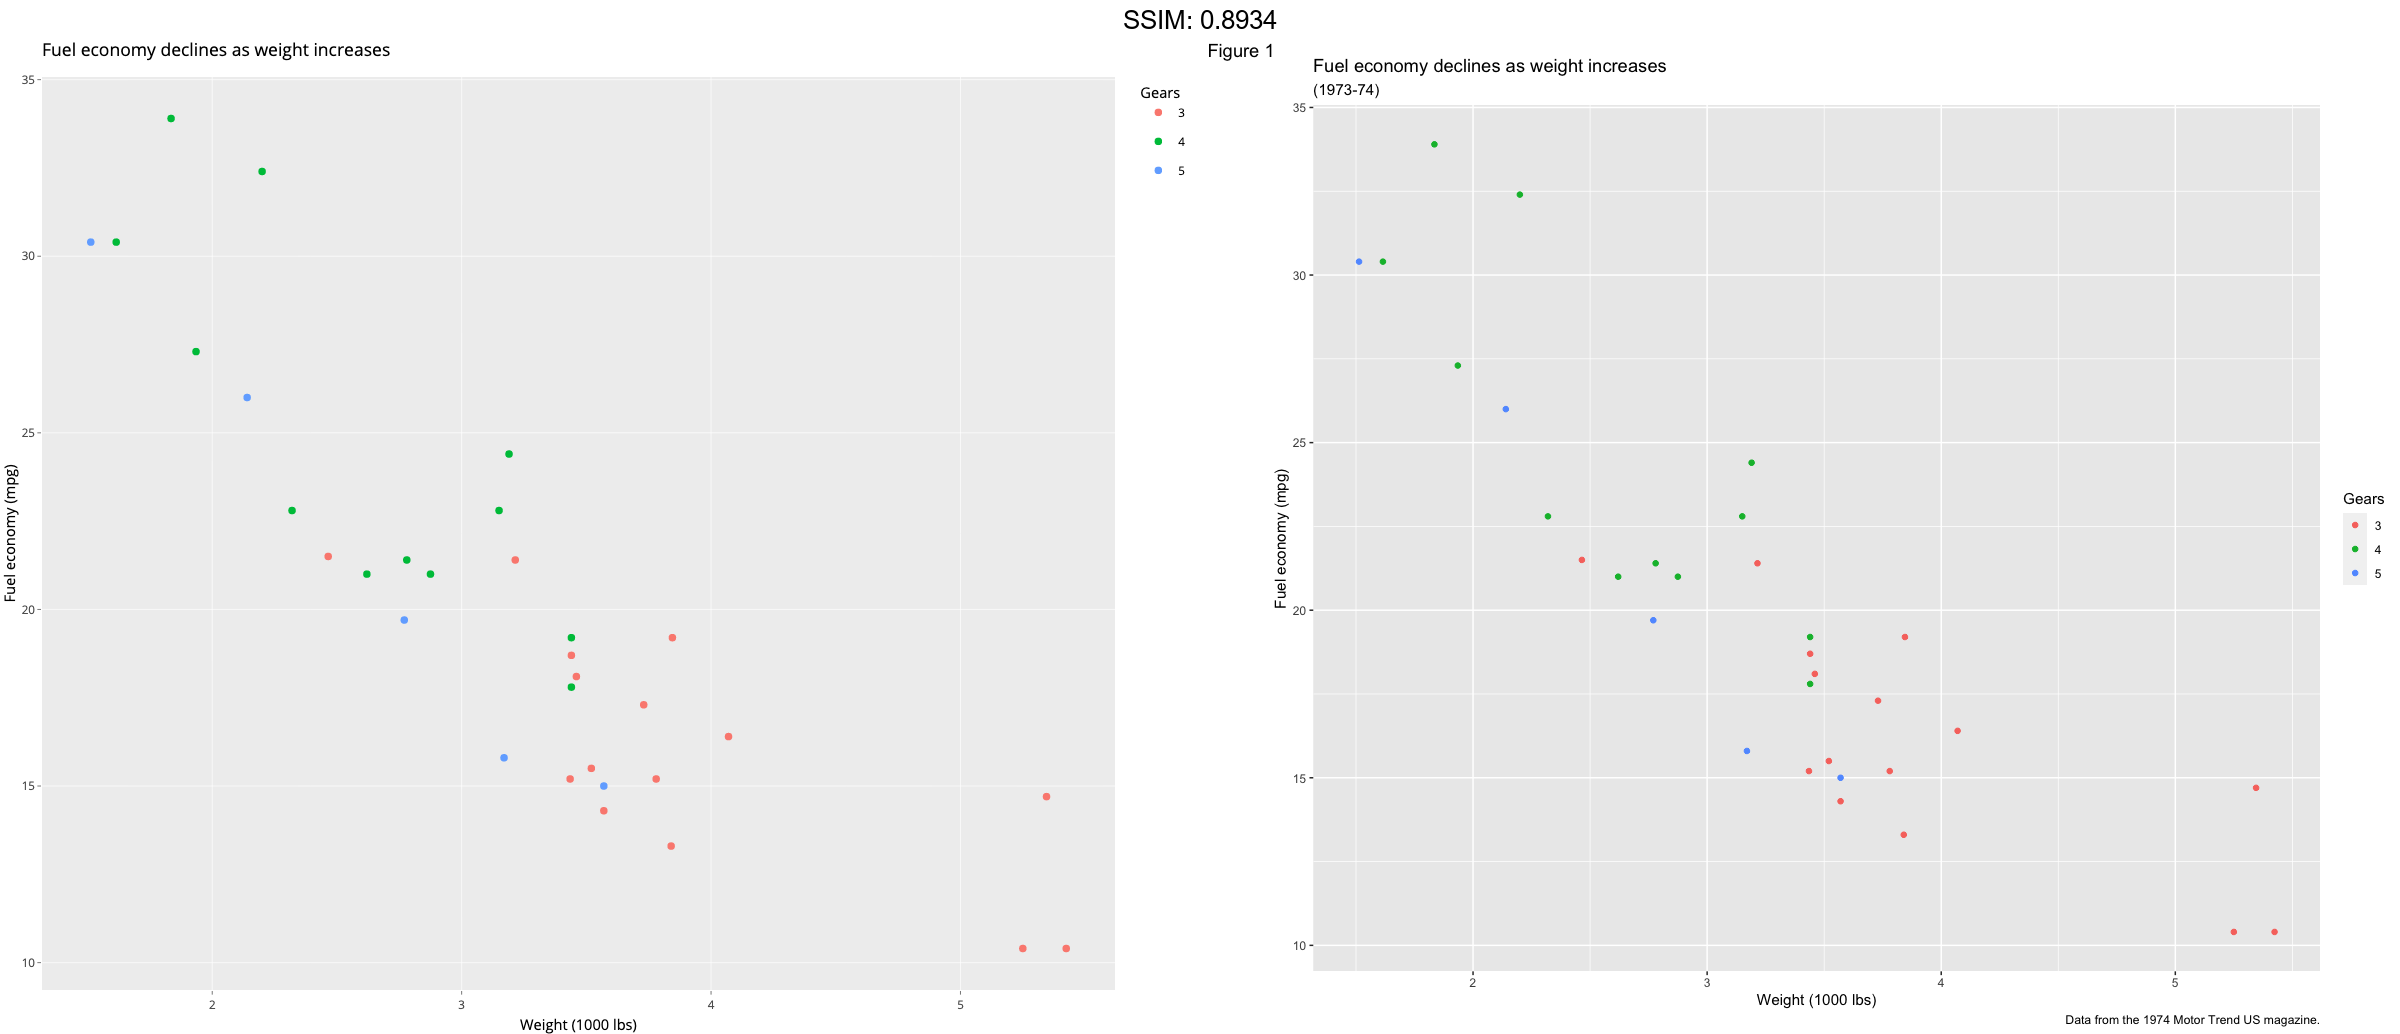
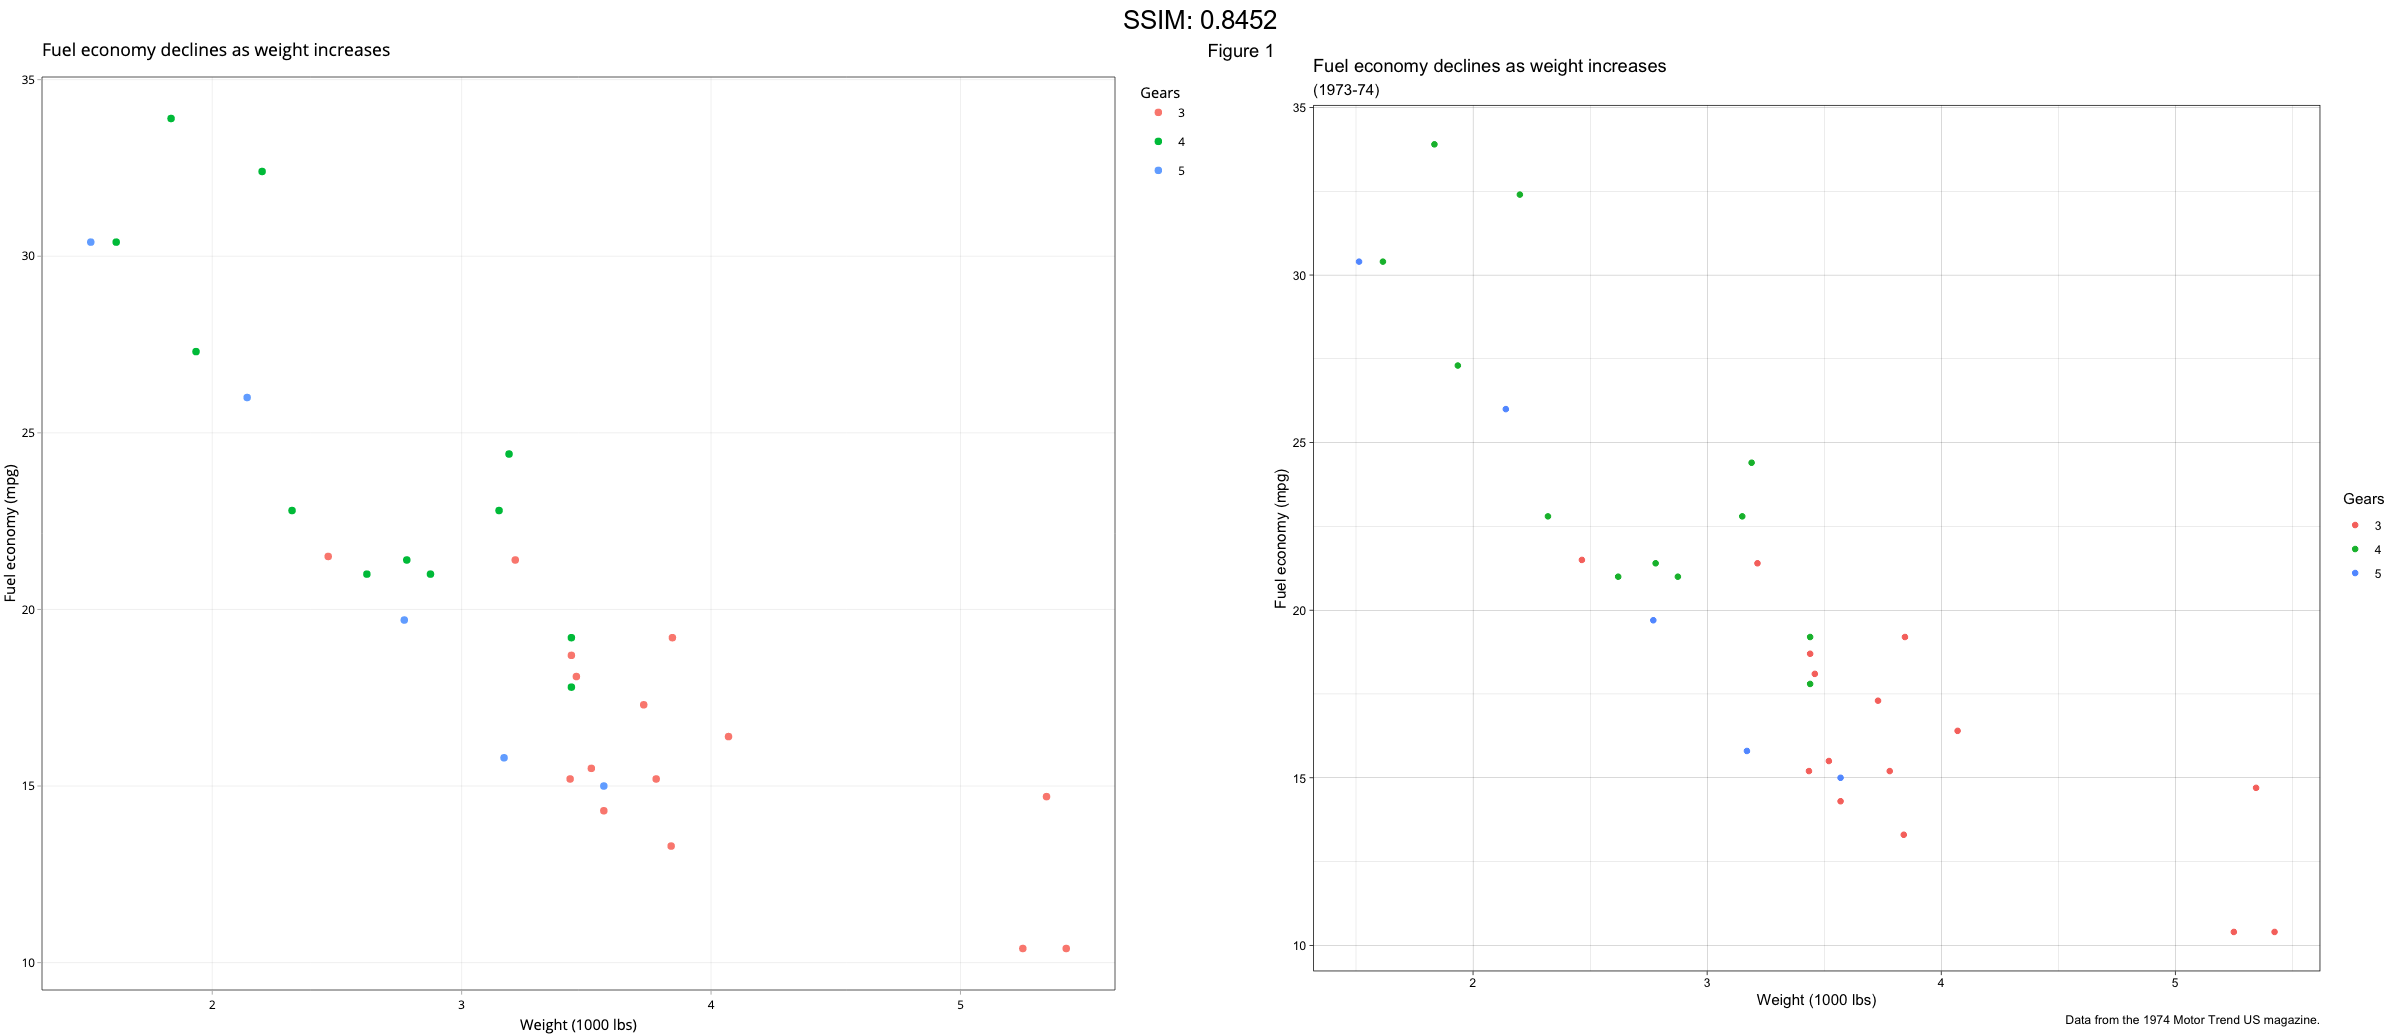
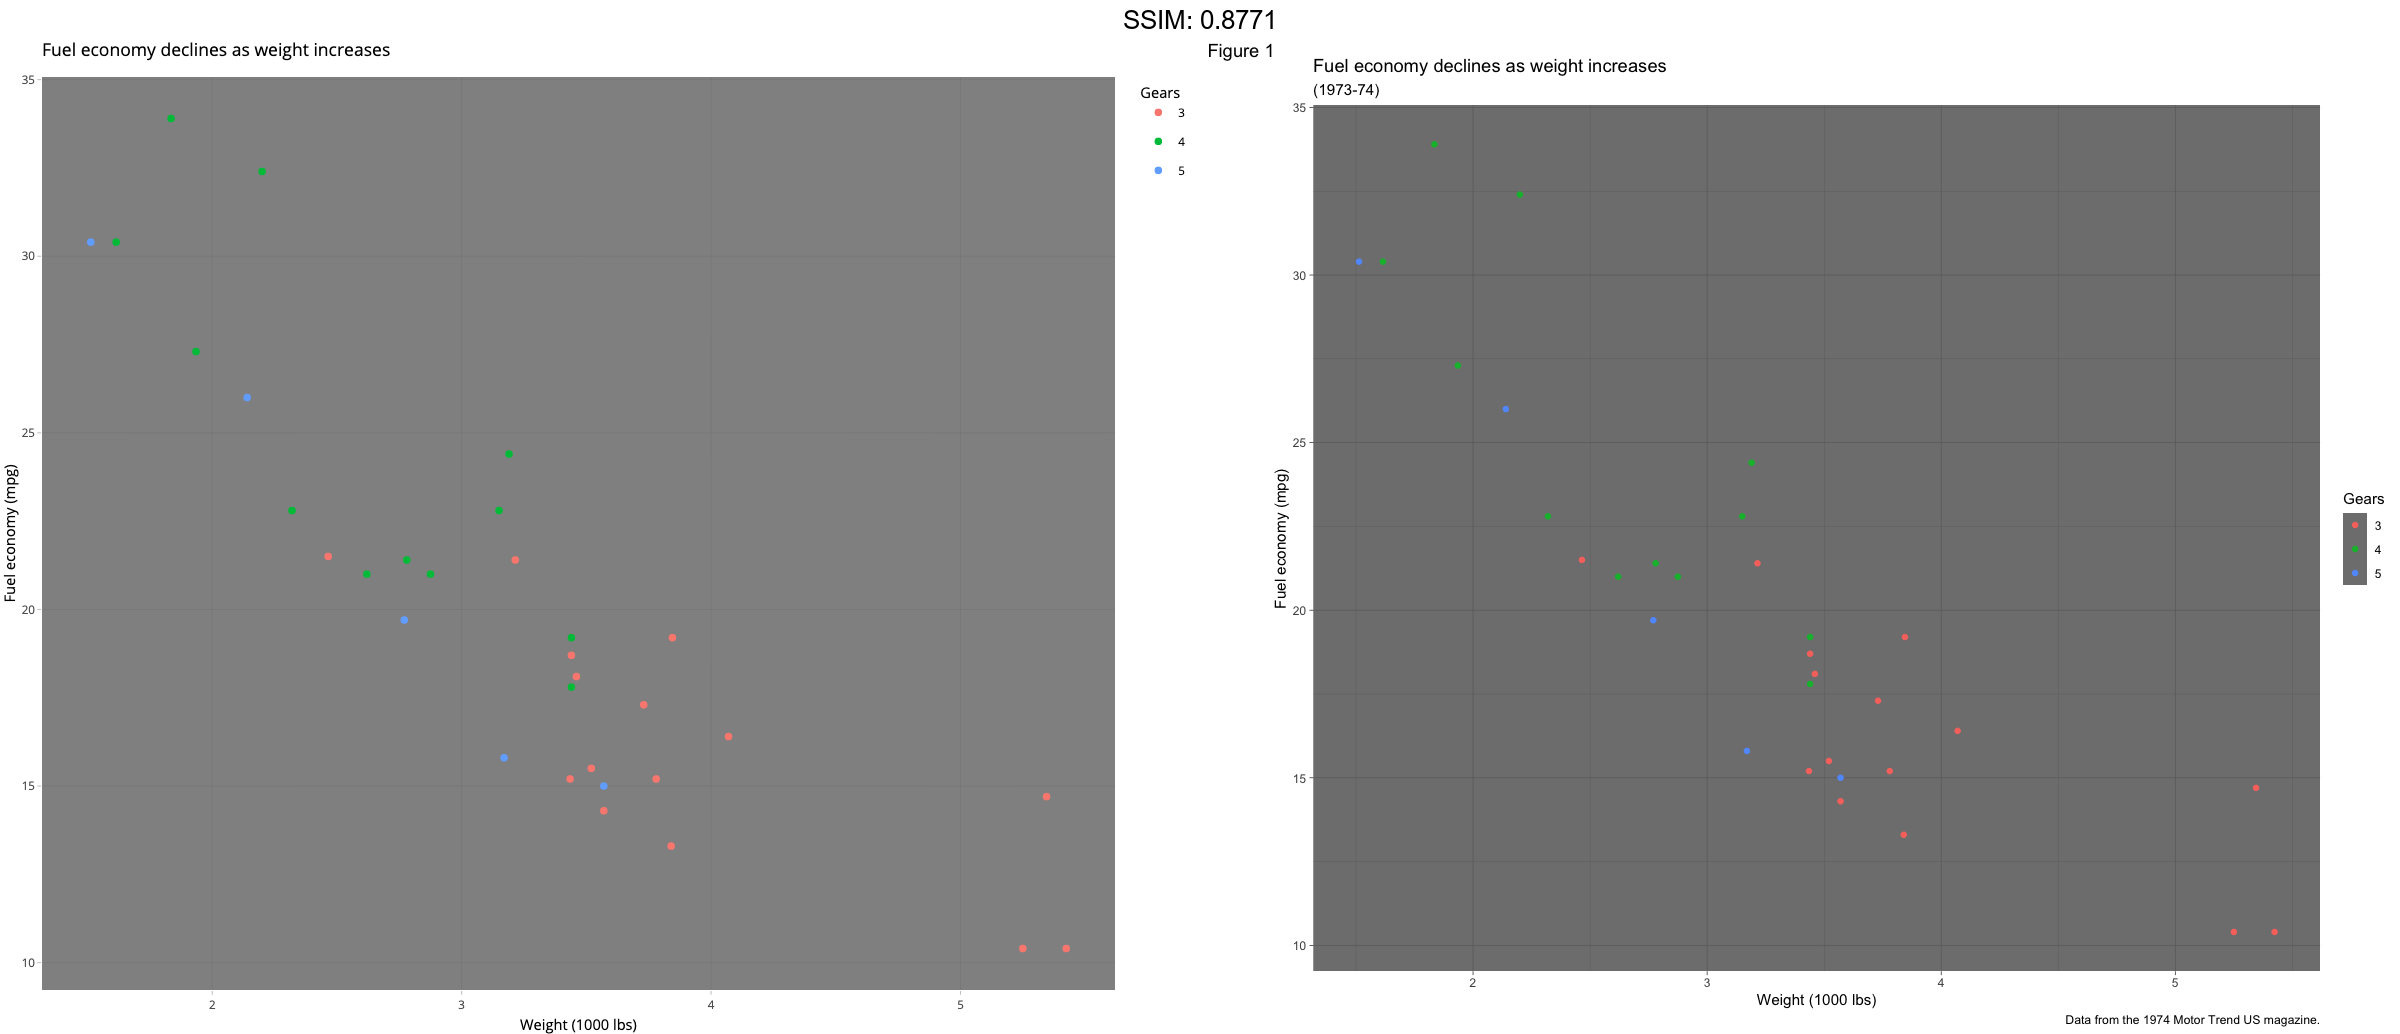
p1 <- ggplot(mtcars2) +
geom_point(aes(x = wt, y = mpg, colour = gear)) +
labs(
title = "Fuel economy declines as weight increases",
subtitle = "(1973-74)",
caption = "Data from the 1974 Motor Trend US magazine.",
tag = "Figure 1",
x = "Weight (1000 lbs)",
y = "Fuel economy (mpg)",
colour = "Gears"
)
p <- p1 + theme_gray() # the default
plotly::ggplotly(p)
mtcars2 <- within(mtcars, {
vs <- factor(vs, labels = c("V-shaped", "Straight"))
am <- factor(am, labels = c("Automatic", "Manual"))
cyl <- factor(cyl)
gear <- factor(gear)
})
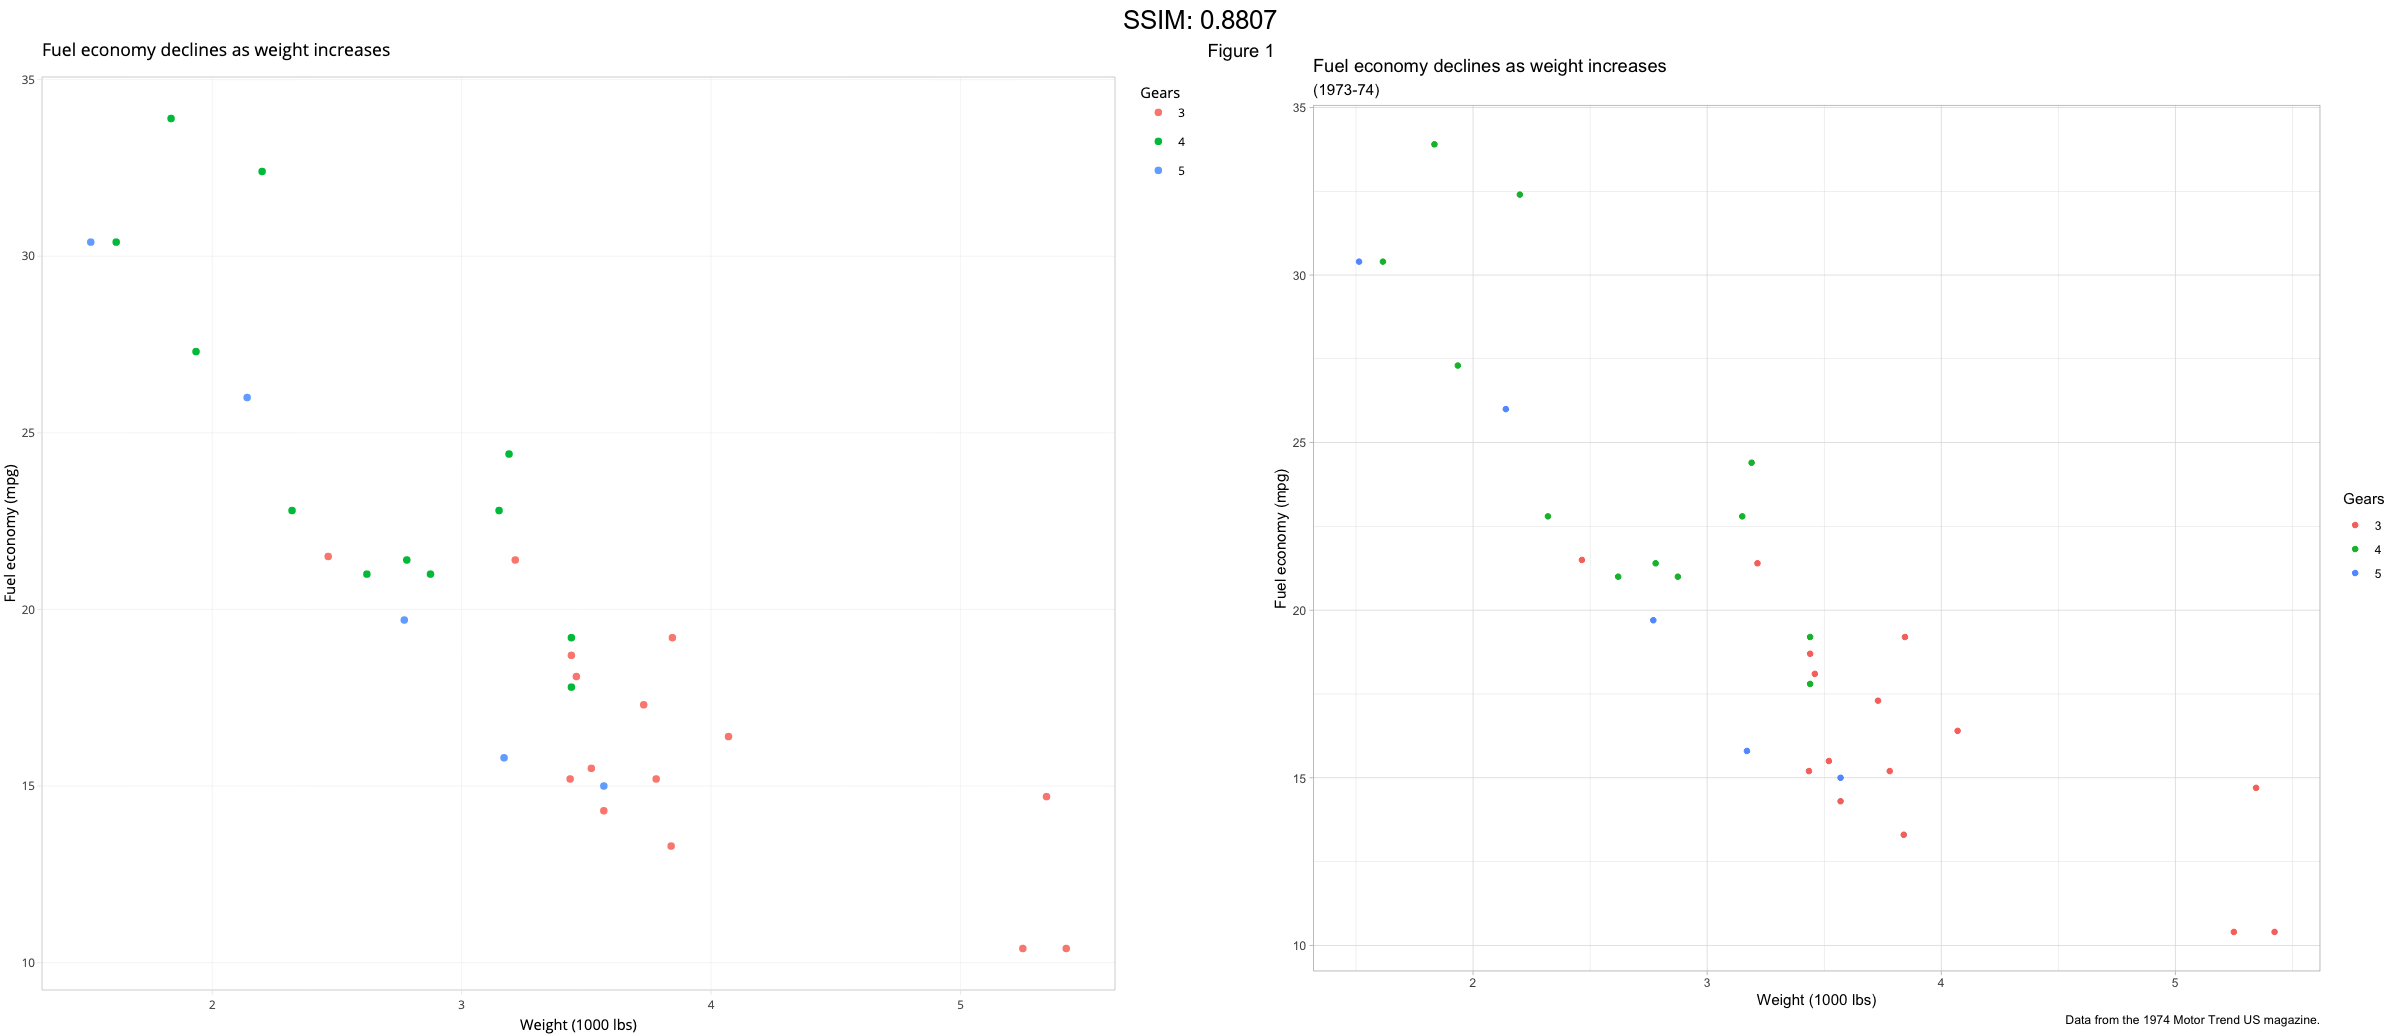
p1 <- ggplot(mtcars2) +
geom_point(aes(x = wt, y = mpg, colour = gear)) +
labs(
title = "Fuel economy declines as weight increases",
subtitle = "(1973-74)",
caption = "Data from the 1974 Motor Trend US magazine.",
tag = "Figure 1",
x = "Weight (1000 lbs)",
y = "Fuel economy (mpg)",
colour = "Gears"
)
p <- p1 + theme_bw()
plotly::ggplotly(p)


mtcars2 <- within(mtcars, {
  vs <- factor(vs, labels = c("V-shaped", "Straight"))
  am <- factor(am, labels = c("Automatic", "Manual"))
  cyl  <- factor(cyl)
  gear <- factor(gear)
})

p1 <- ggplot(mtcars2) +
  geom_point(aes(x = wt, y = mpg, colour = gear)) +
  labs(
    title = "Fuel economy declines as weight increases",
    subtitle = "(1973-74)",
    caption = "Data from the 1974 Motor Trend US magazine.",
    tag = "Figure 1",
    x = "Weight (1000 lbs)",
    y = "Fuel economy (mpg)",
    colour = "Gears"
  )
p <-  p1 + theme_linedraw()
plotly::ggplotly(p)
mtcars2 <- within(mtcars, {
  vs <- factor(vs, labels = c("V-shaped", "Straight"))
  am <- factor(am, labels = c("Automatic", "Manual"))
  cyl  <- factor(cyl)
  gear <- factor(gear)
})

p1 <- ggplot(mtcars2) +
  geom_point(aes(x = wt, y = mpg, colour = gear)) +
  labs(
    title = "Fuel economy declines as weight increases",
    subtitle = "(1973-74)",
    caption = "Data from the 1974 Motor Trend US magazine.",
    tag = "Figure 1",
    x = "Weight (1000 lbs)",
    y = "Fuel economy (mpg)",
    colour = "Gears"
  )
p <-  p1 + theme_light()
plotly::ggplotly(p)
mtcars2 <- within(mtcars, {
vs <- factor(vs, labels = c("V-shaped", "Straight"))
am <- factor(am, labels = c("Automatic", "Manual"))
cyl <- factor(cyl)
gear <- factor(gear)
})
p1 <- ggplot(mtcars2) +
geom_point(aes(x = wt, y = mpg, colour = gear)) +
labs(
title = "Fuel economy declines as weight increases",
subtitle = "(1973-74)",
caption = "Data from the 1974 Motor Trend US magazine.",
tag = "Figure 1",
x = "Weight (1000 lbs)",
y = "Fuel economy (mpg)",
colour = "Gears"
)
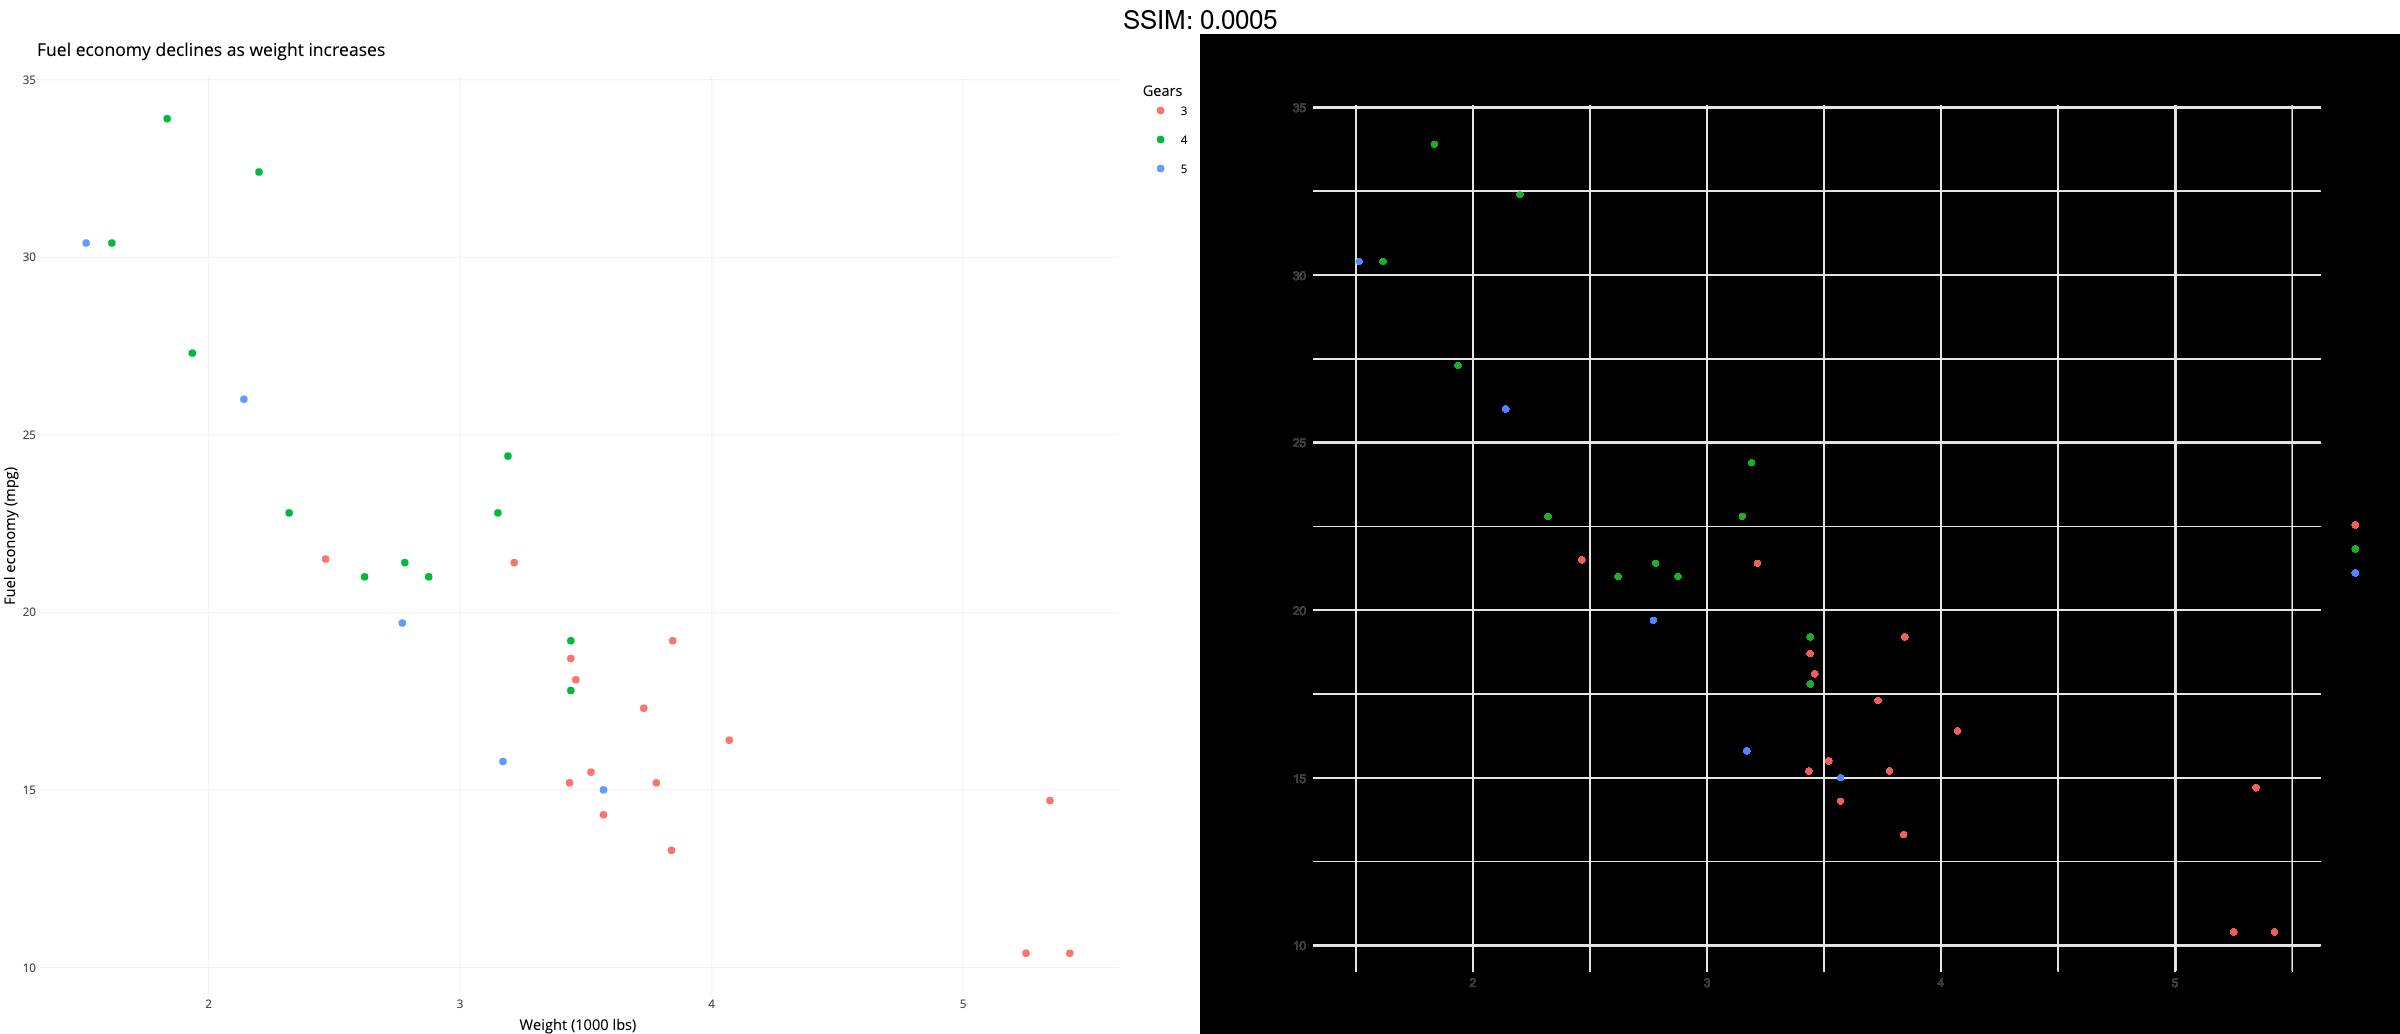
p <- p1 + theme_dark()
plotly::ggplotly(p)
mtcars2 <- within(mtcars, {
vs <- factor(vs, labels = c("V-shaped", "Straight"))
am <- factor(am, labels = c("Automatic", "Manual"))
cyl <- factor(cyl)
gear <- factor(gear)
})
p1 <- ggplot(mtcars2) +
geom_point(aes(x = wt, y = mpg, colour = gear)) +
labs(
title = "Fuel economy declines as weight increases",
subtitle = "(1973-74)",
caption = "Data from the 1974 Motor Trend US magazine.",
tag = "Figure 1",
x = "Weight (1000 lbs)",
y = "Fuel economy (mpg)",
colour = "Gears"
)
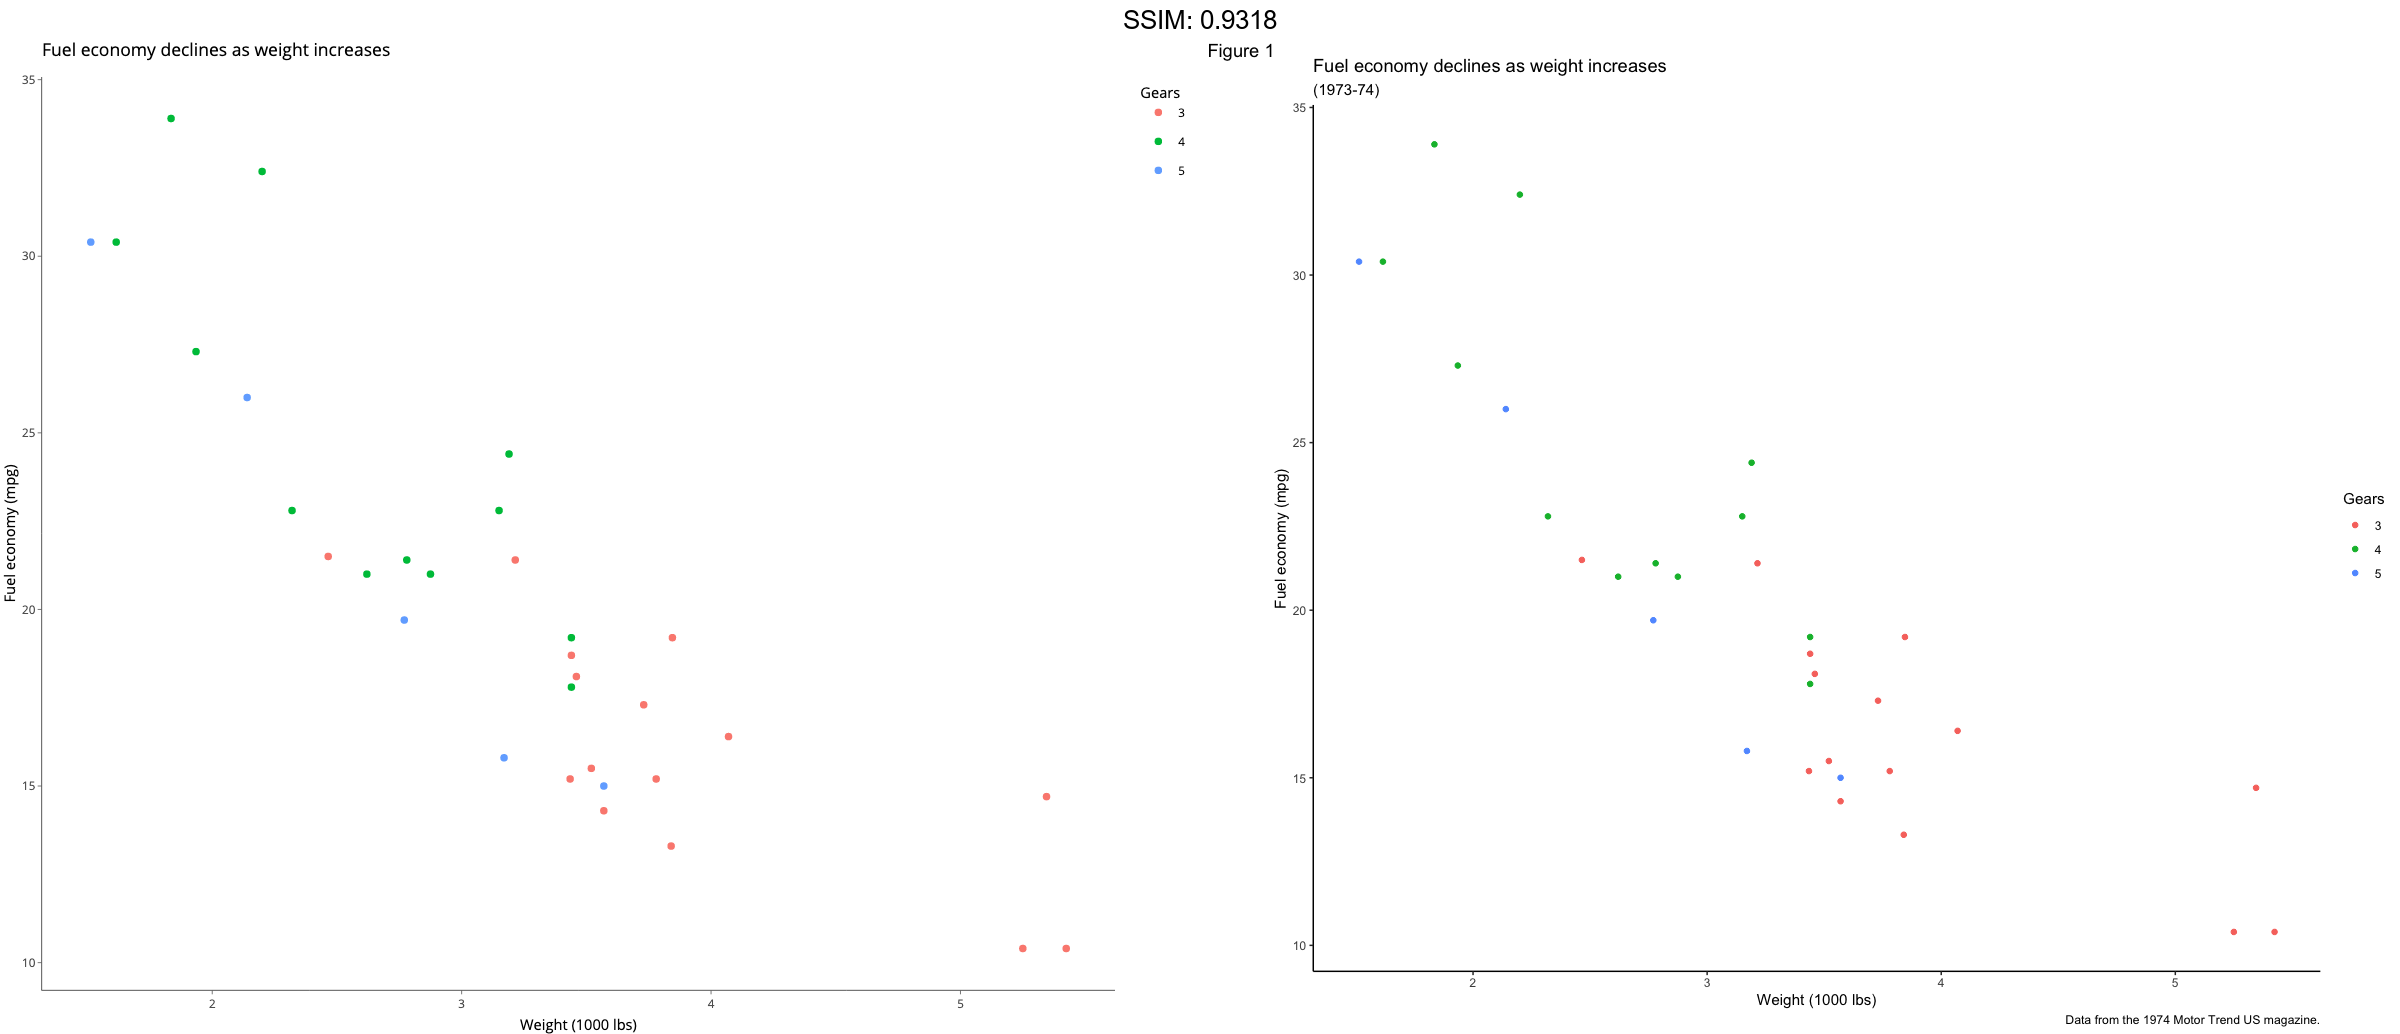
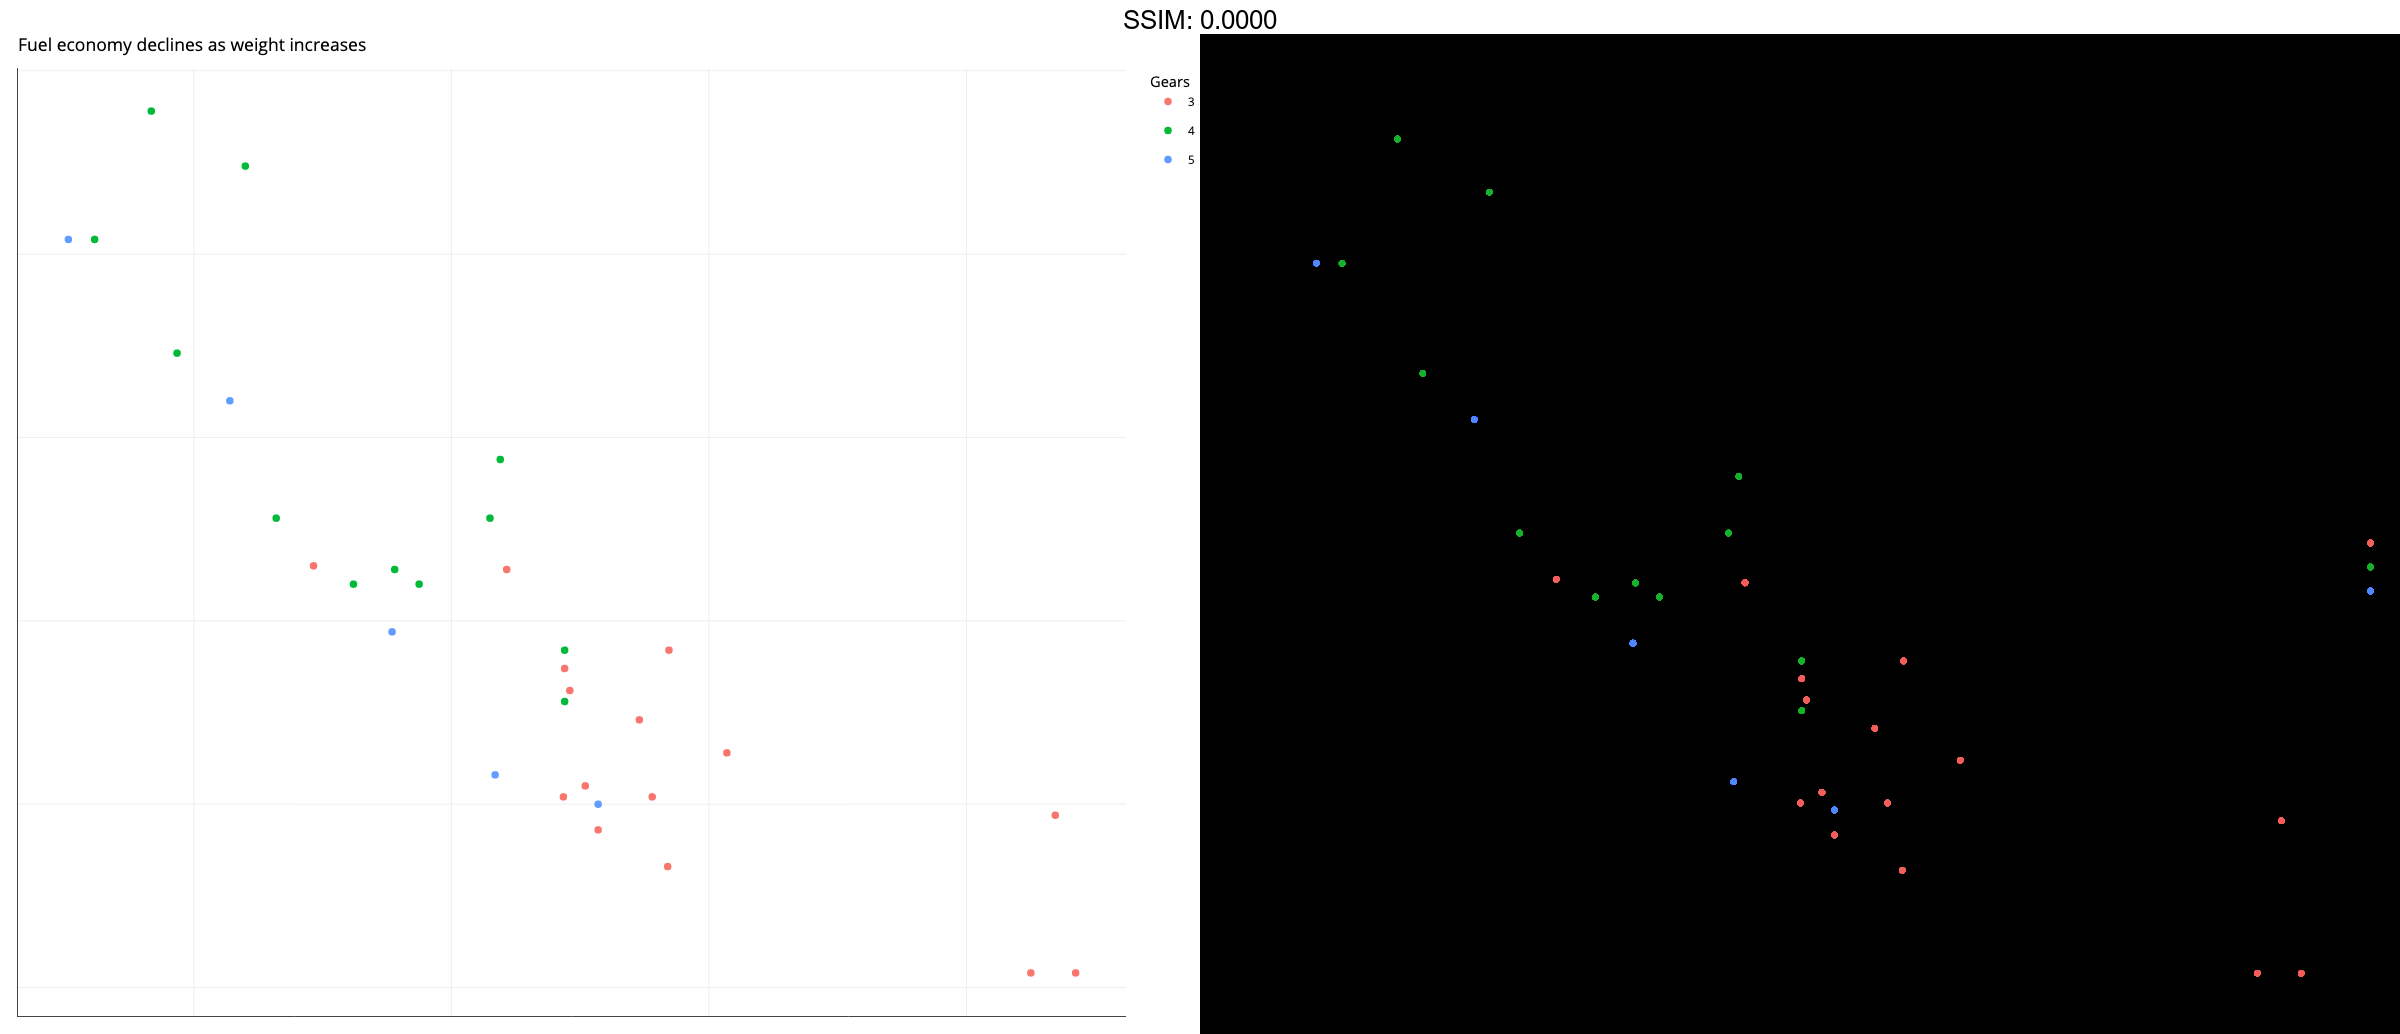
p <- p1 + theme_minimal()
plotly::ggplotly(p)

mtcars2 <- within(mtcars, {
vs <- factor(vs, labels = c("V-shaped", "Straight"))
am <- factor(am, labels = c("Automatic", "Manual"))
cyl <- factor(cyl)
gear <- factor(gear)
})
p1 <- ggplot(mtcars2) +
geom_point(aes(x = wt, y = mpg, colour = gear)) +
labs(
title = "Fuel economy declines as weight increases",
subtitle = "(1973-74)",
caption = "Data from the 1974 Motor Trend US magazine.",
tag = "Figure 1",
x = "Weight (1000 lbs)",
y = "Fuel economy (mpg)",
colour = "Gears"
)
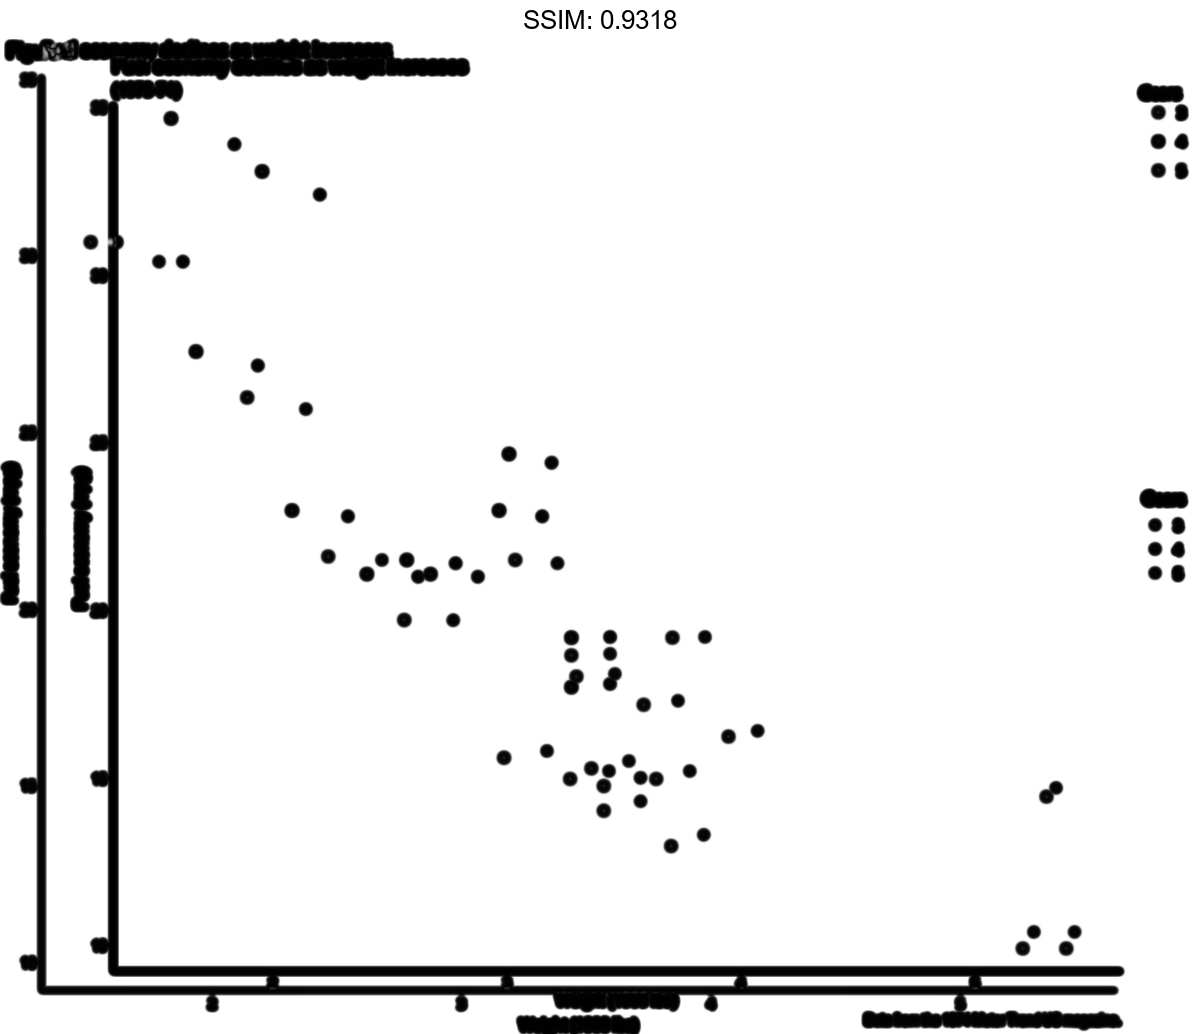
p <- p1 + theme_classic()
plotly::ggplotly(p)
mtcars2 <- within(mtcars, {
  vs <- factor(vs, labels = c("V-shaped", "Straight"))
  am <- factor(am, labels = c("Automatic", "Manual"))
  cyl  <- factor(cyl)
  gear <- factor(gear)
})

p1 <- ggplot(mtcars2) +
  geom_point(aes(x = wt, y = mpg, colour = gear)) +
  labs(
    title = "Fuel economy declines as weight increases",
    subtitle = "(1973-74)",
    caption = "Data from the 1974 Motor Trend US magazine.",
    tag = "Figure 1",
    x = "Weight (1000 lbs)",
    y = "Fuel economy (mpg)",
    colour = "Gears"
  )
p <-  p1 + theme_void()
plotly::ggplotly(p)
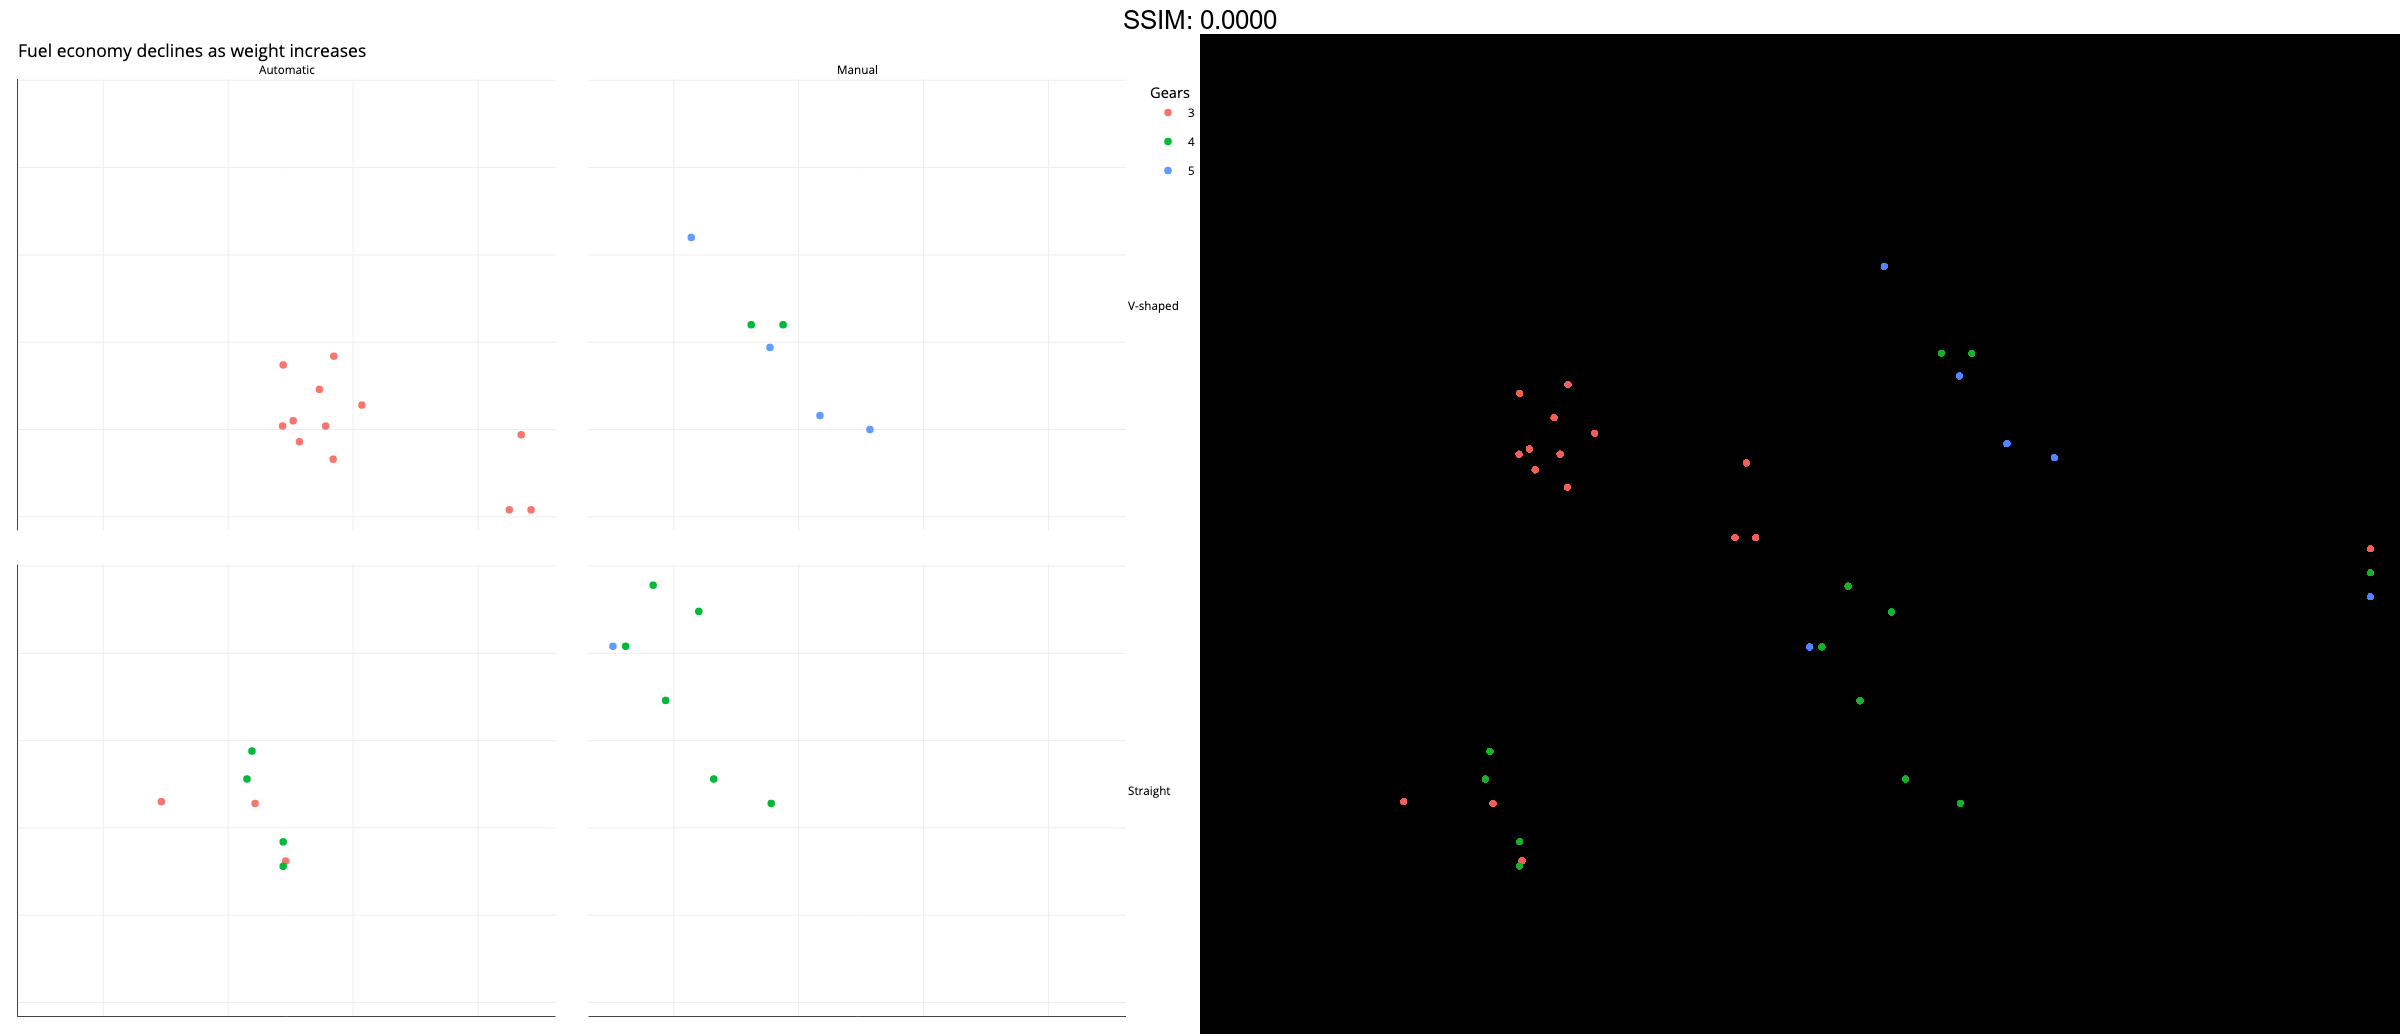
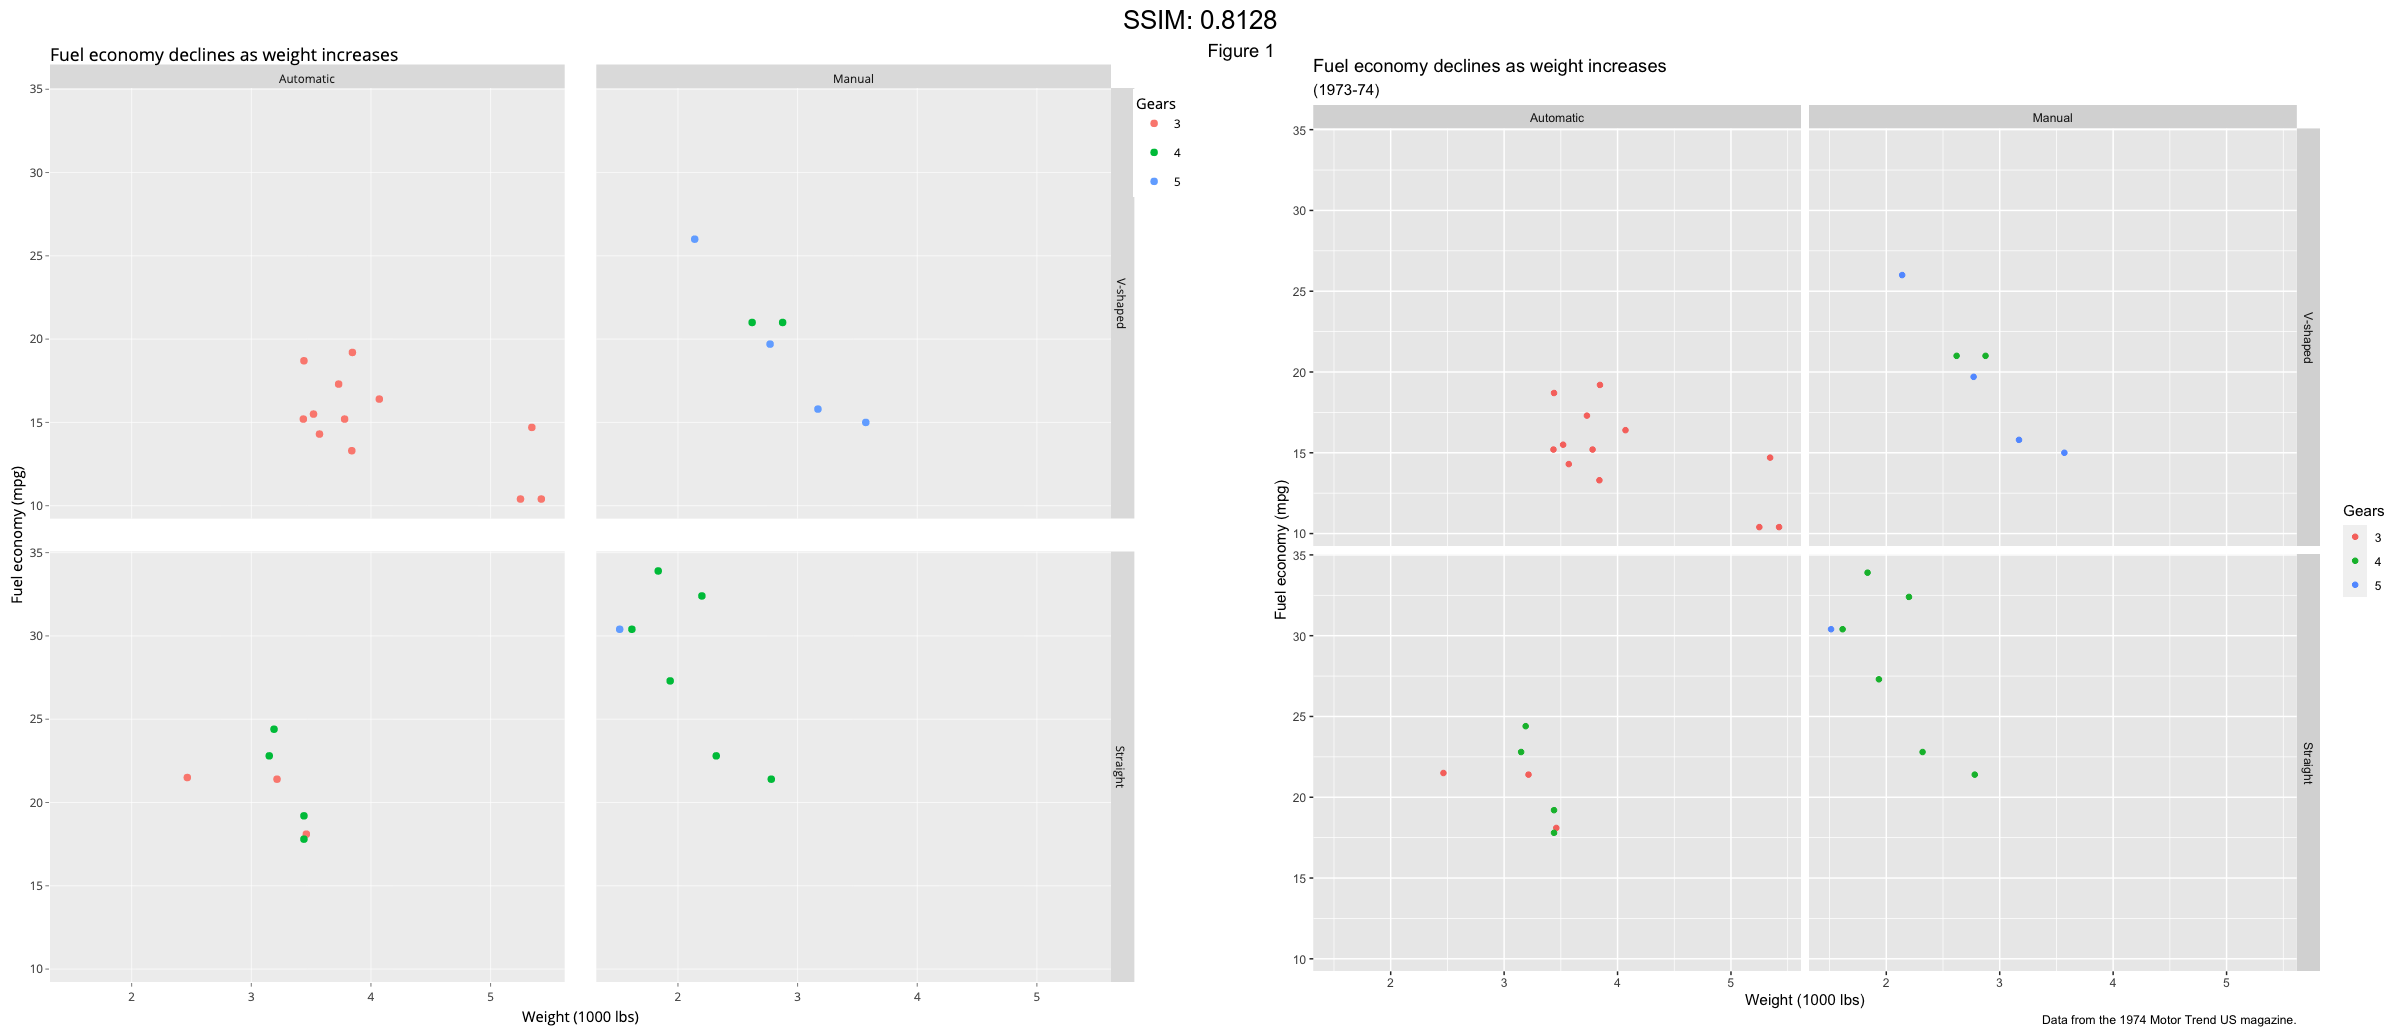
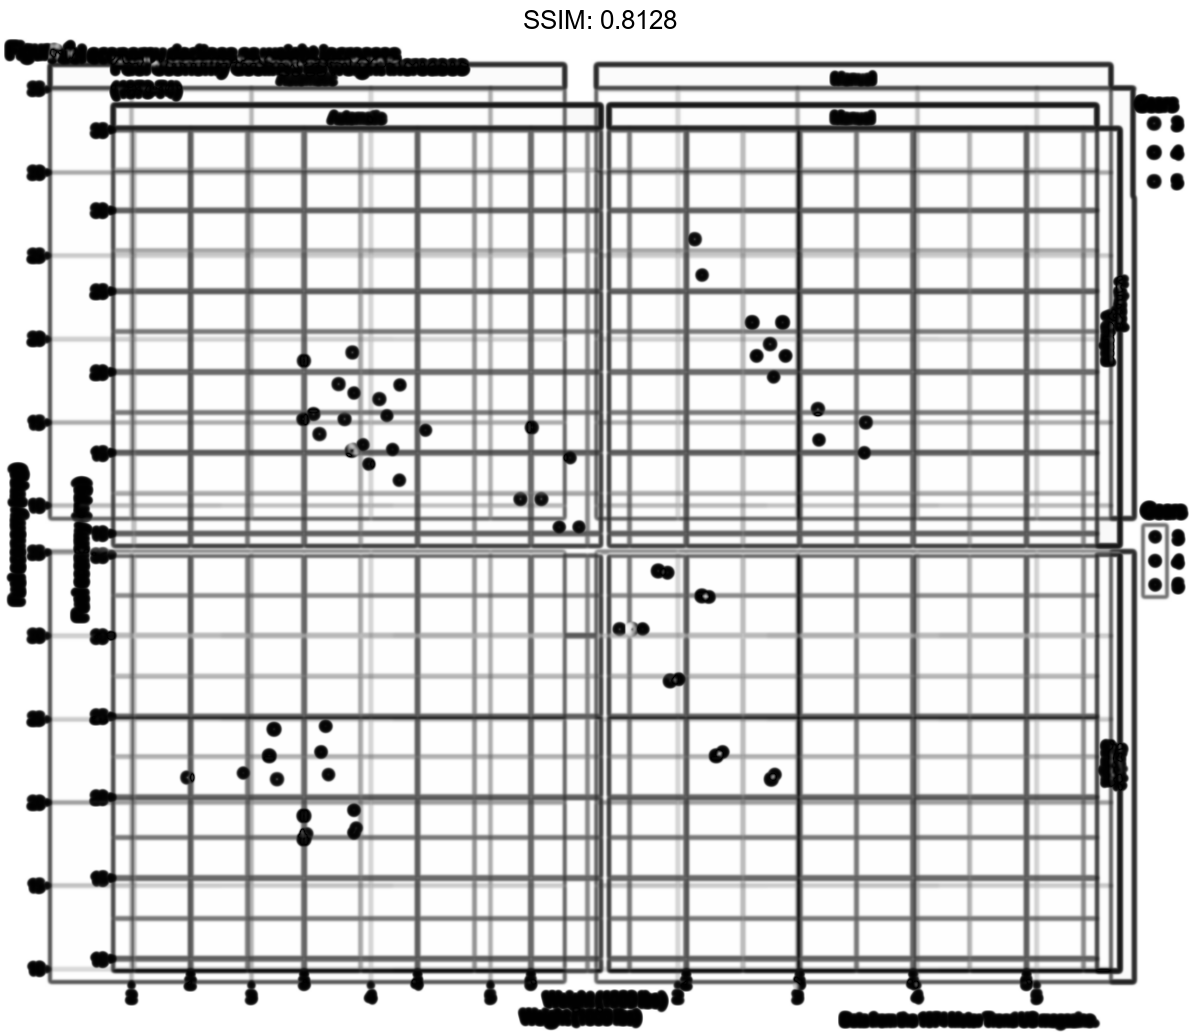
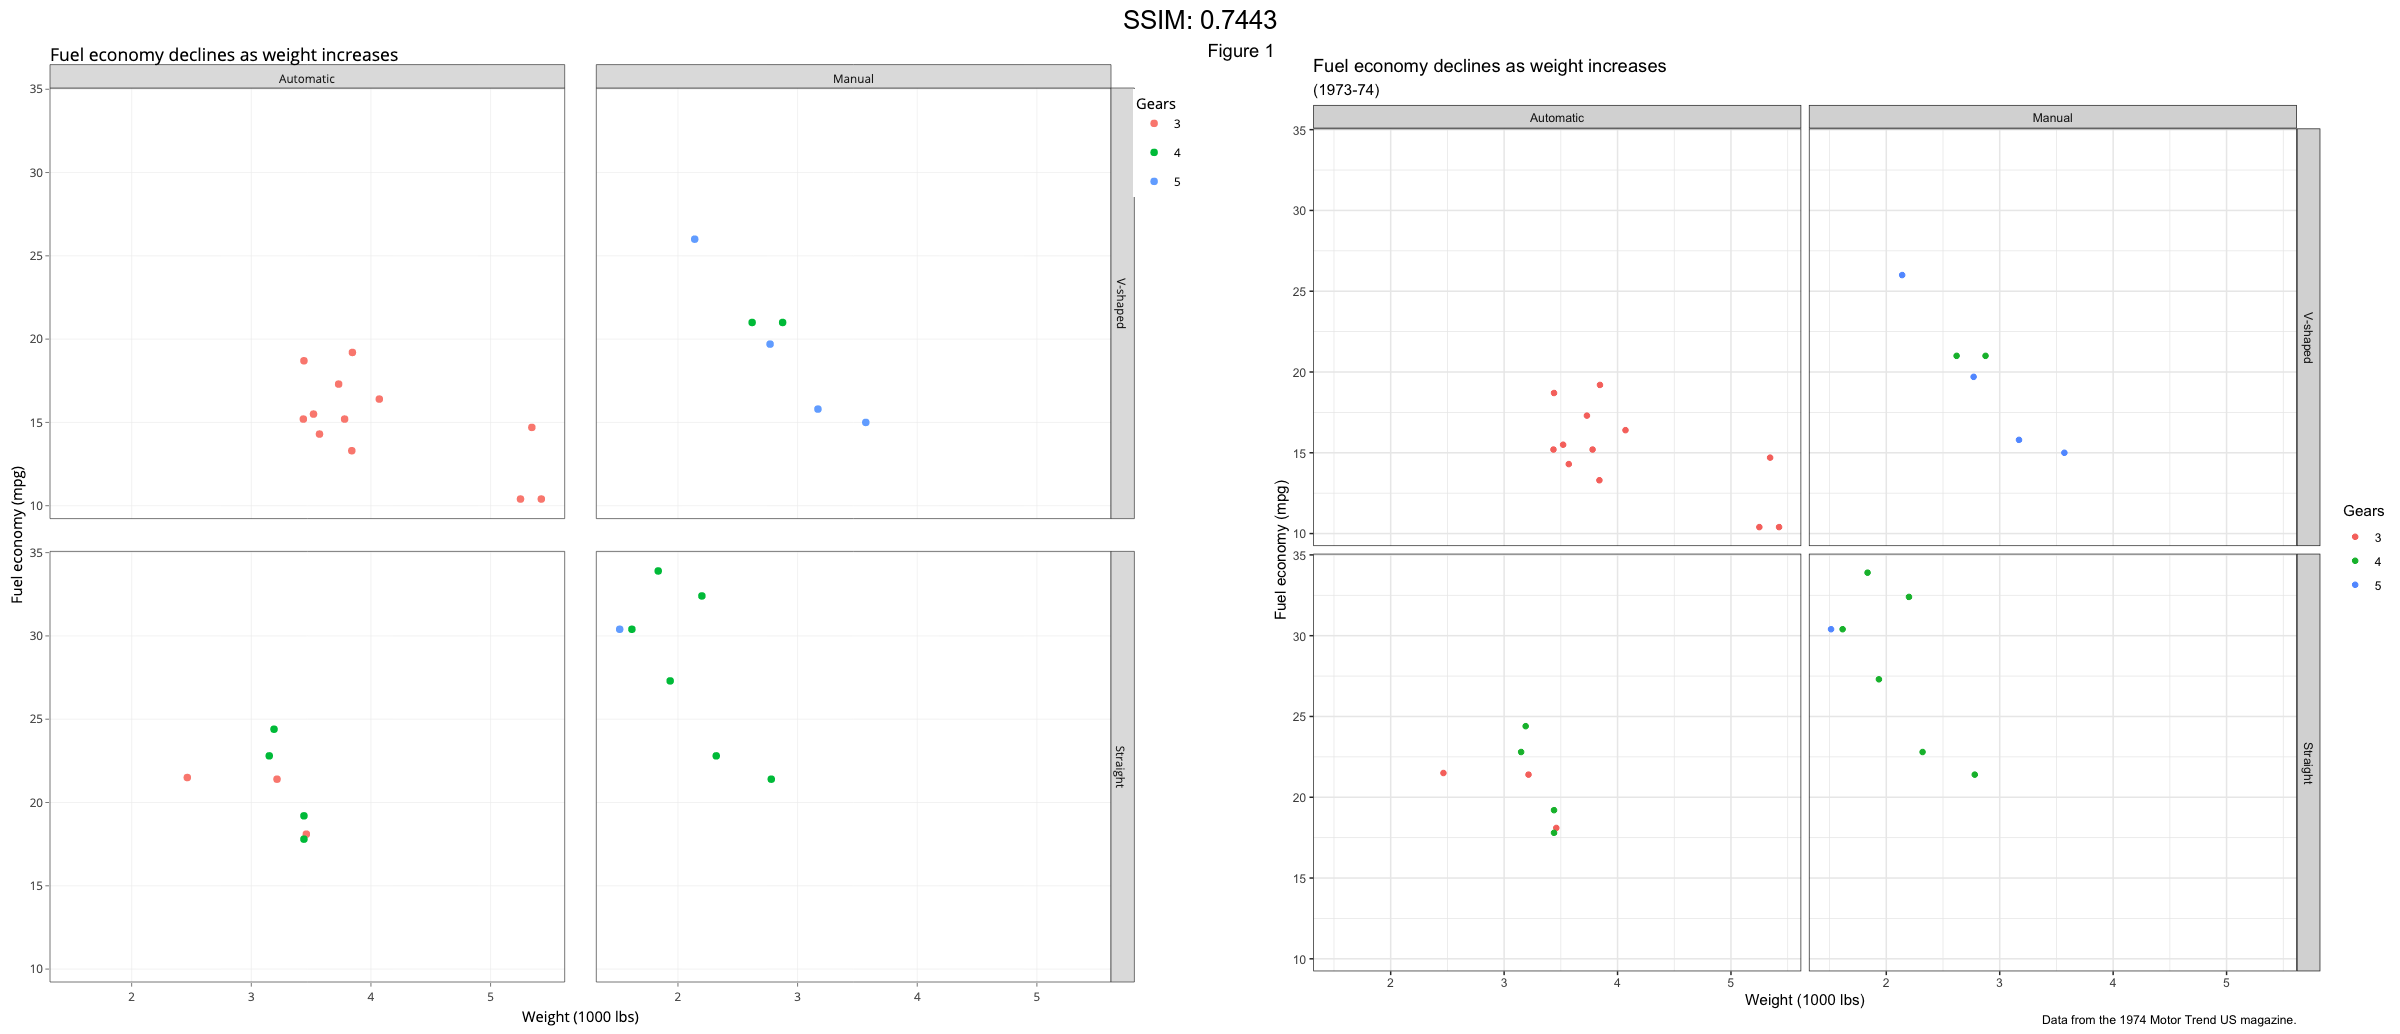
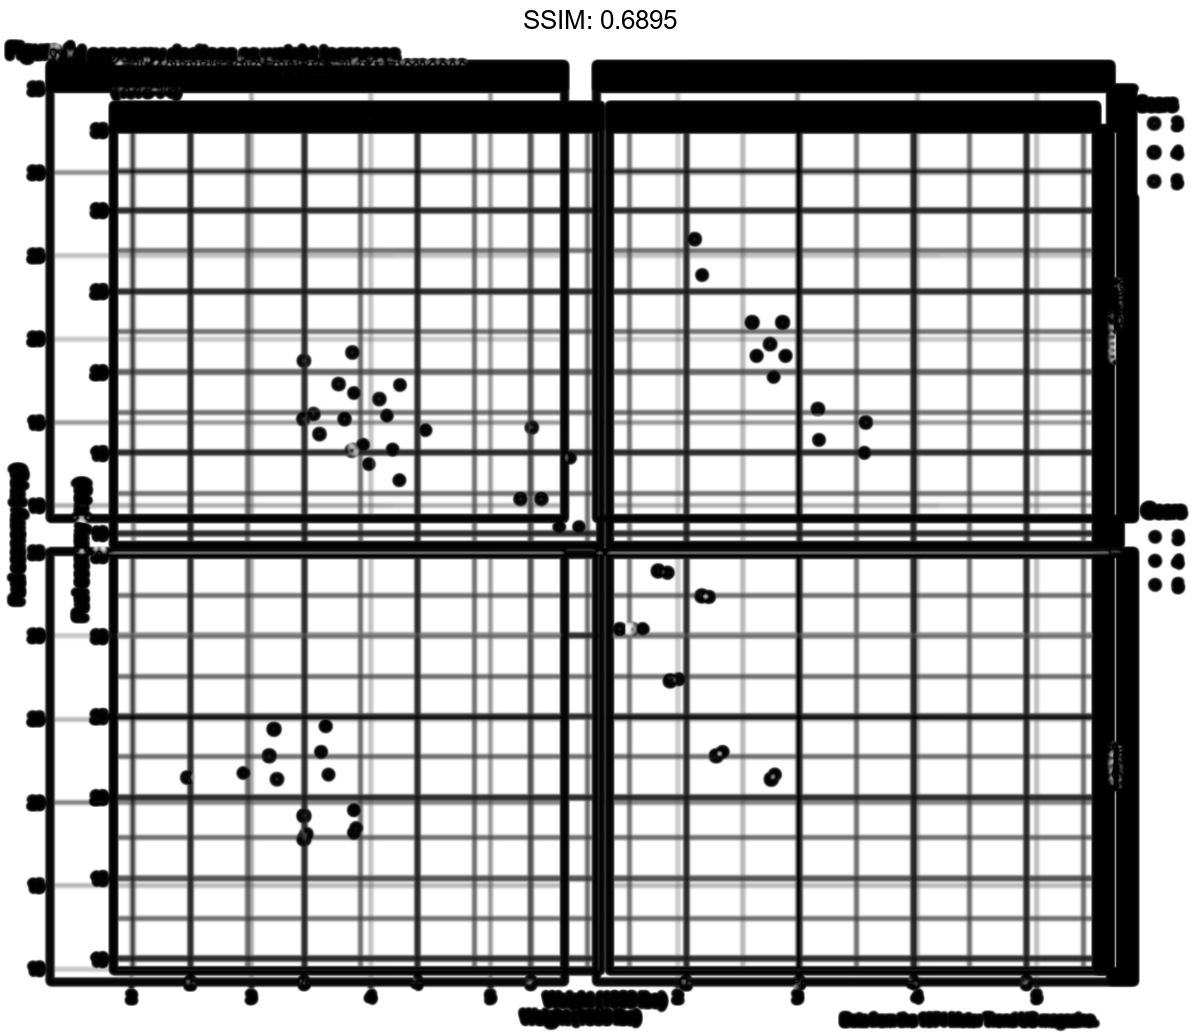
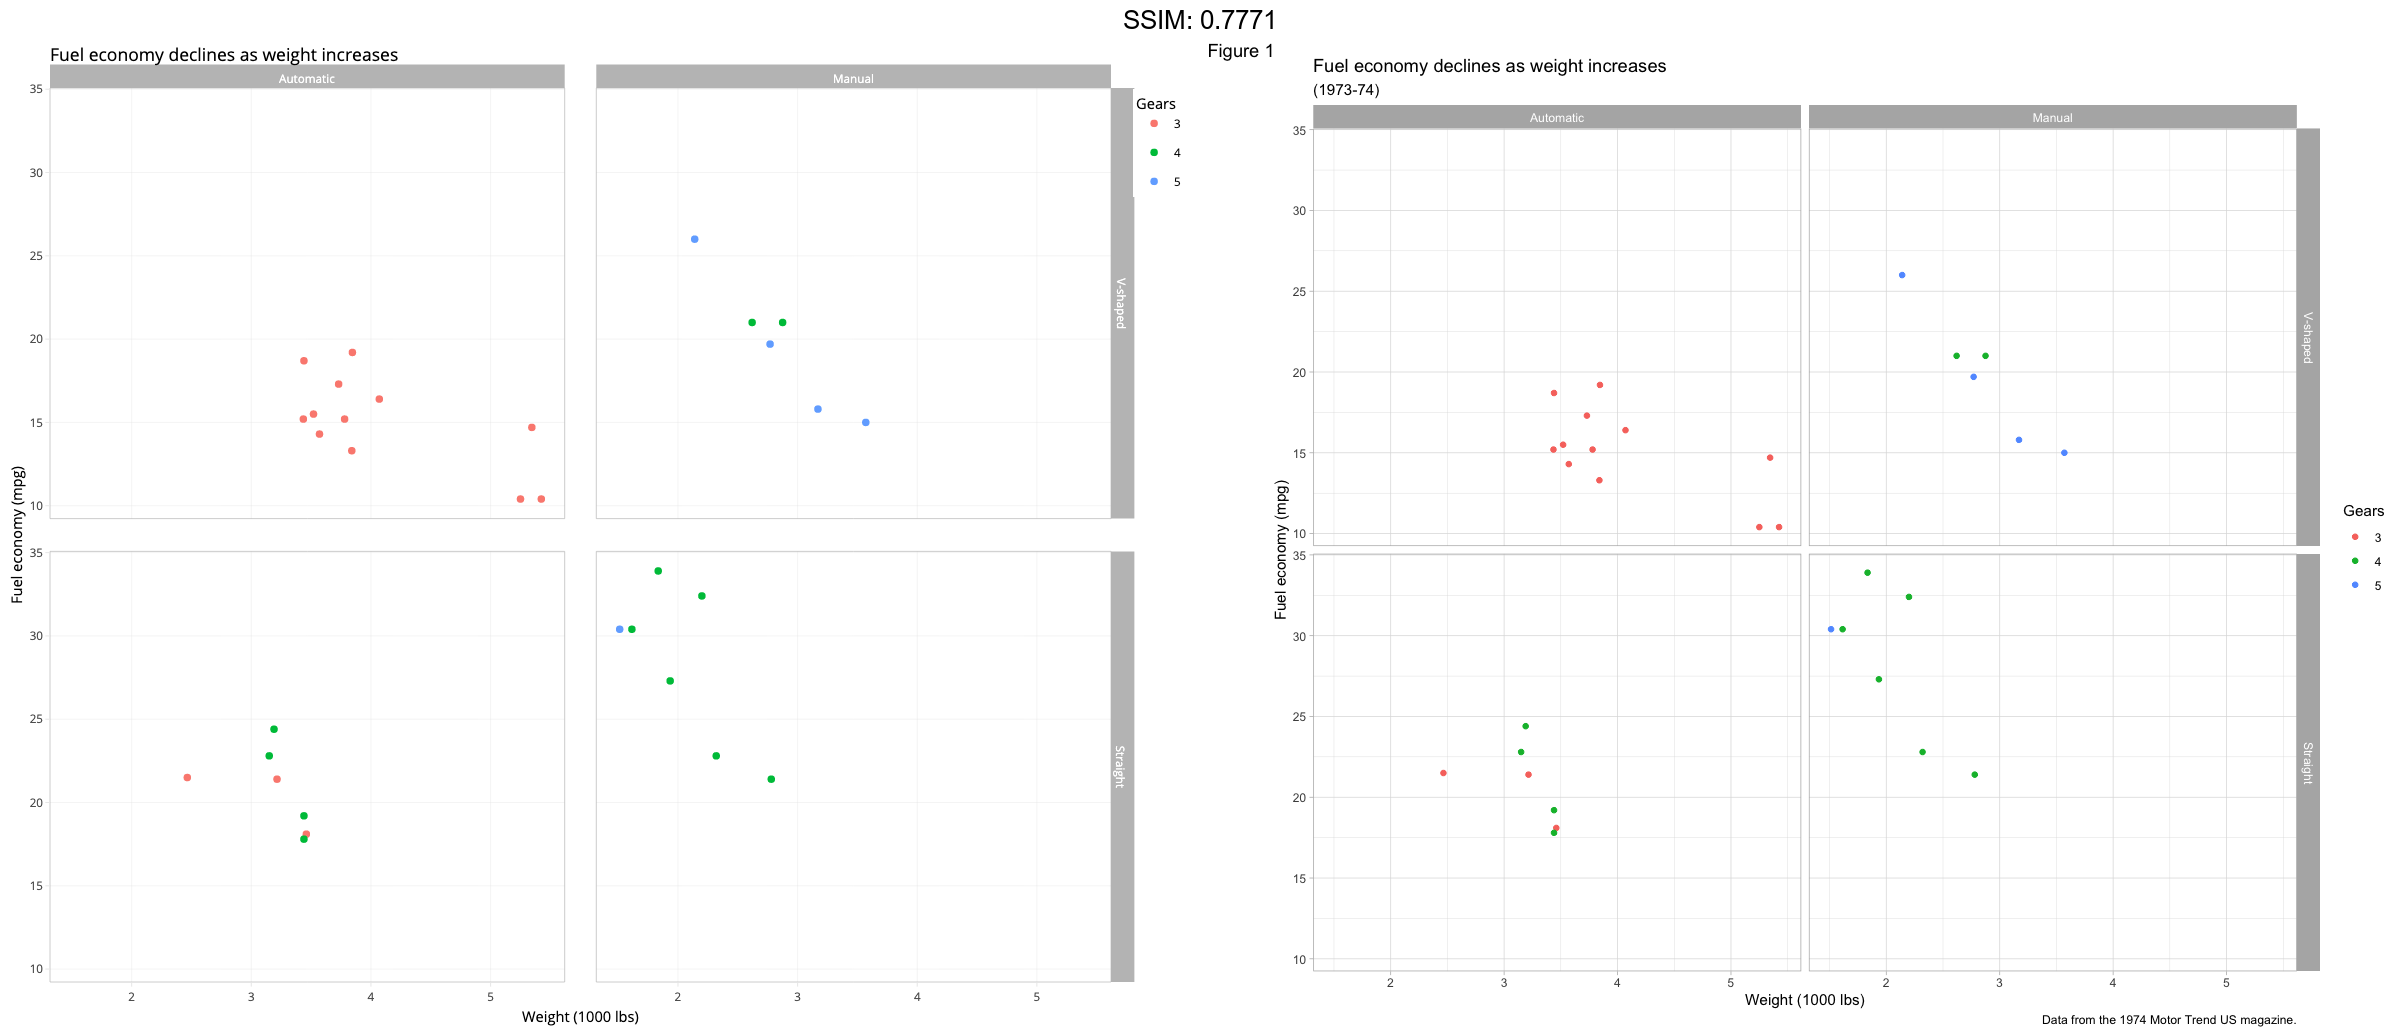
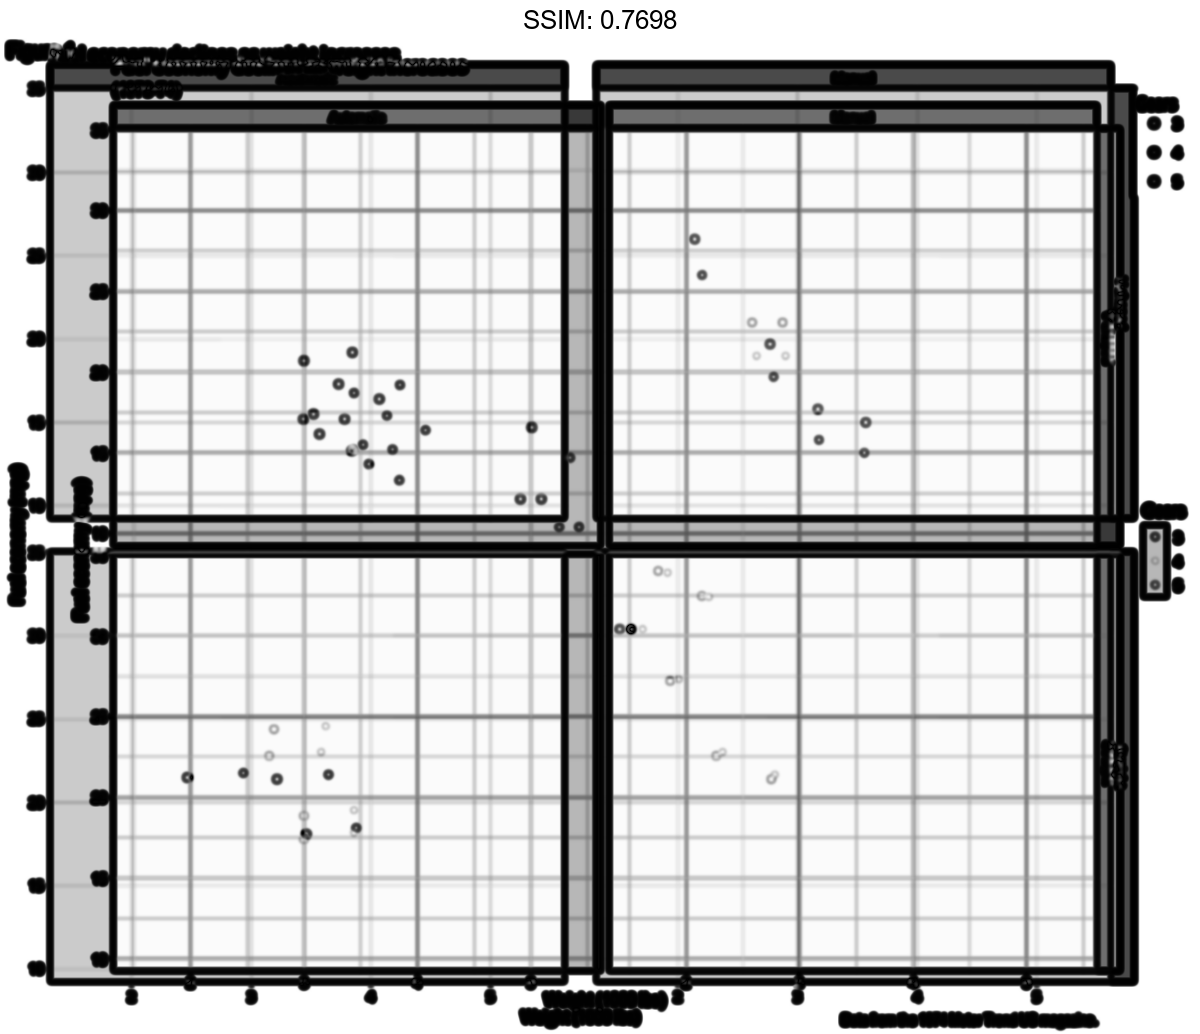
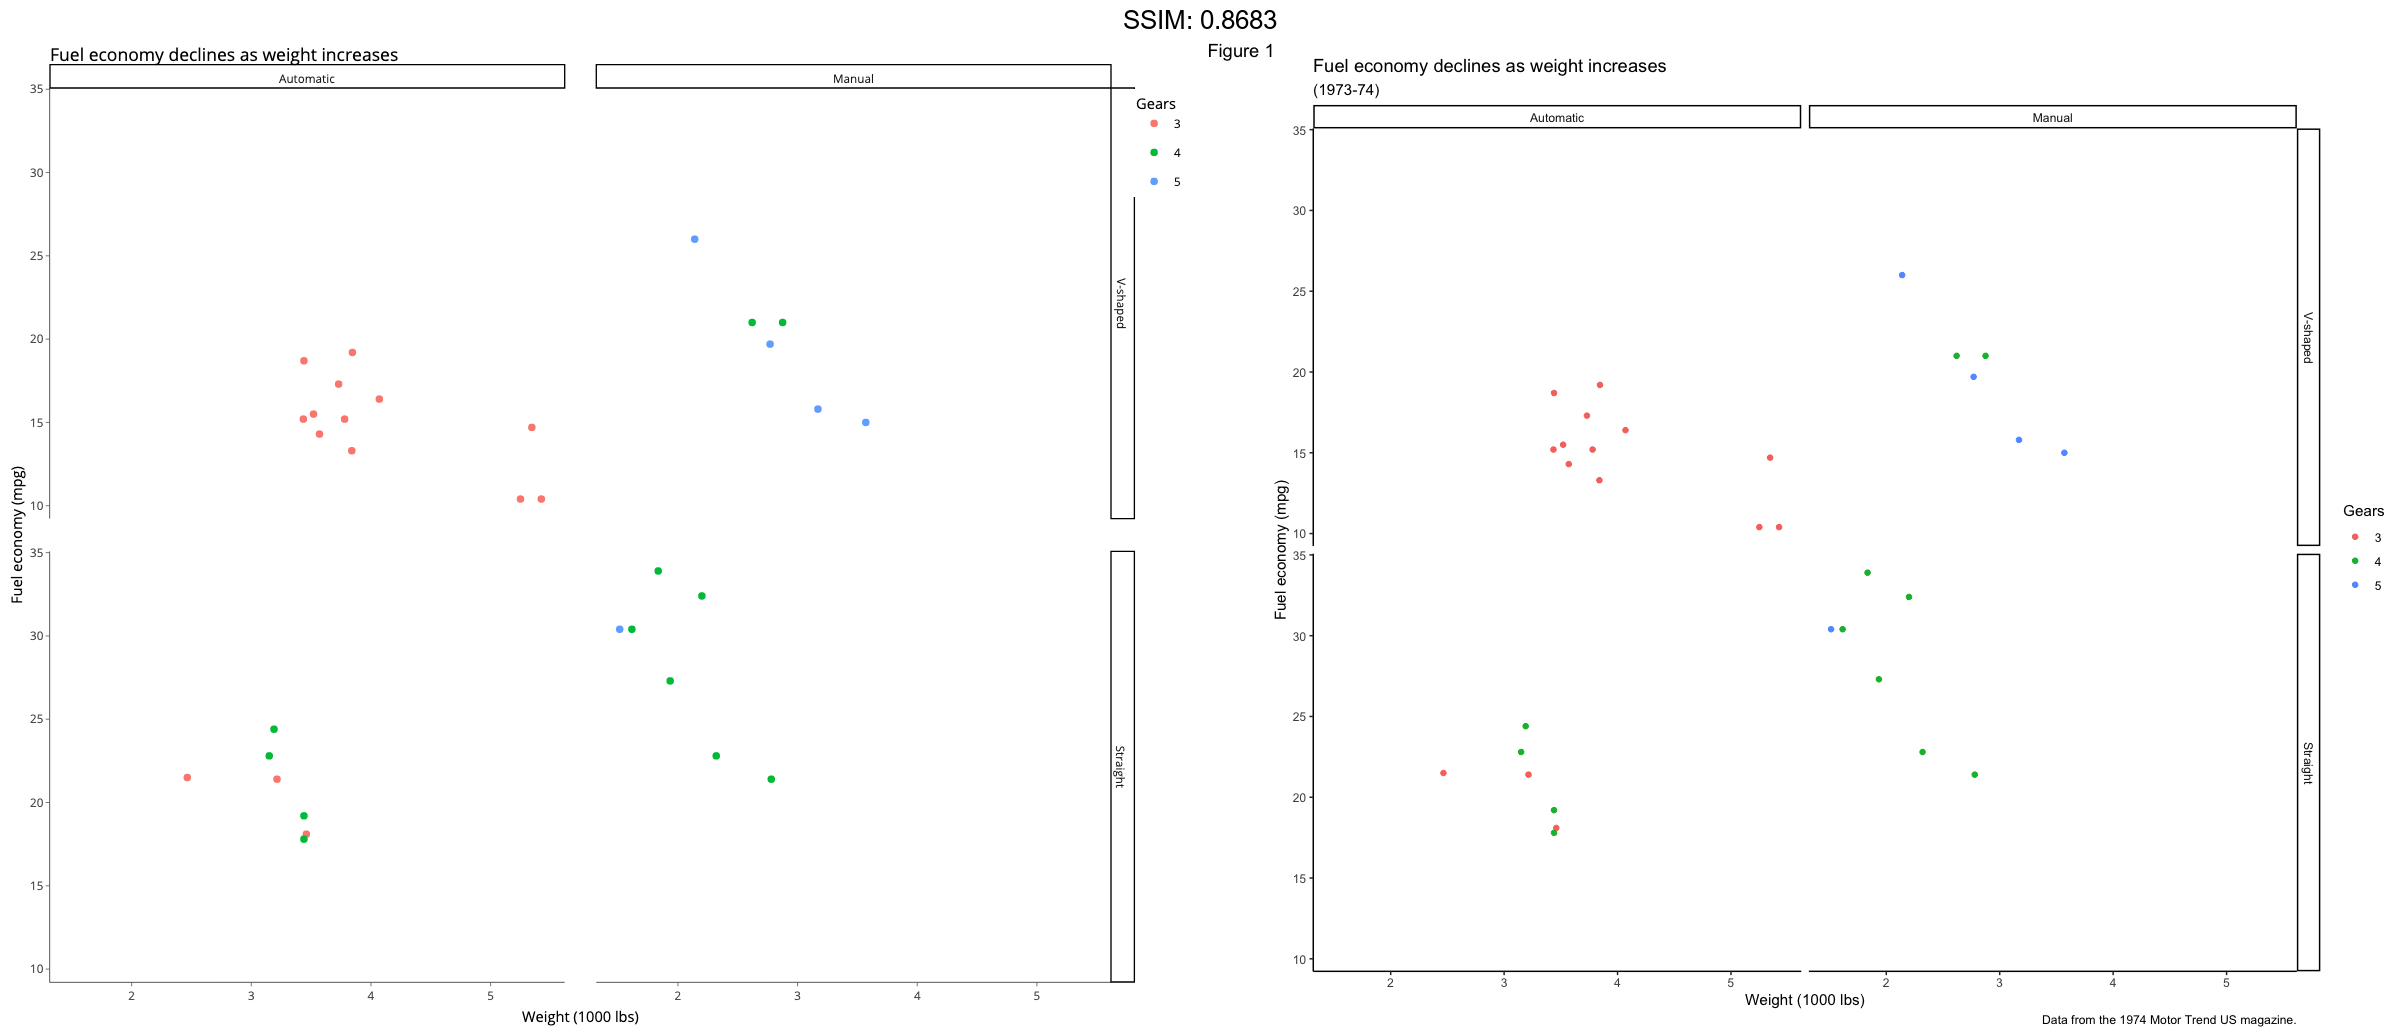
p2 <- p1 + facet_grid(vs ~ am)
p <-  p2 + theme_gray() # the default
plotly::ggplotly(p)
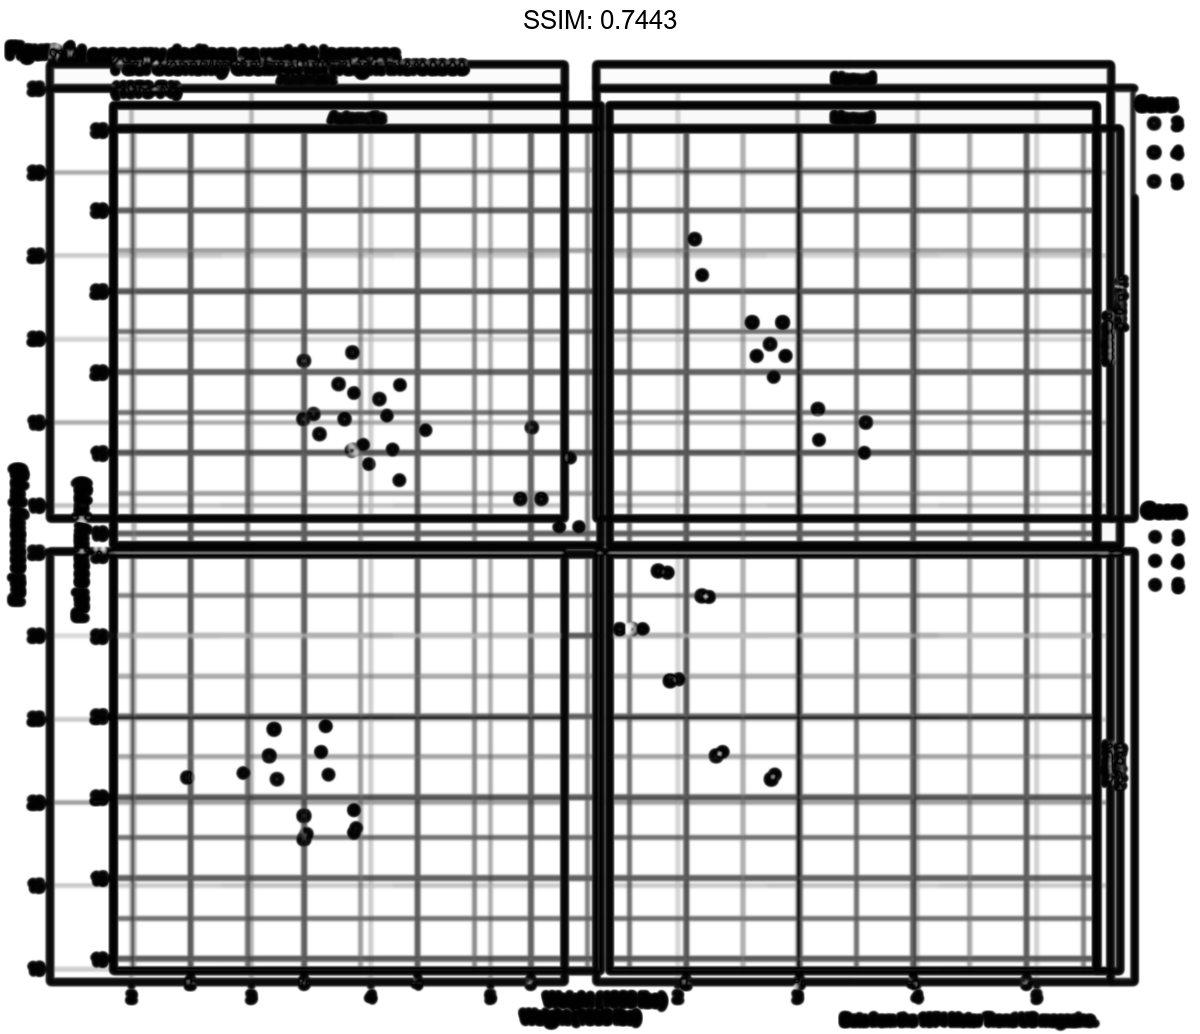
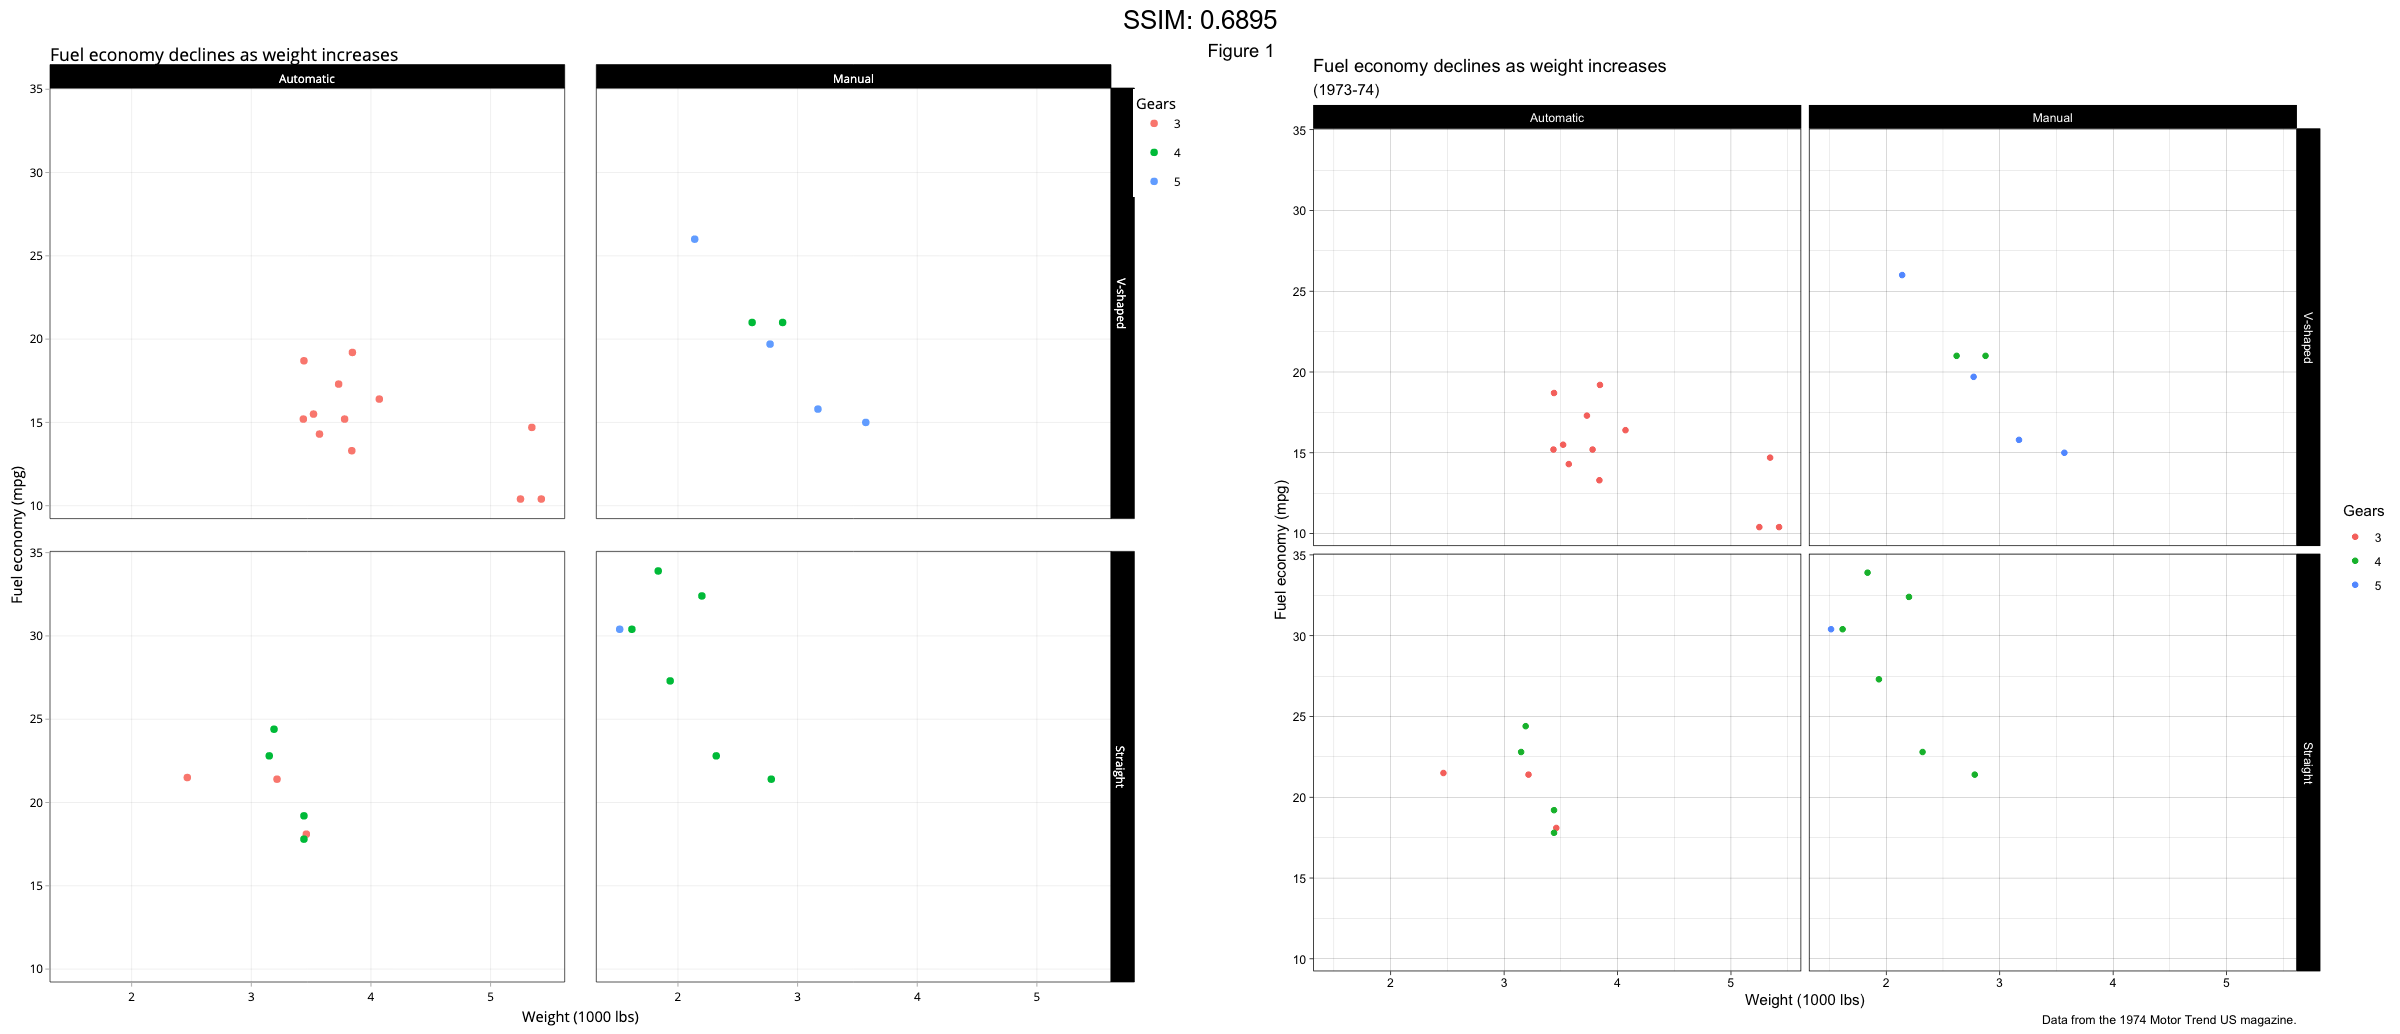
p2 <- p1 + facet_grid(vs ~ am)
p <-  p2 + theme_bw()
plotly::ggplotly(p)
p2 <- p1 + facet_grid(vs ~ am)
p <-  p2 + theme_linedraw()
plotly::ggplotly(p)
p2 <- p1 + facet_grid(vs ~ am)
p <-  p2 + theme_light()
plotly::ggplotly(p)
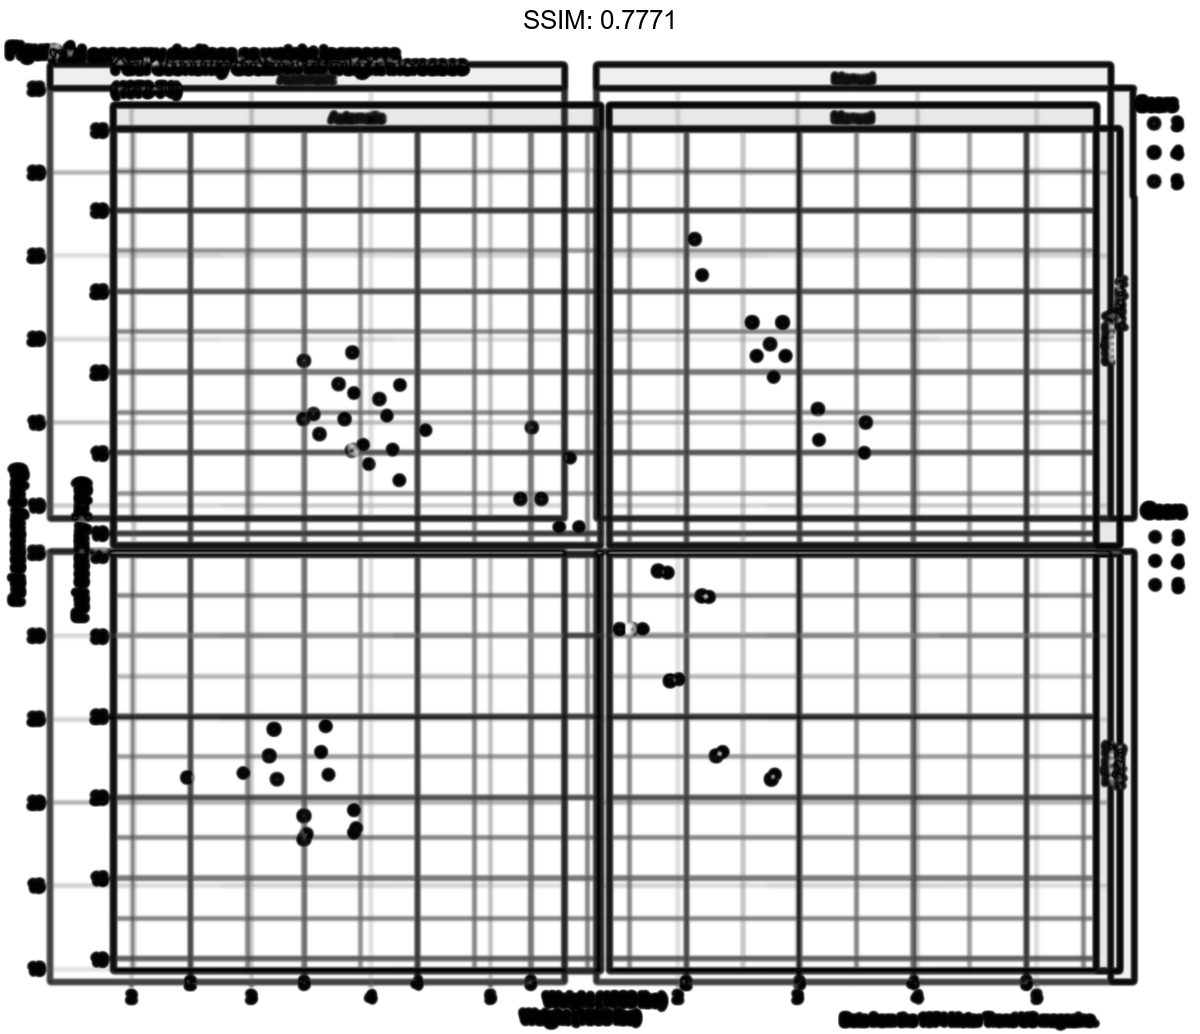
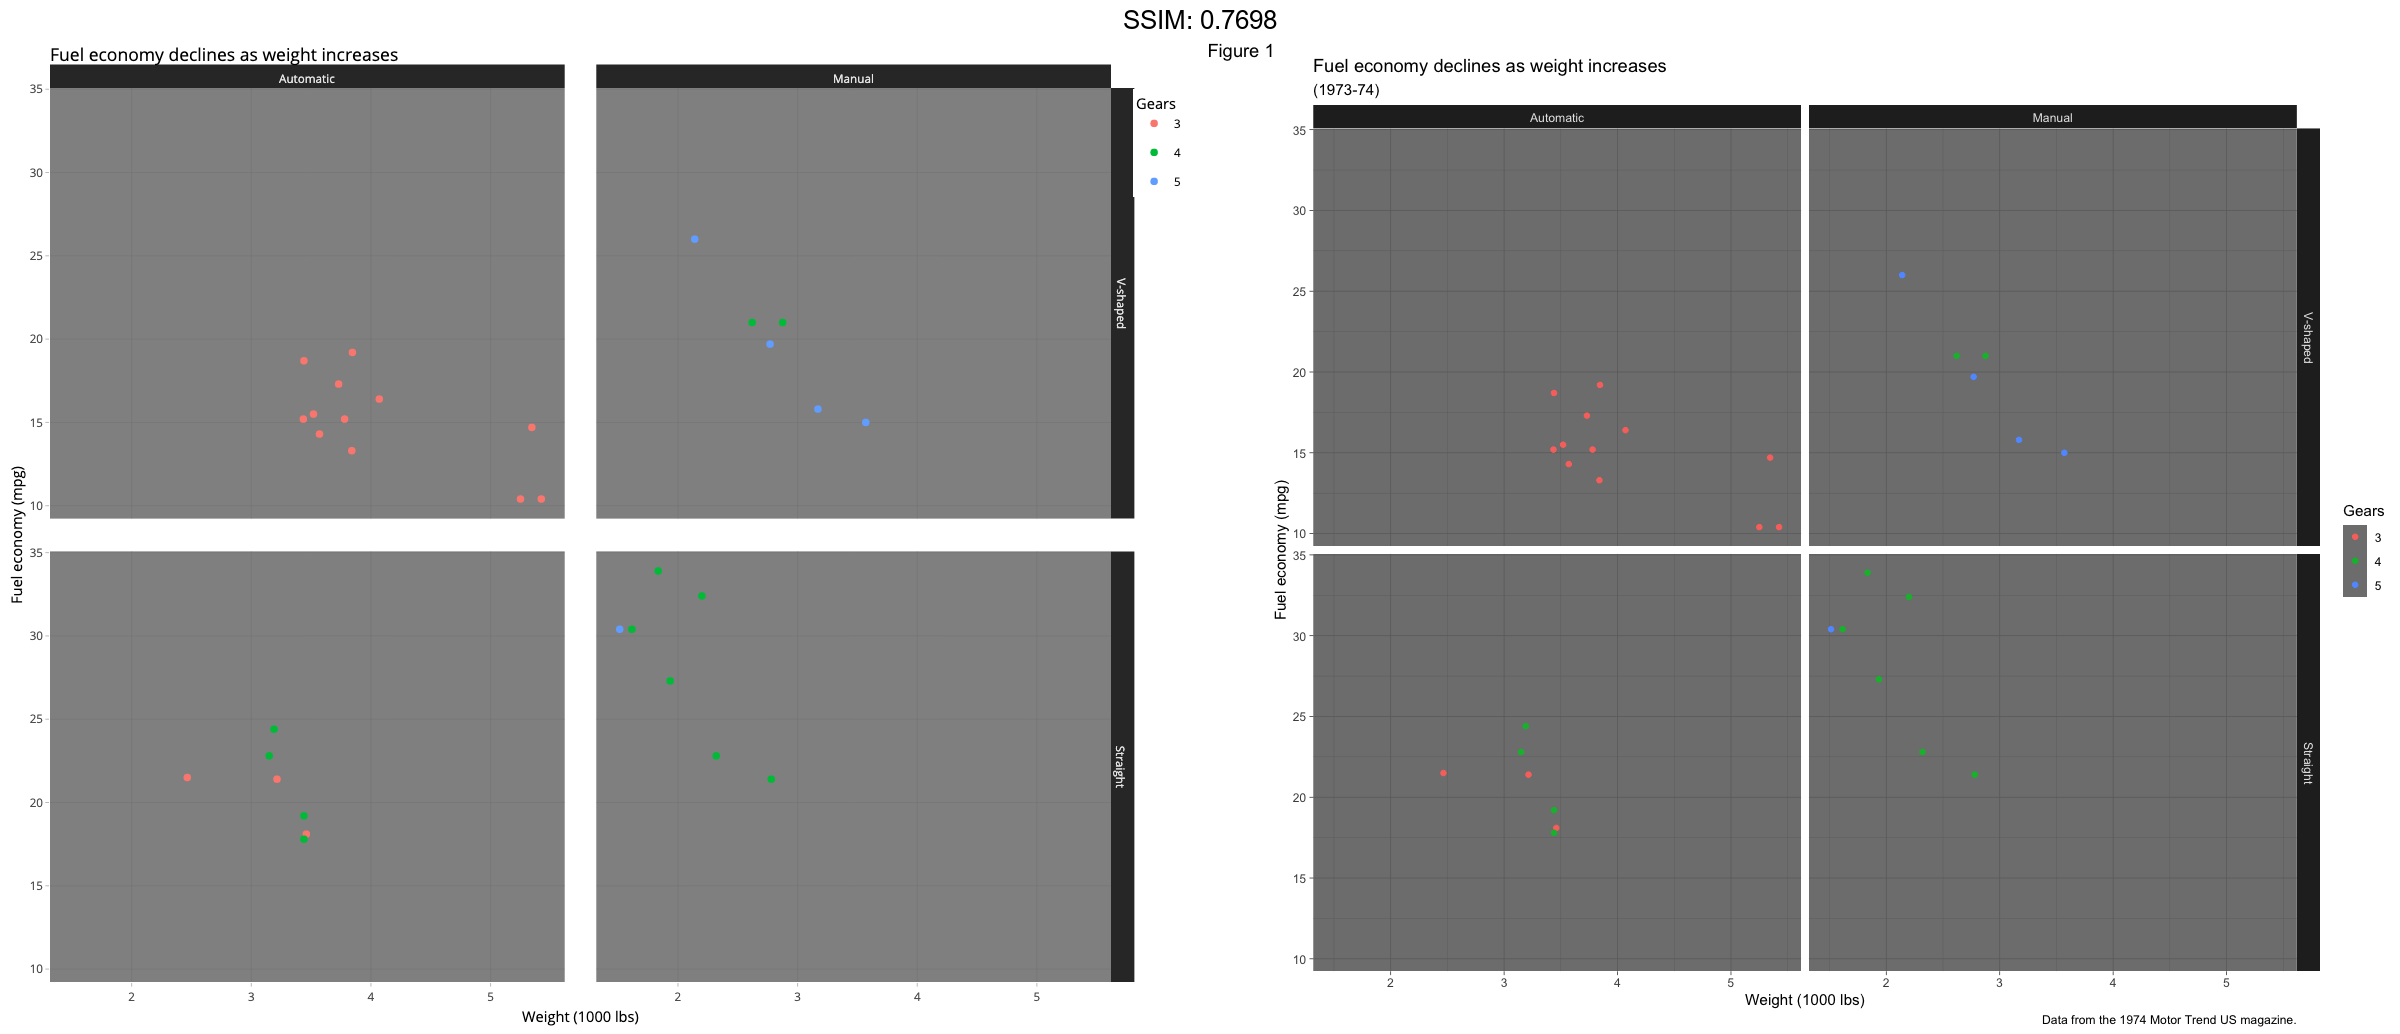
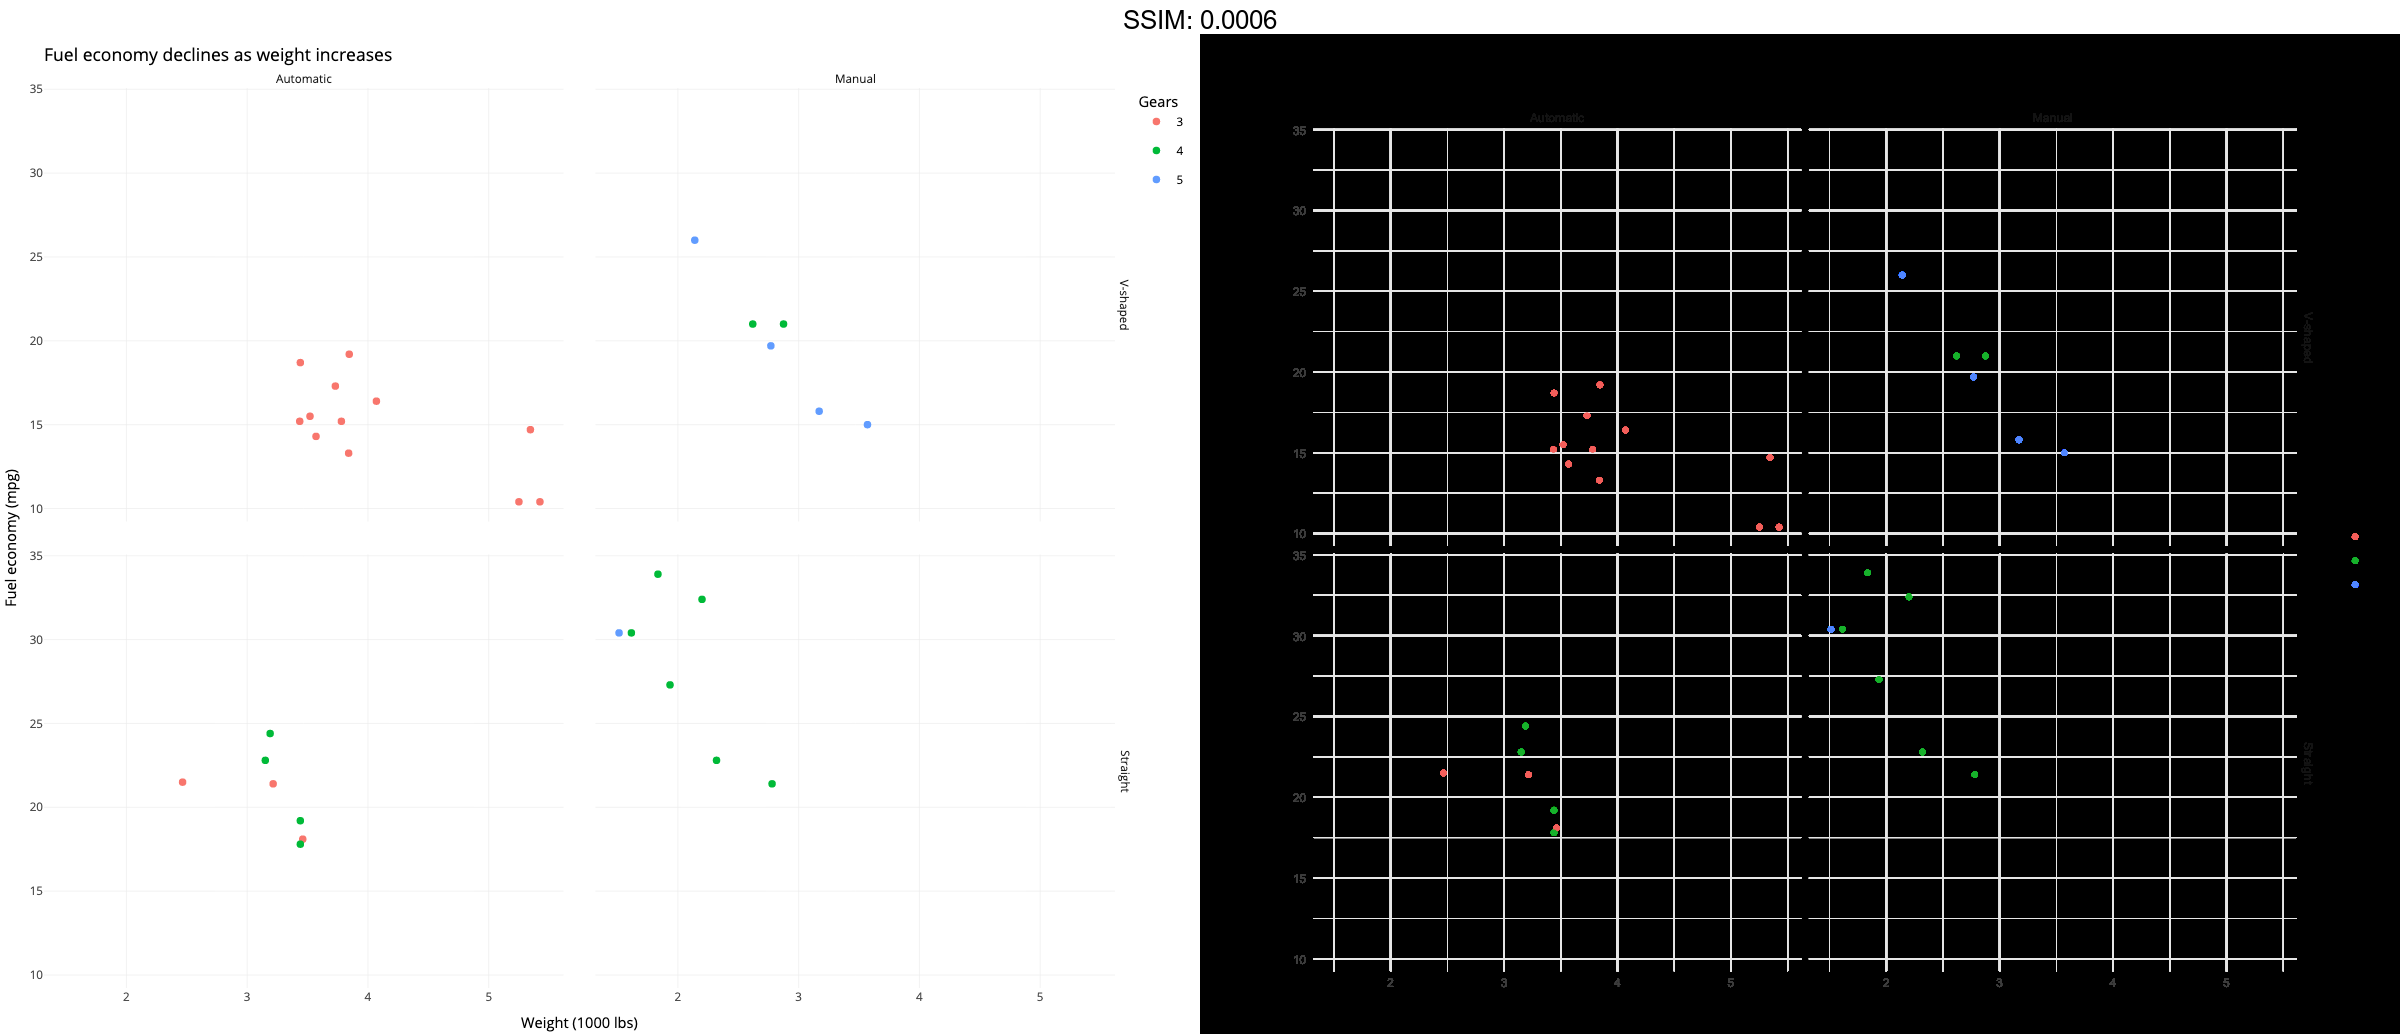
p2 <- p1 + facet_grid(vs ~ am)
p <-  p2 + theme_dark()
plotly::ggplotly(p)
p2 <- p1 + facet_grid(vs ~ am)
p <-  p2 + theme_minimal()
plotly::ggplotly(p)
p2 <- p1 + facet_grid(vs ~ am)
p <-  p2 + theme_classic()
plotly::ggplotly(p)
p2 <- p1 + facet_grid(vs ~ am)
p <-  p2 + theme_void()
plotly::ggplotly(p)