Themes in ggplot2
New to Plotly?
Plotly is a free and open-source graphing library for R. We recommend you read our Getting Started guide for the latest installation or upgrade instructions, then move on to our Plotly Fundamentals tutorials or dive straight in to some Basic Charts tutorials.
Give plots a consistent customized look and then convert them with ggplotly.
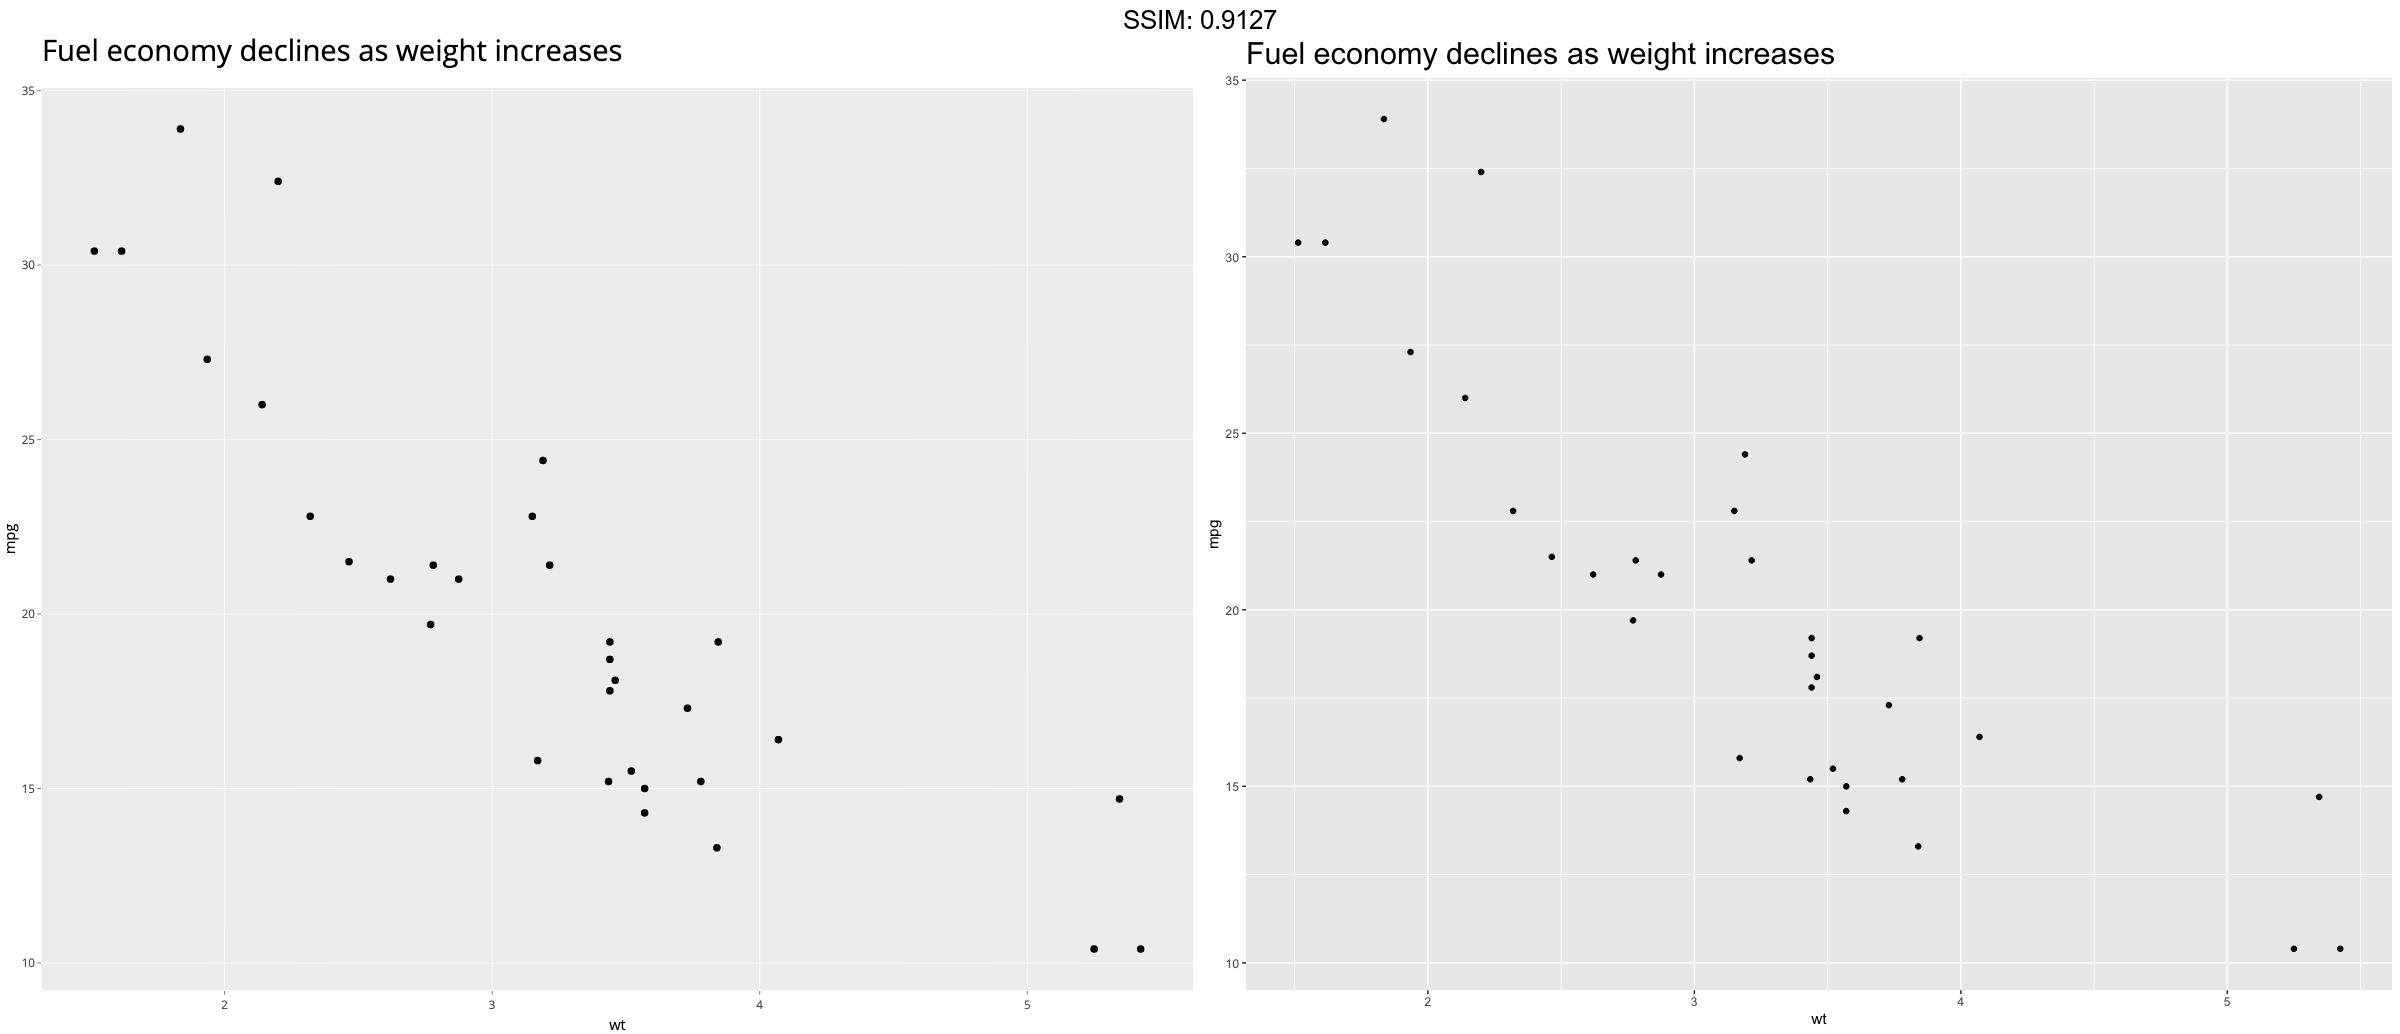
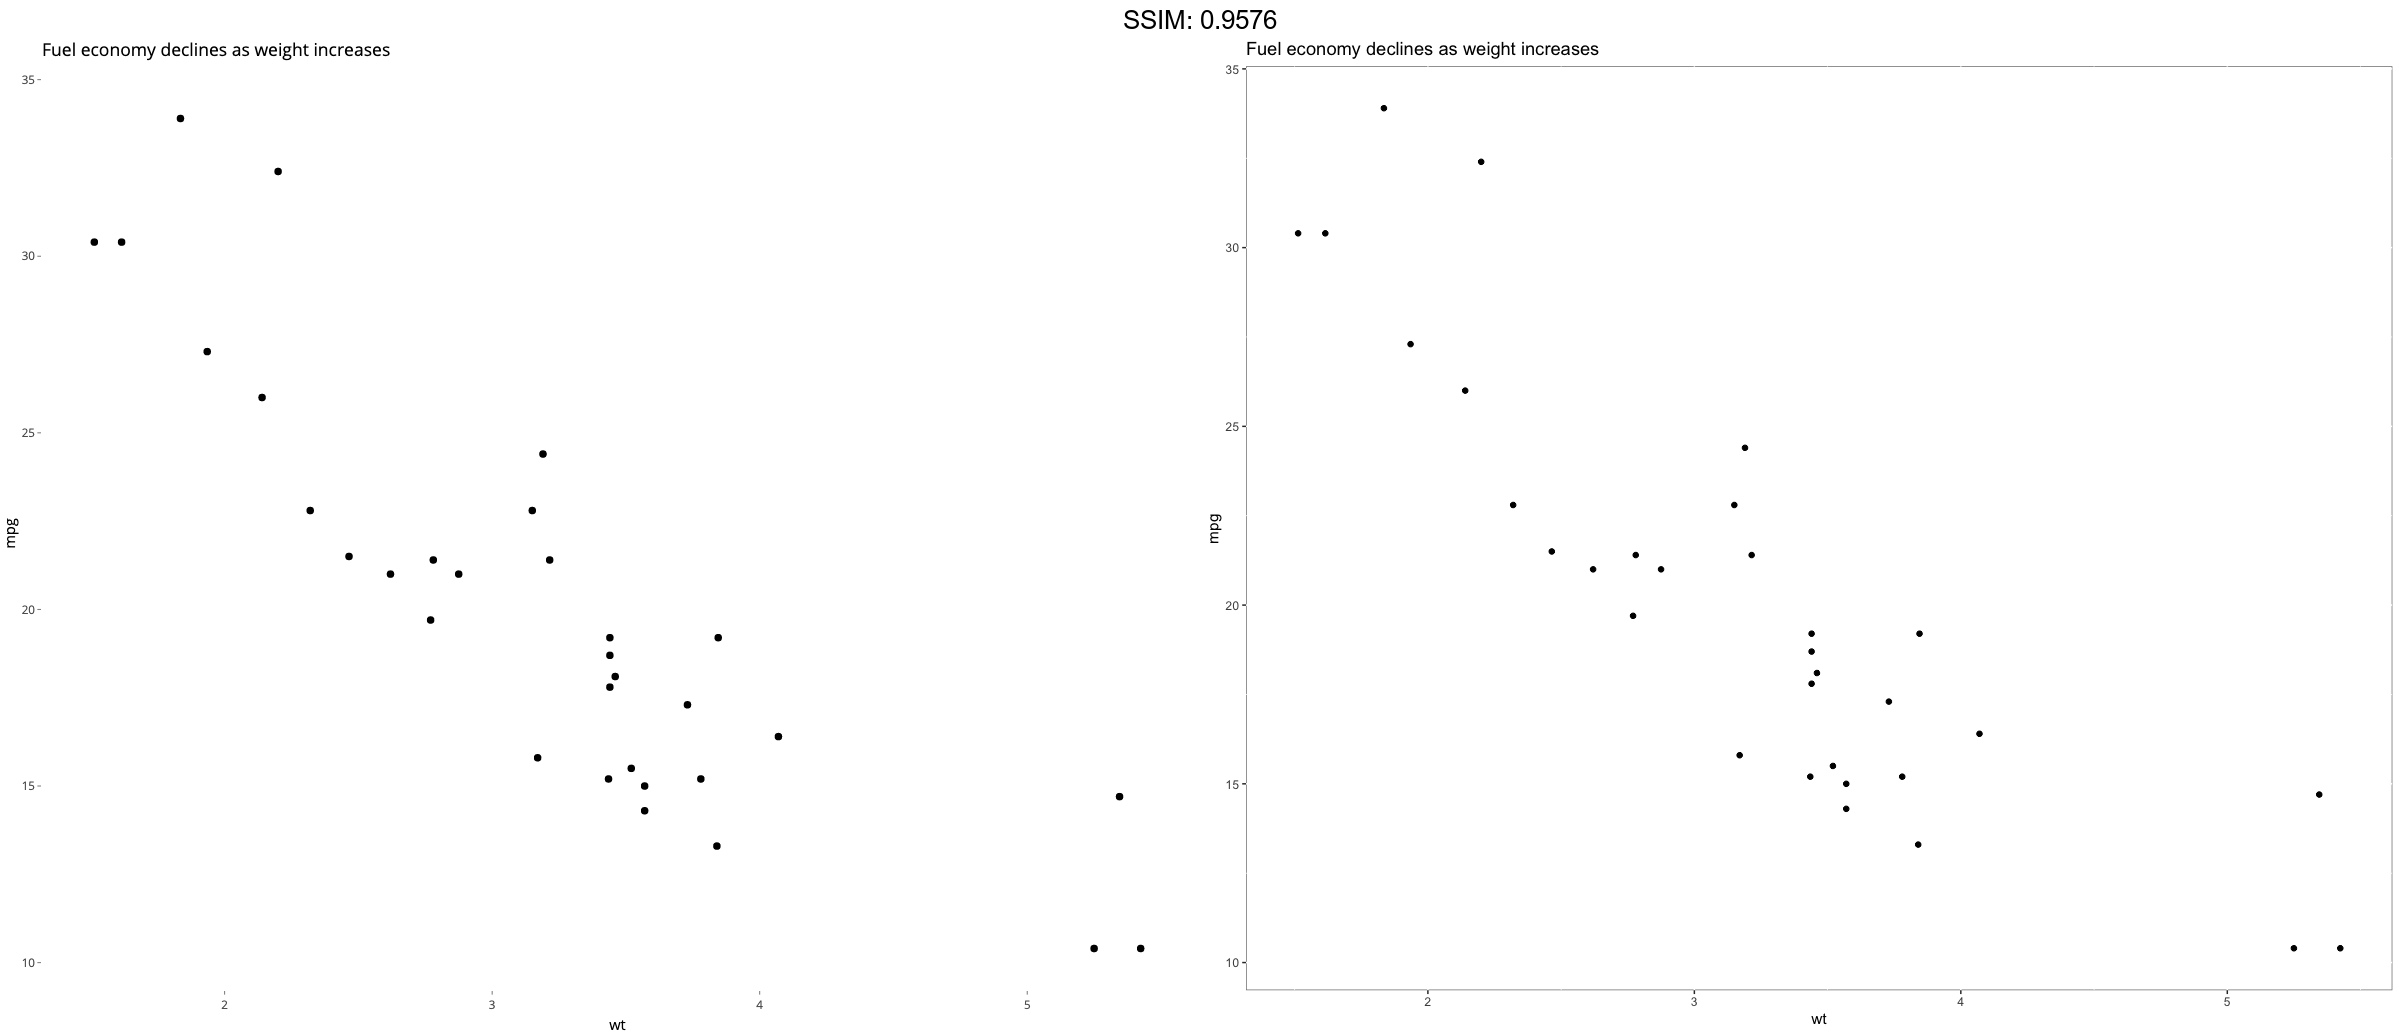
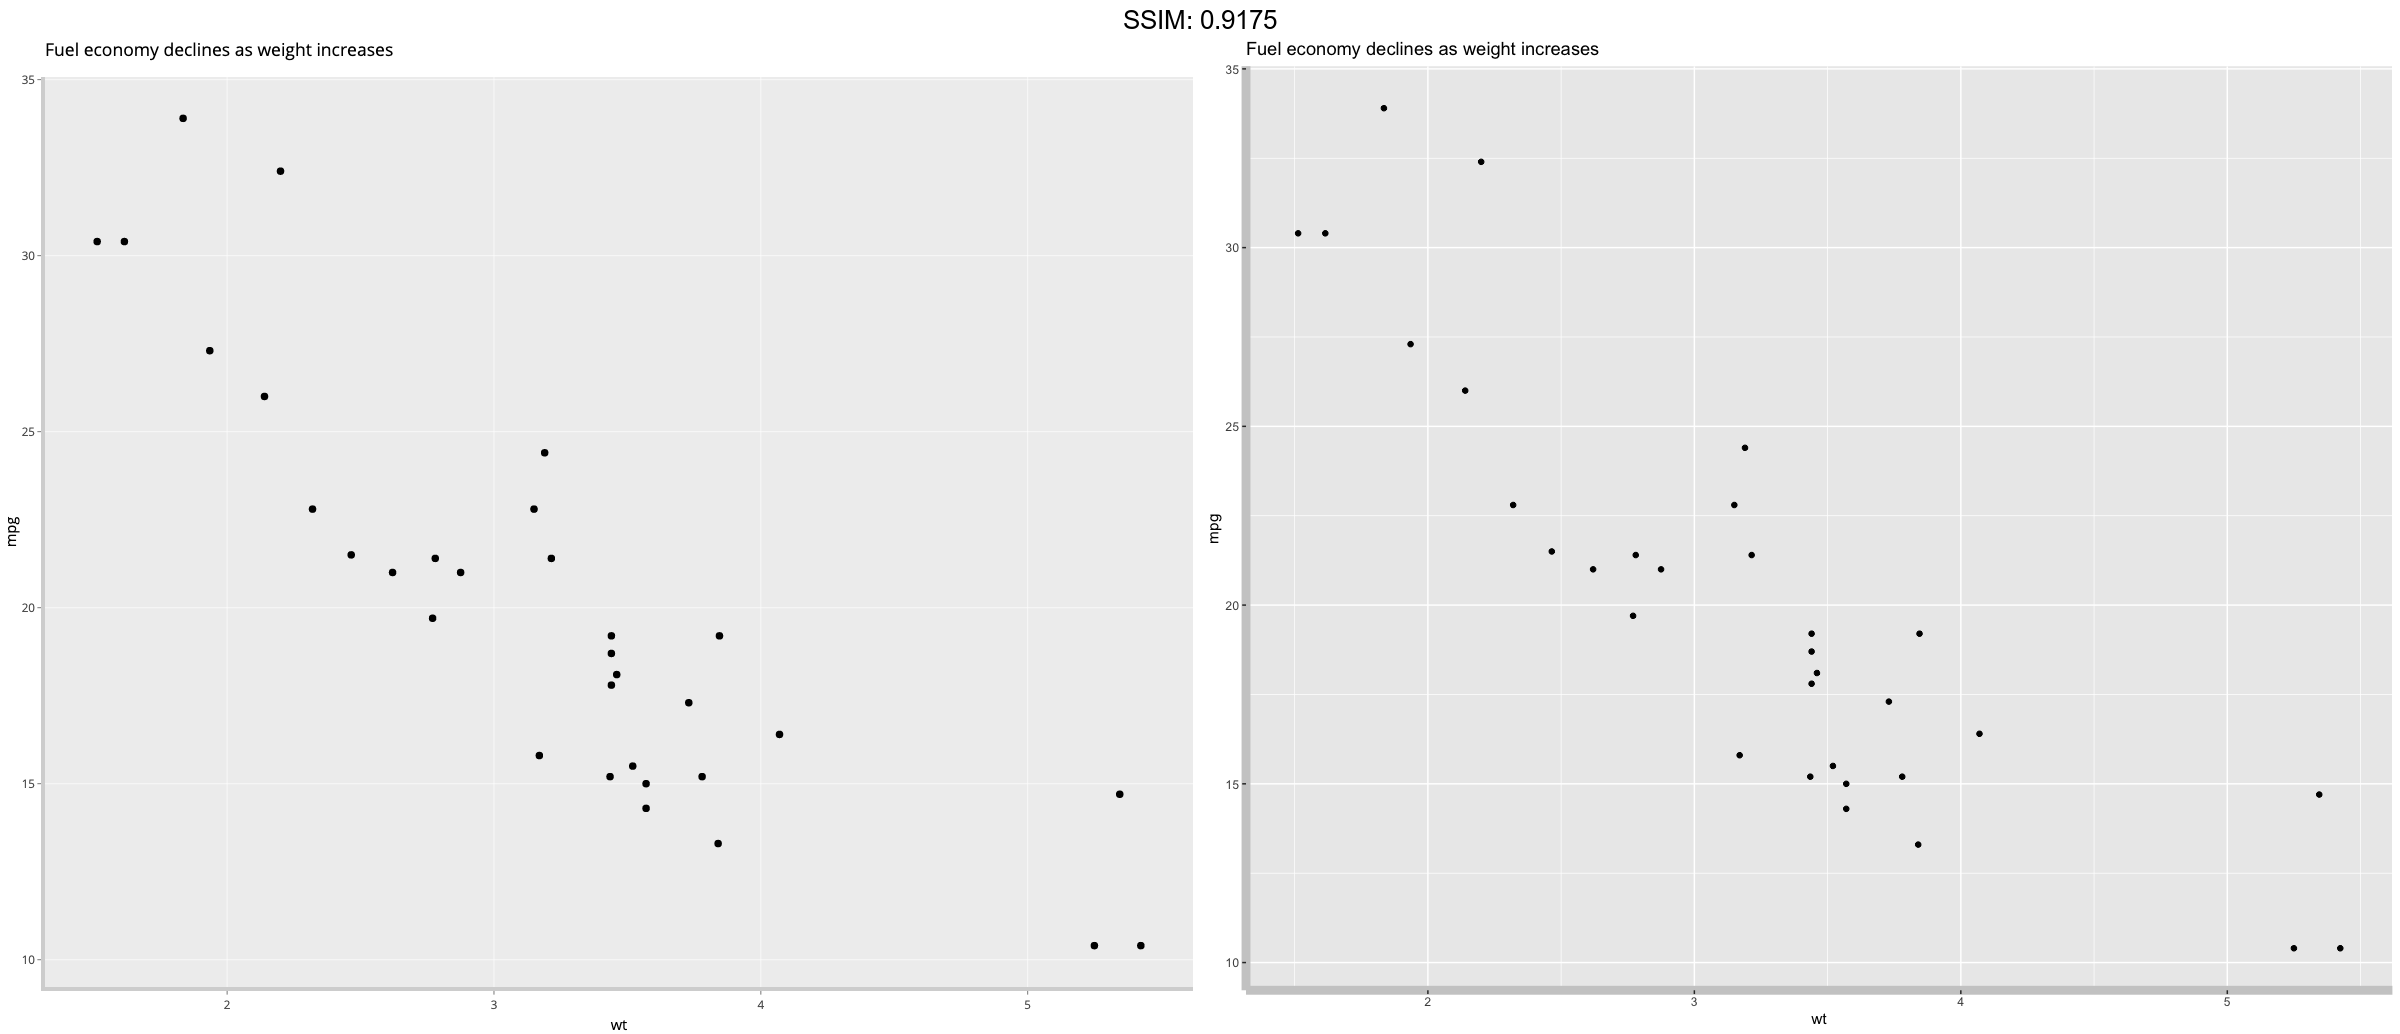
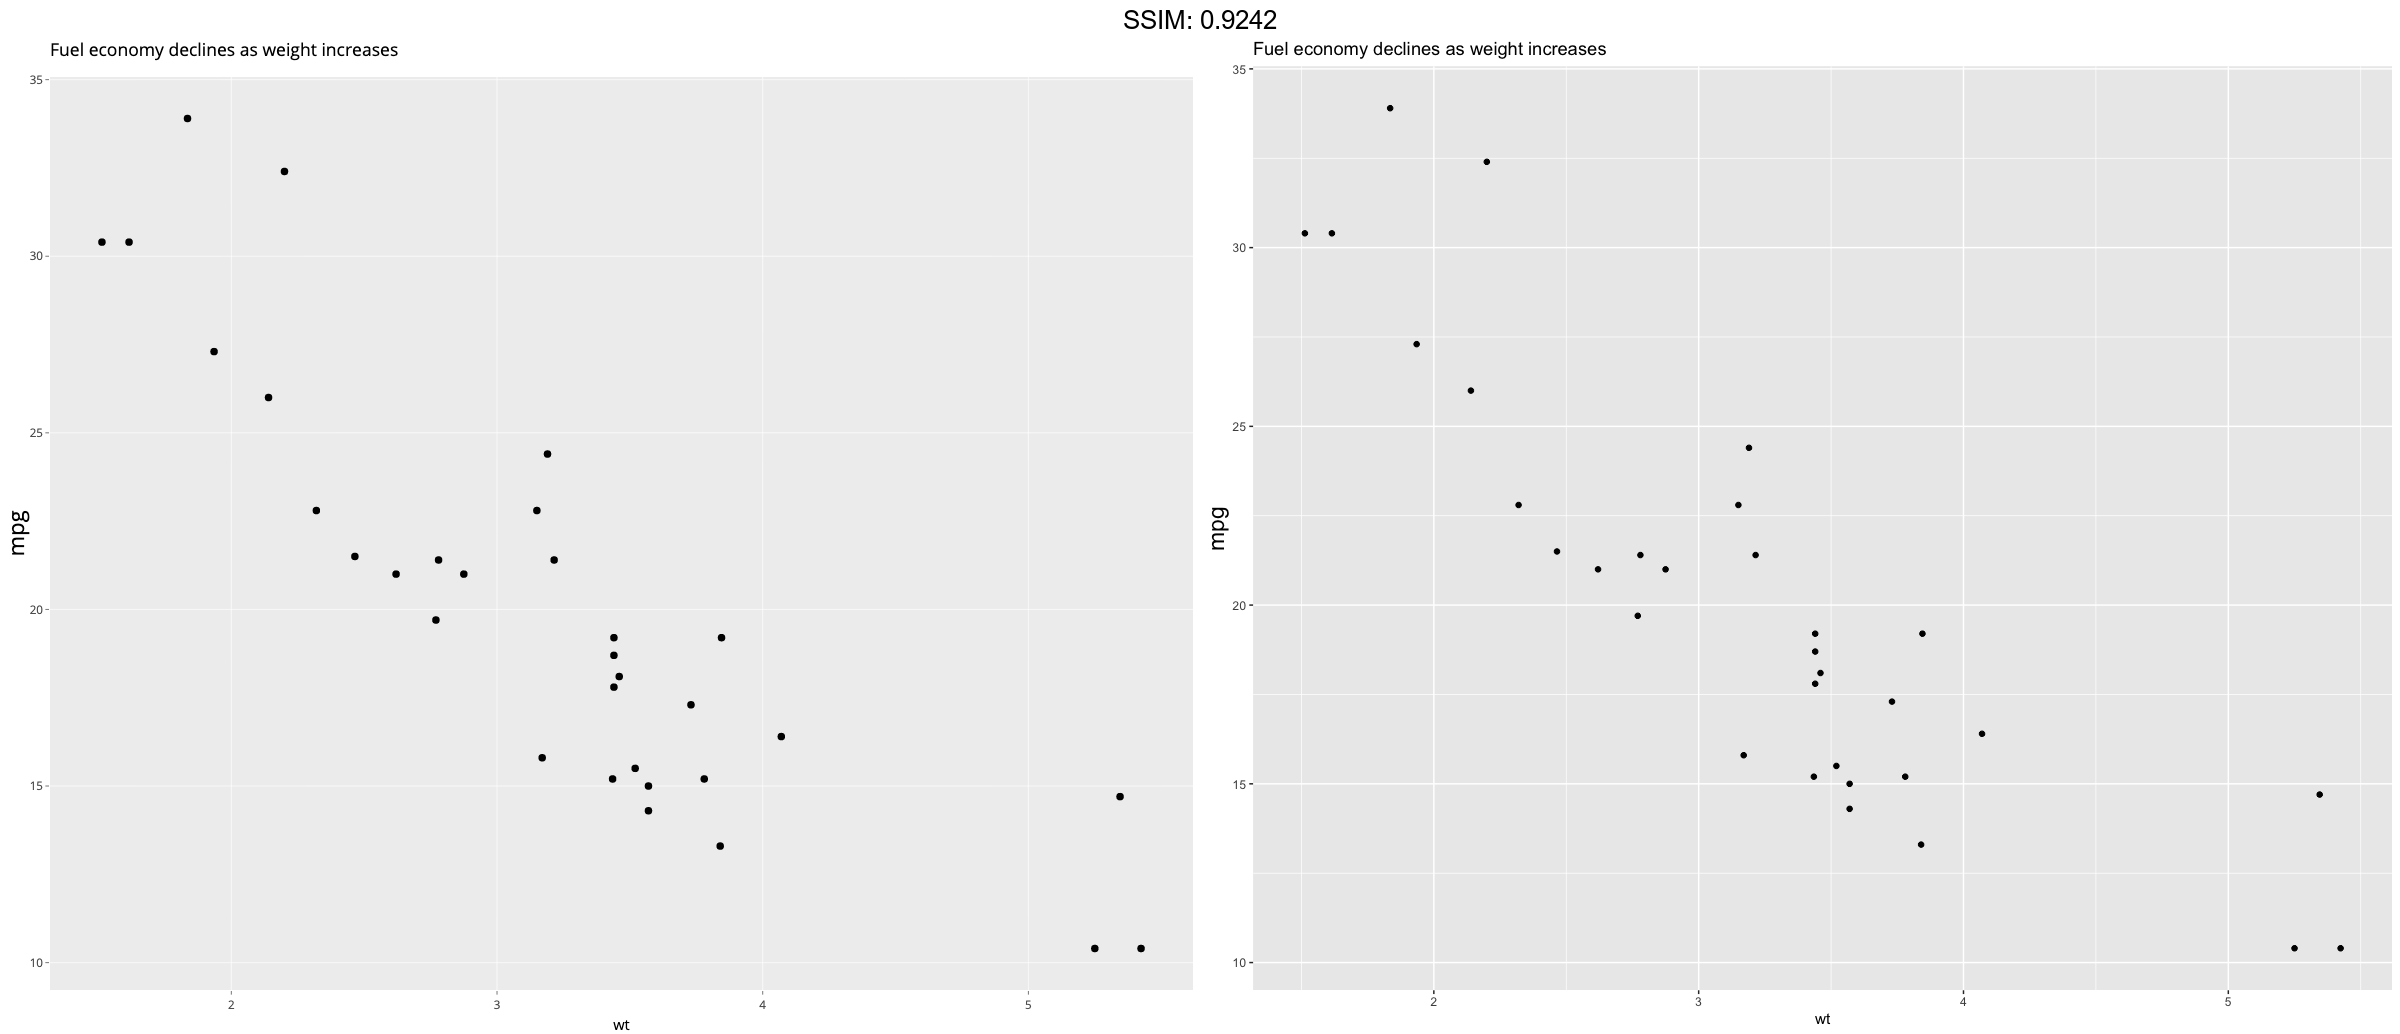
p1 <- ggplot(mtcars, aes(wt, mpg)) +
  geom_point() +
  labs(title = "Fuel economy declines as weight increases")
plotly::ggplotly(p1)

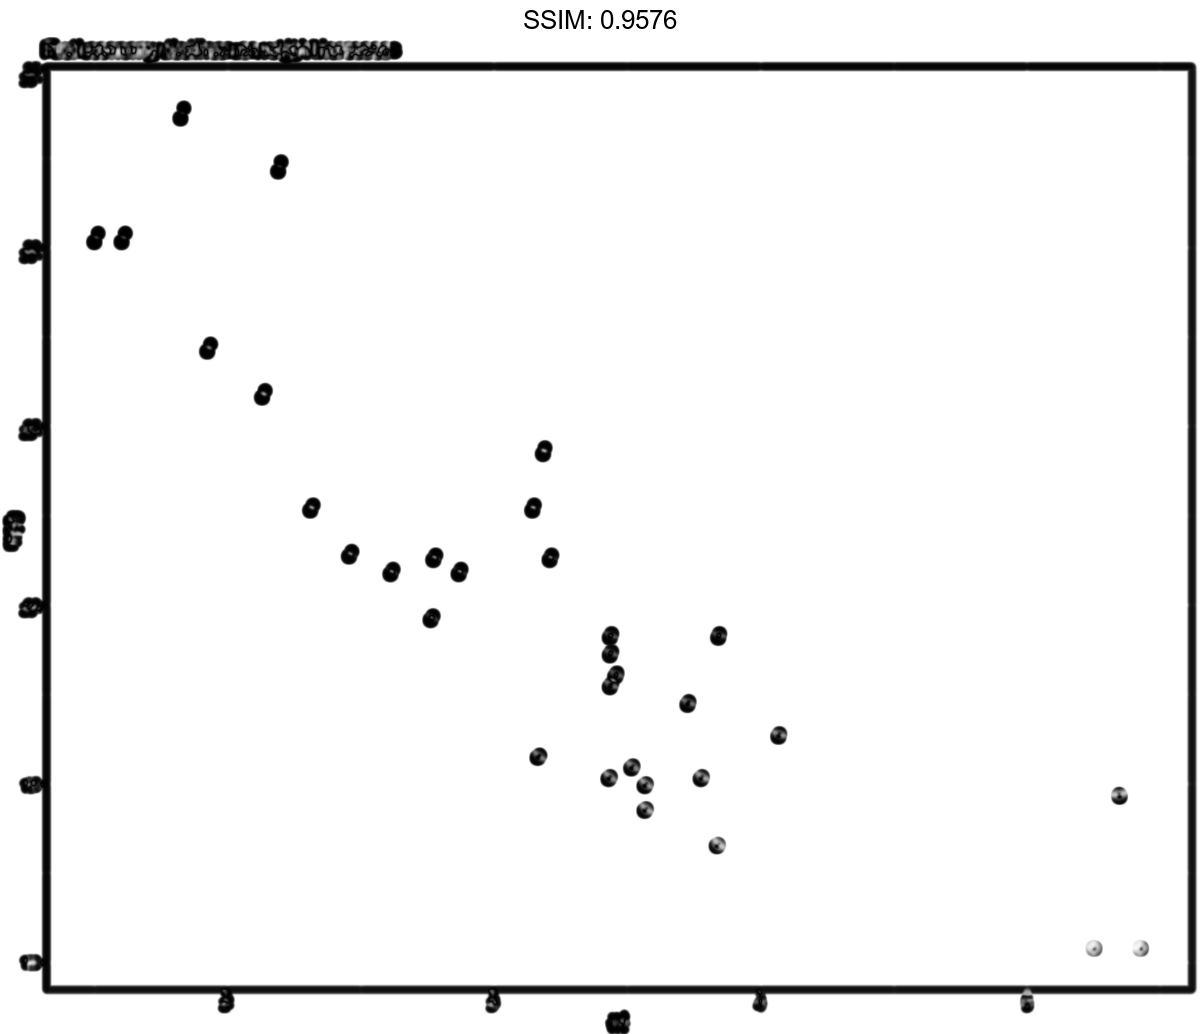
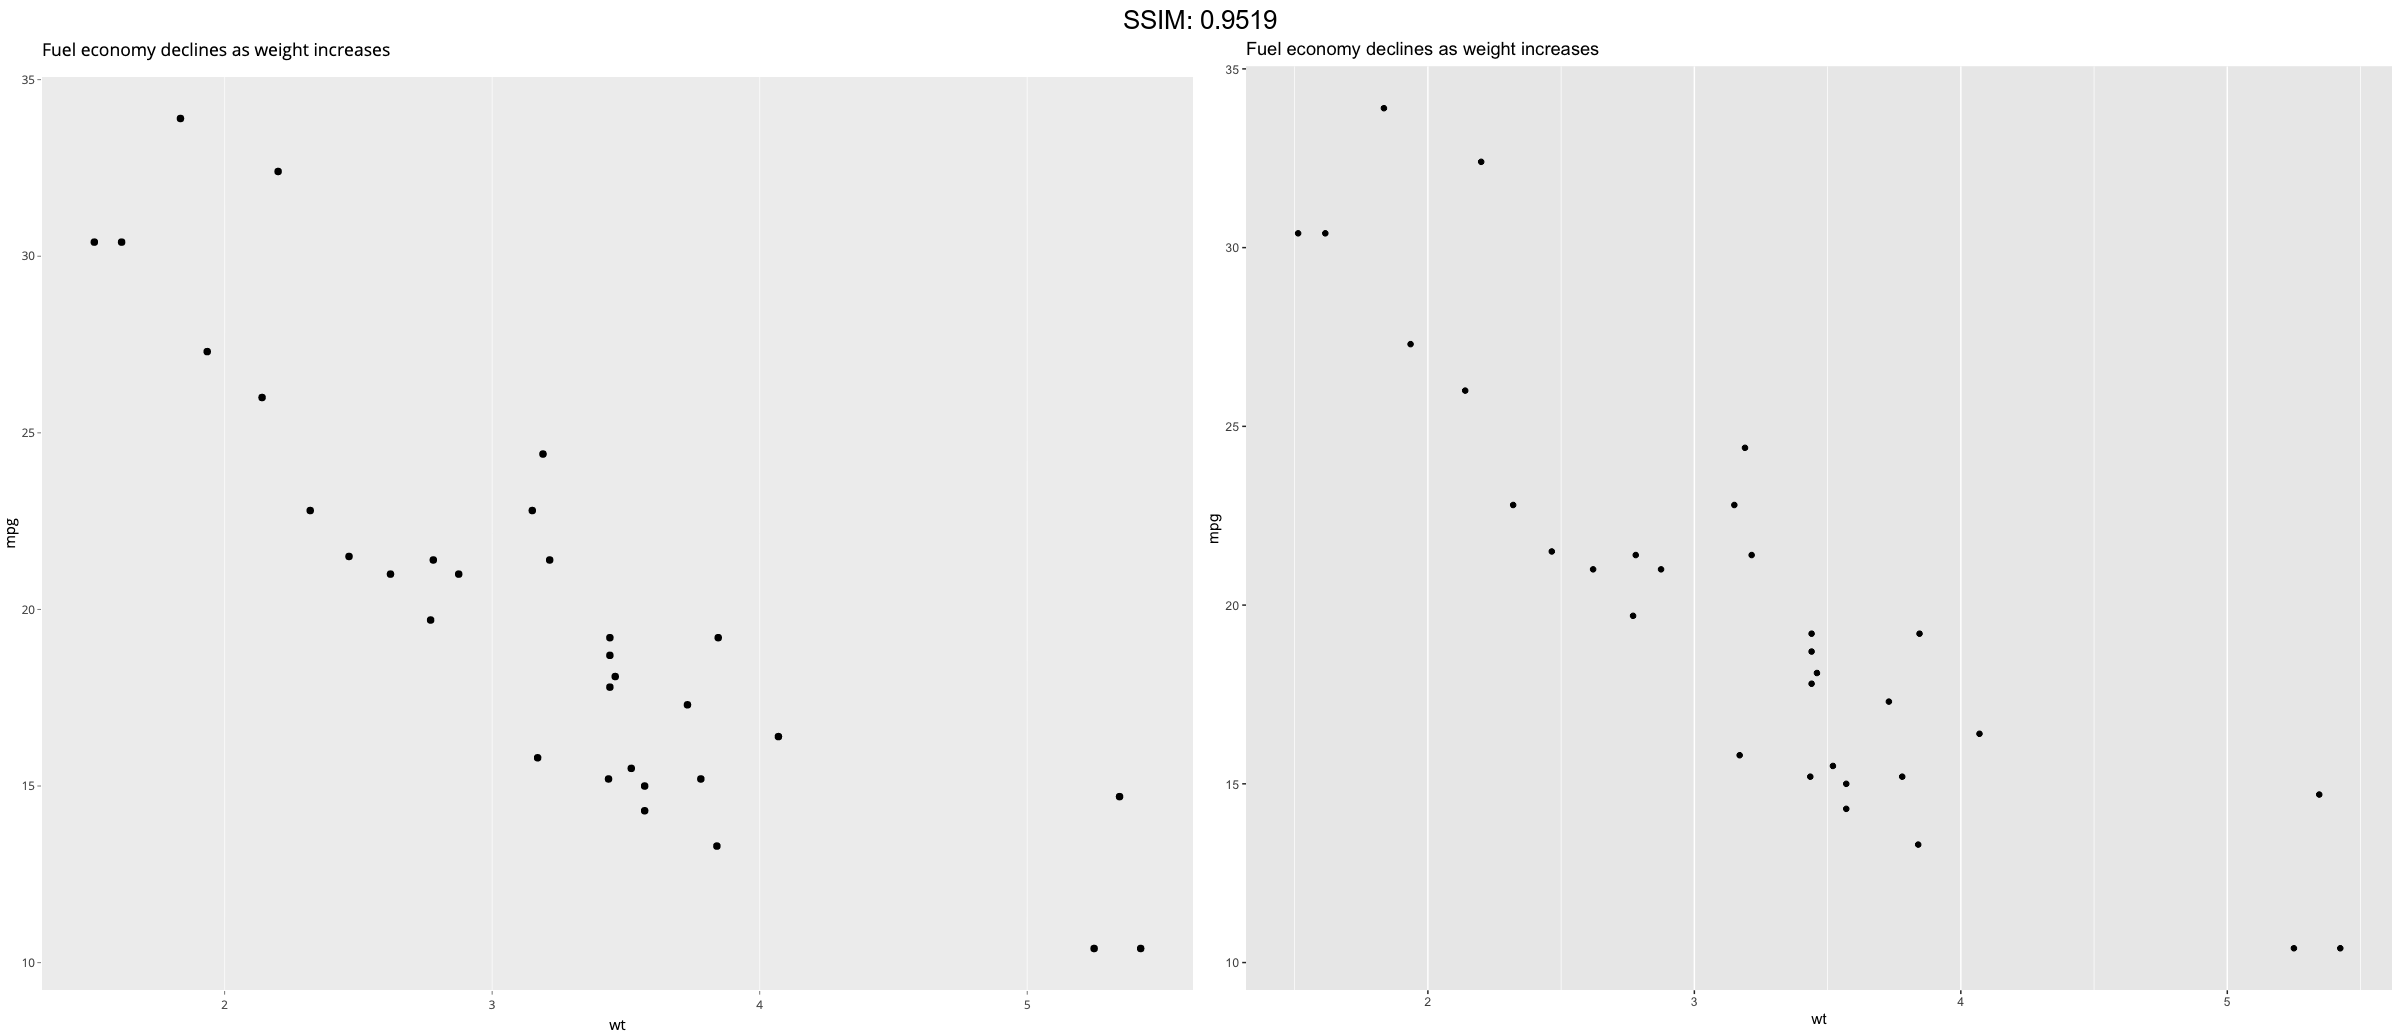
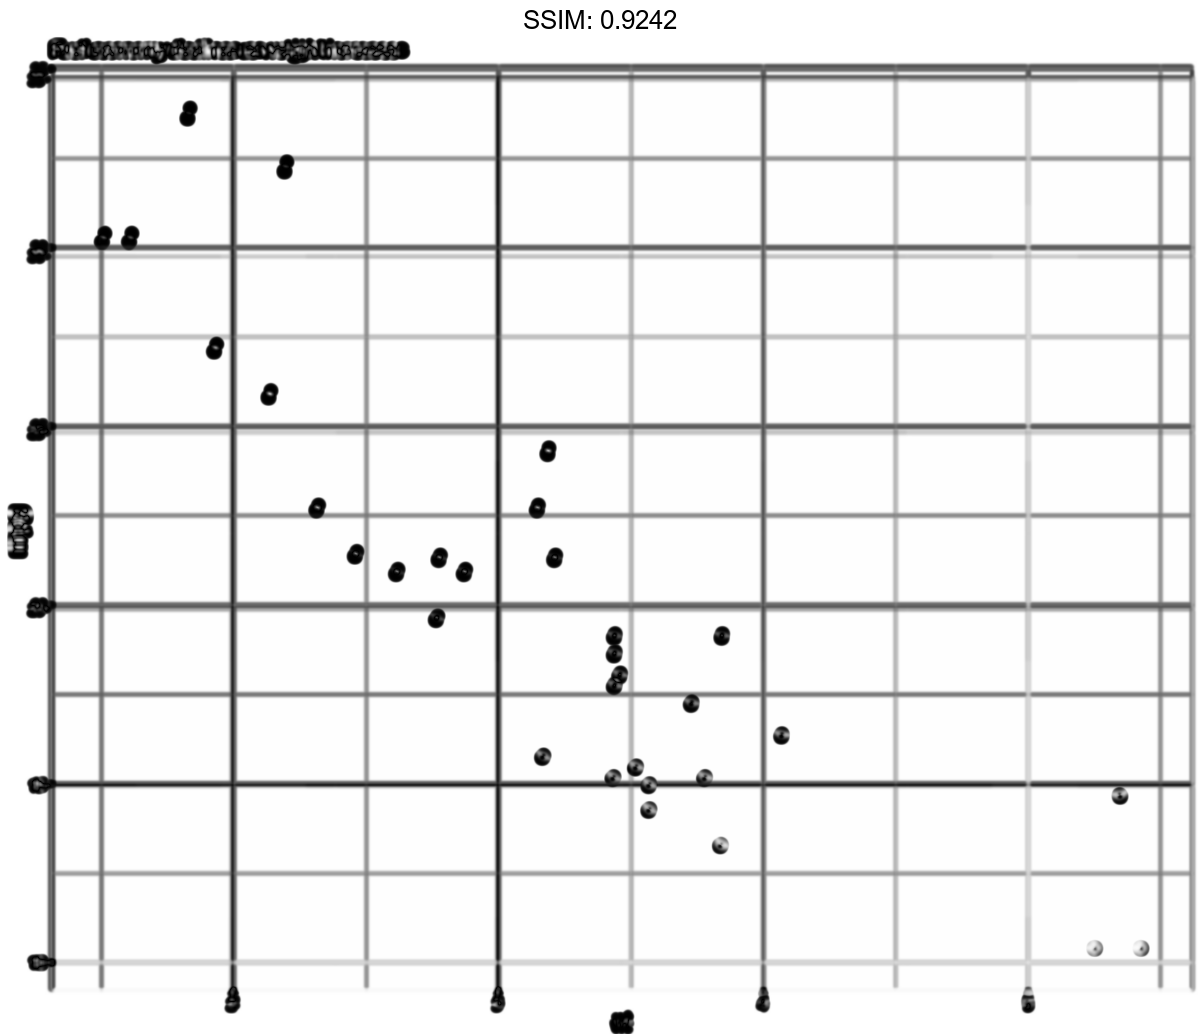
p1 <- ggplot(mtcars, aes(wt, mpg)) +
  geom_point() +
  labs(title = "Fuel economy declines as weight increases")
p <-  p1 + theme(plot.title = element_text(size = rel(2)))
plotly::ggplotly(p)
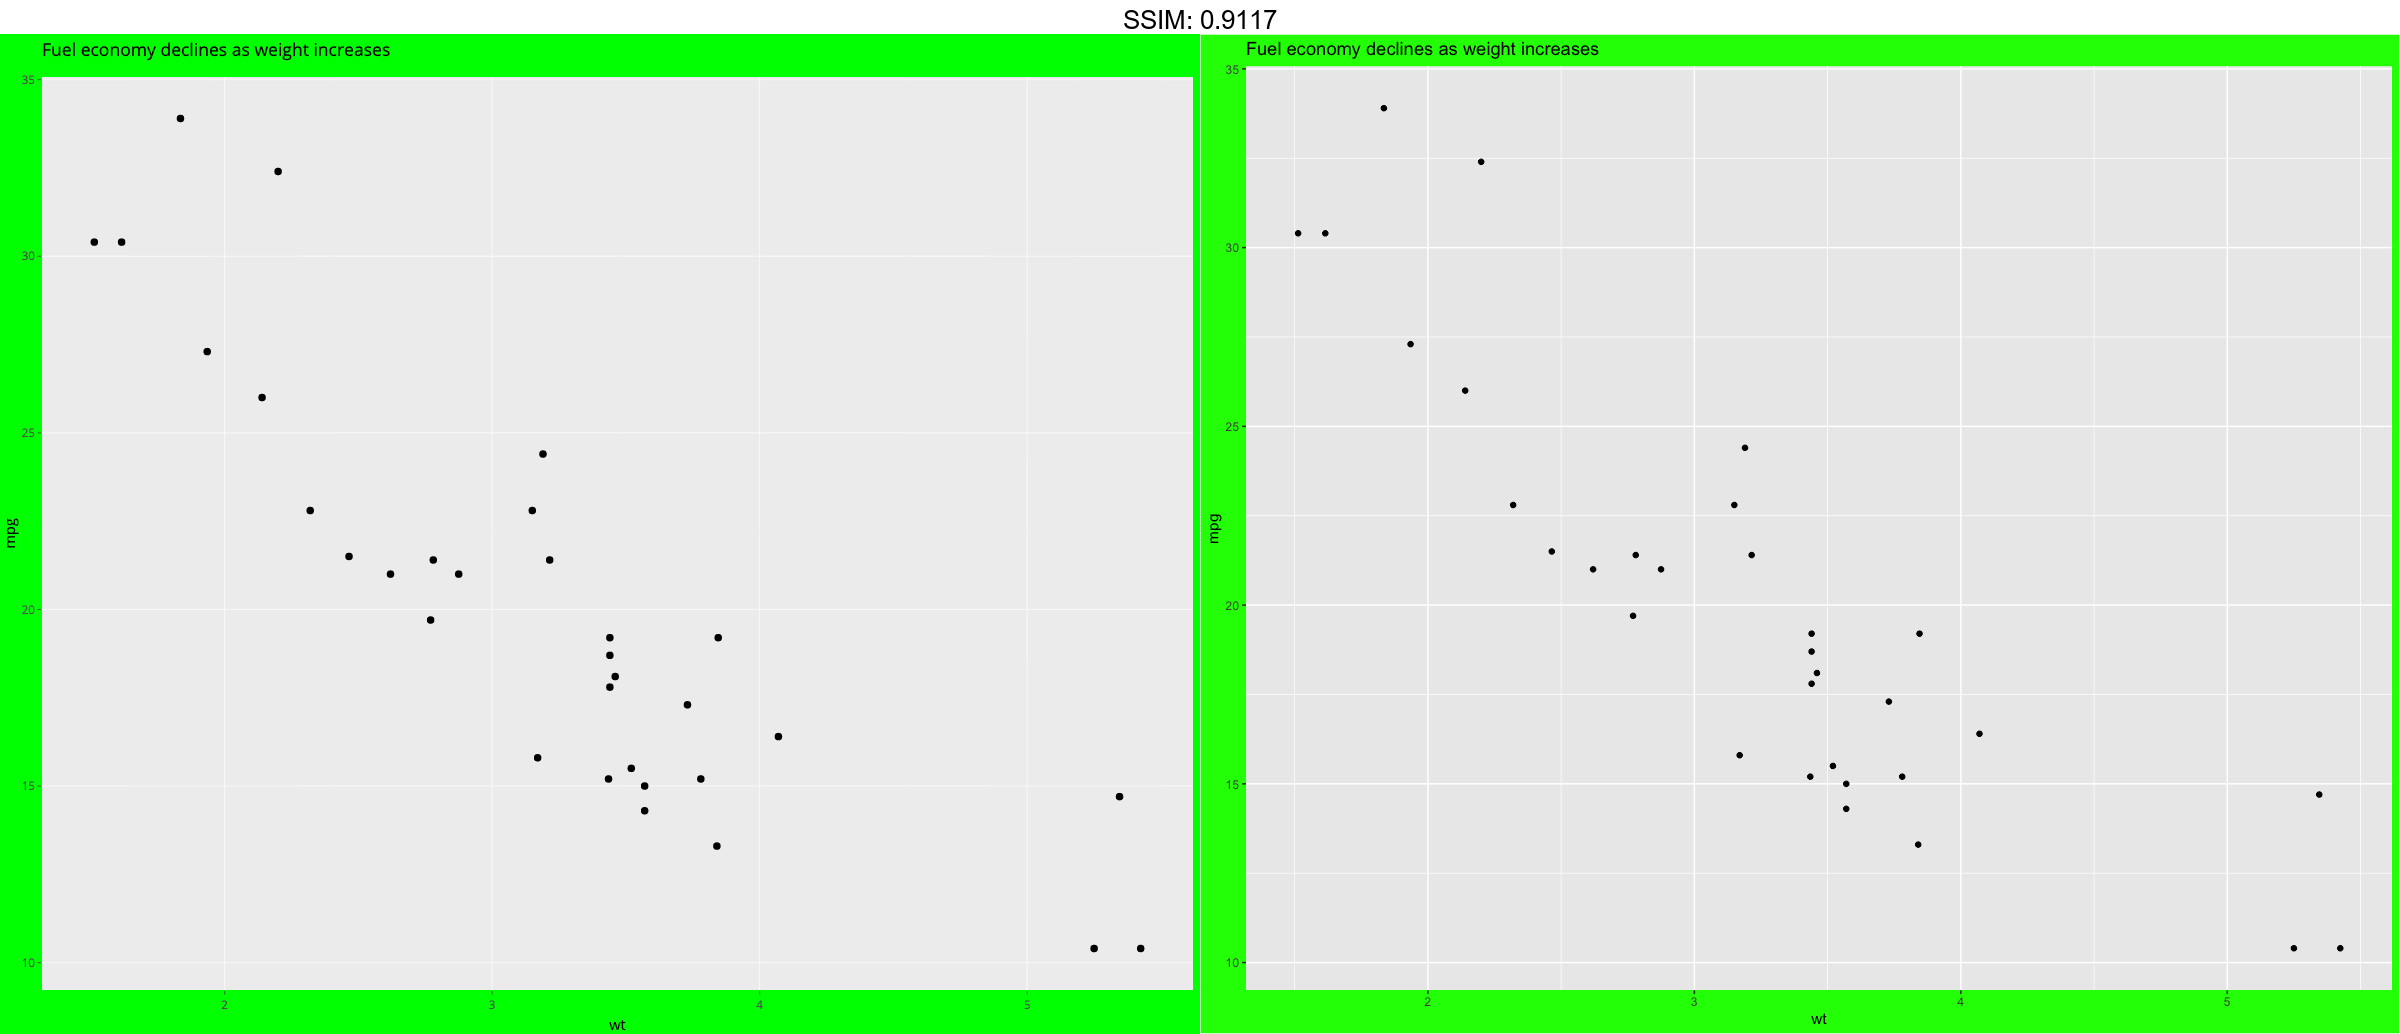
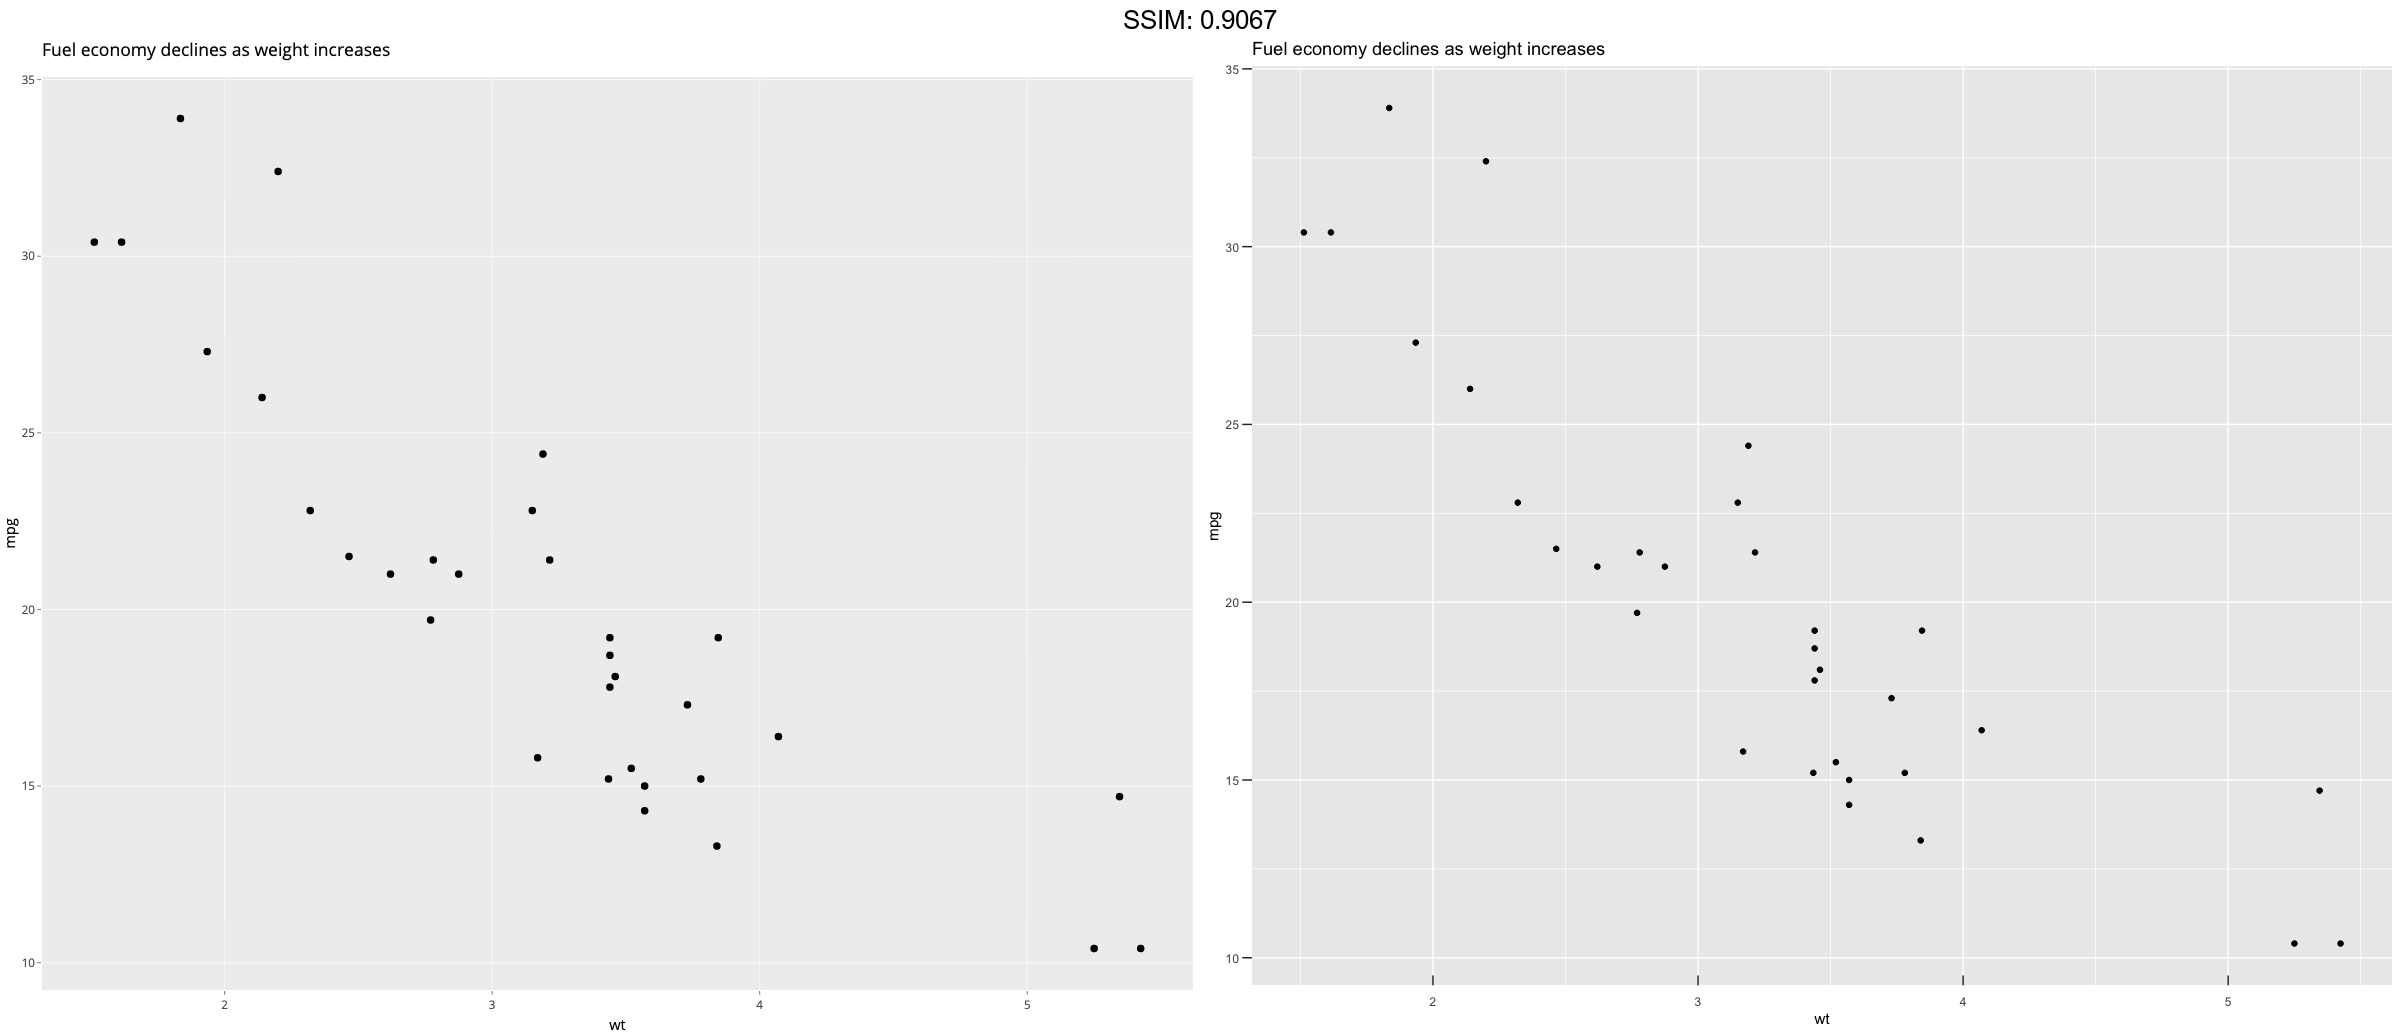
p1 <- ggplot(mtcars, aes(wt, mpg)) +
  geom_point() +
  labs(title = "Fuel economy declines as weight increases")
p <-  p1 + theme(plot.background = element_rect(fill = "green"))
plotly::ggplotly(p)
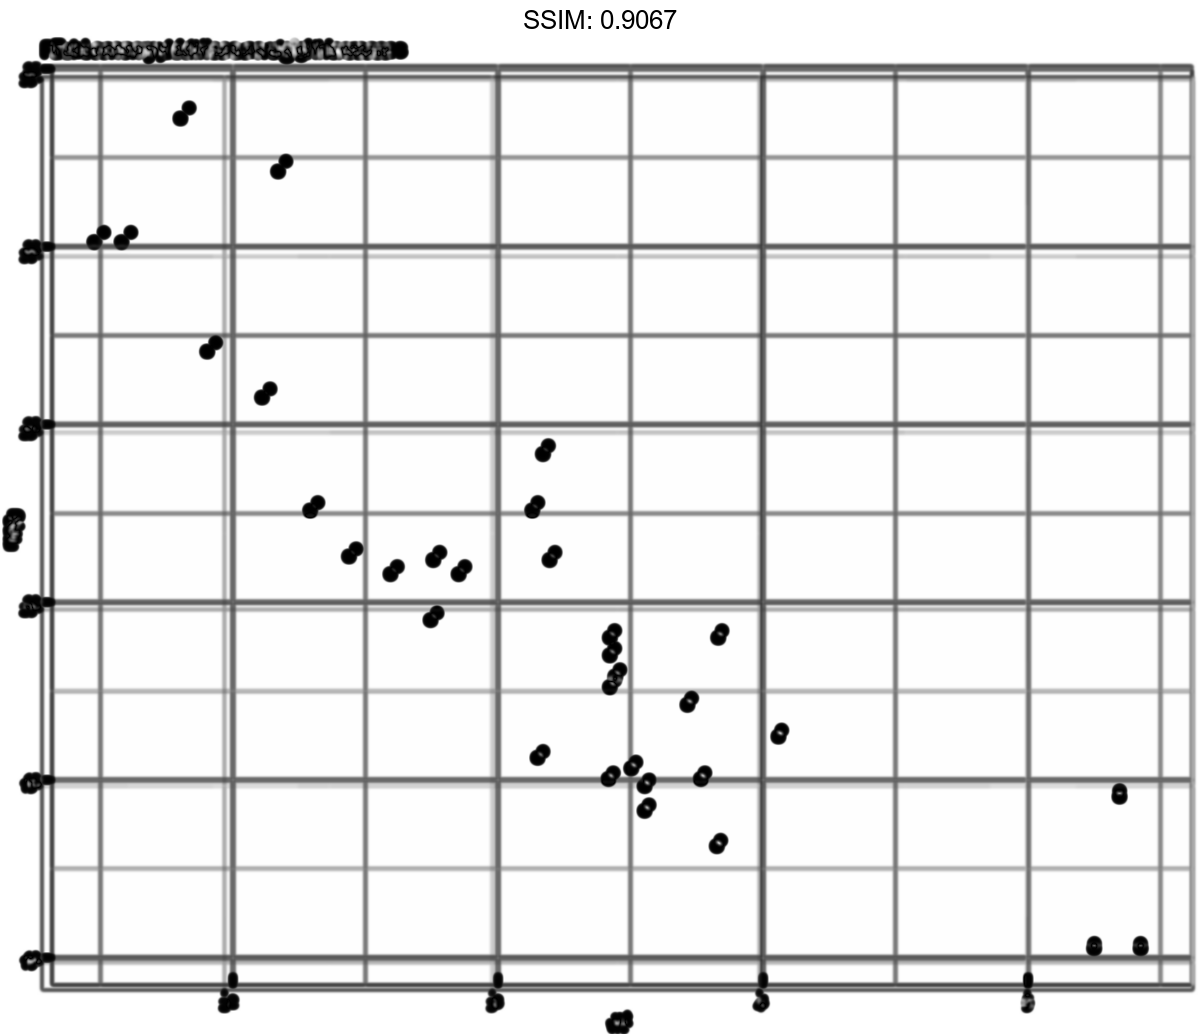
p1 <- ggplot(mtcars, aes(wt, mpg)) +
  geom_point() +
  labs(title = "Fuel economy declines as weight increases")
p <-  p1 + theme(panel.background = element_rect(fill = "white", colour = "grey50"))
plotly::ggplotly(p)
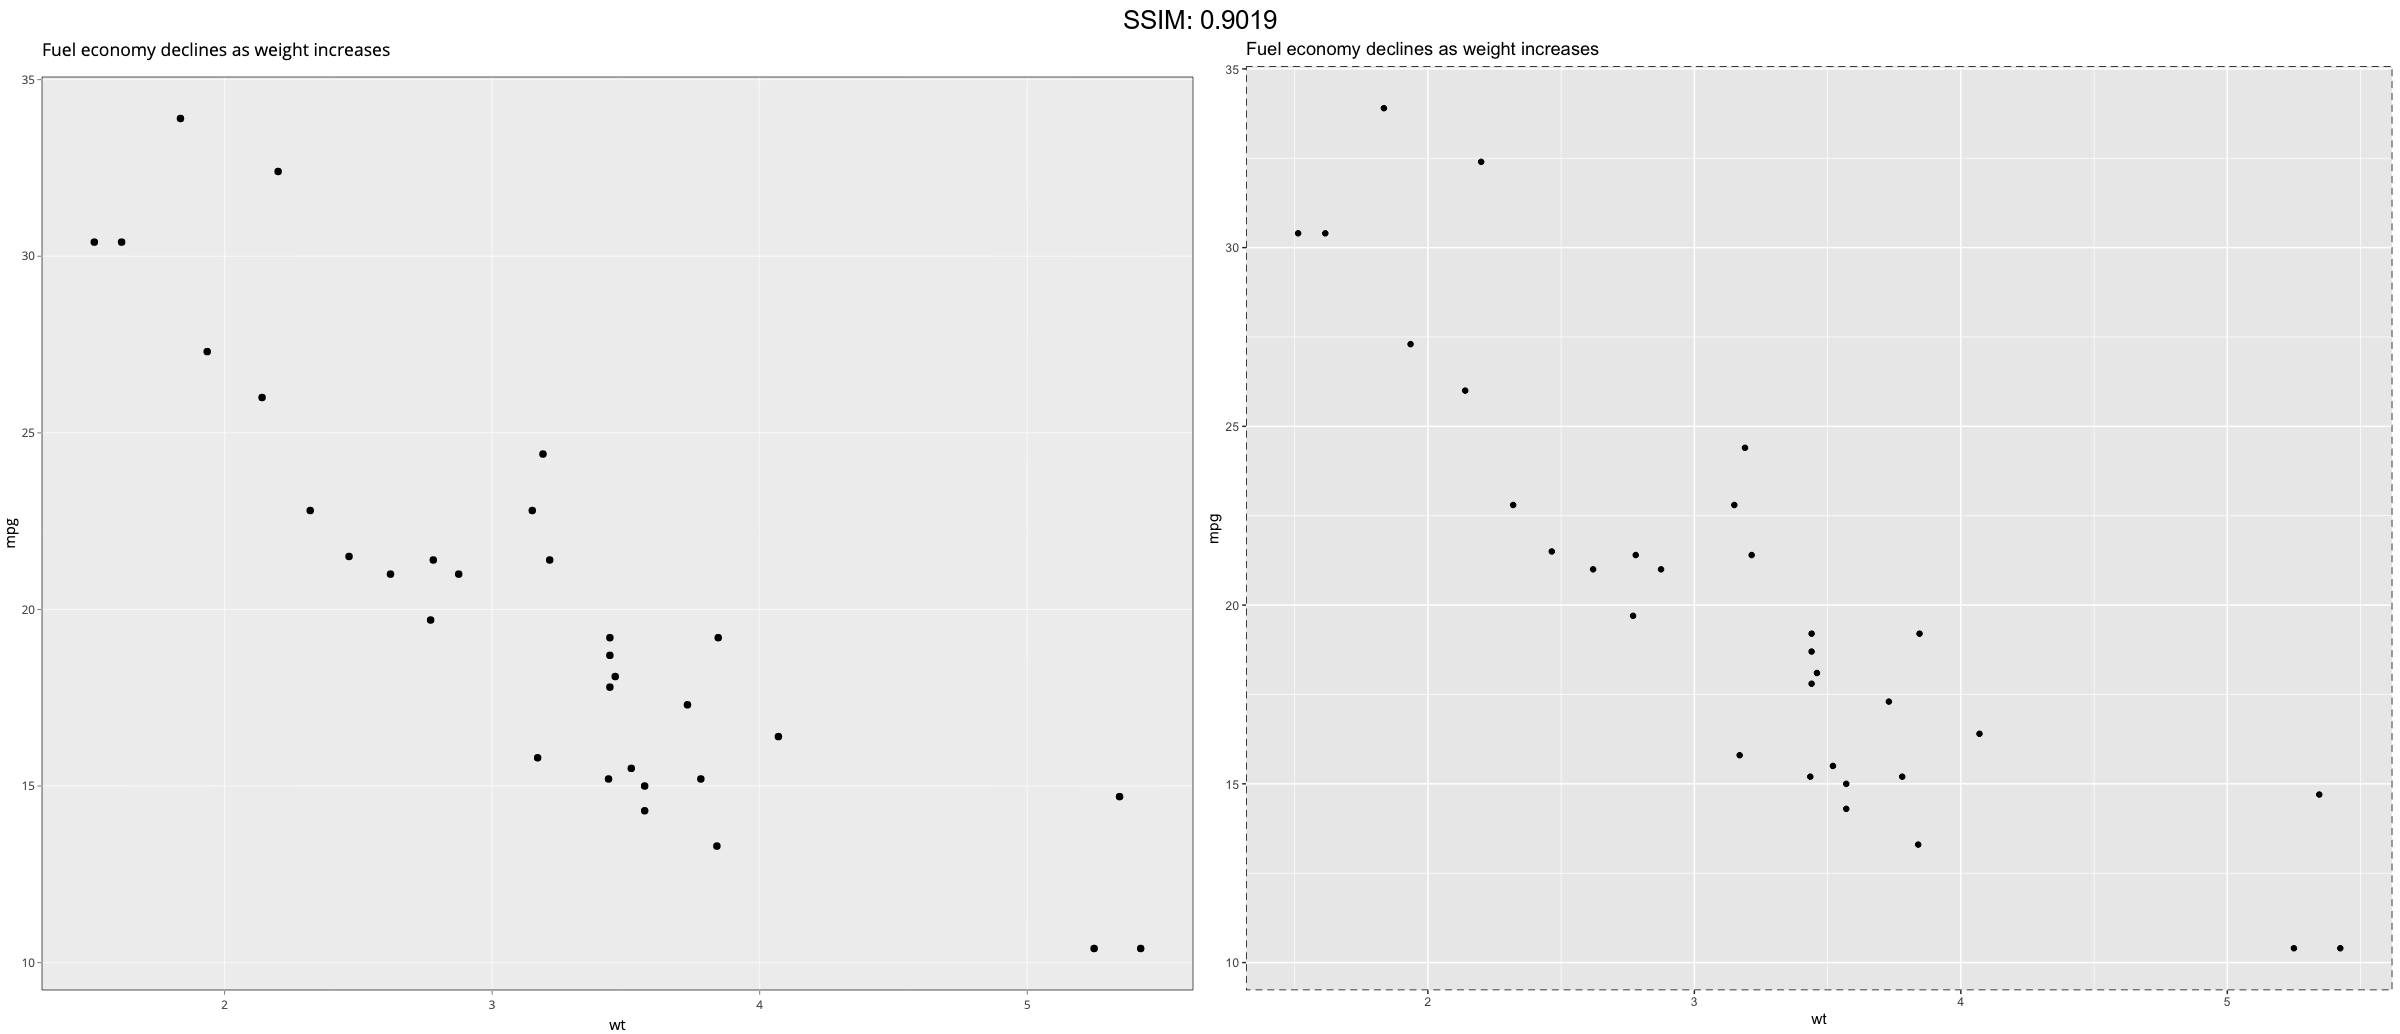
p1 <- ggplot(mtcars, aes(wt, mpg)) +
  geom_point() +
  labs(title = "Fuel economy declines as weight increases")
p <-  p1 + theme(panel.border = element_rect(linetype = "dashed", fill = NA))
plotly::ggplotly(p)
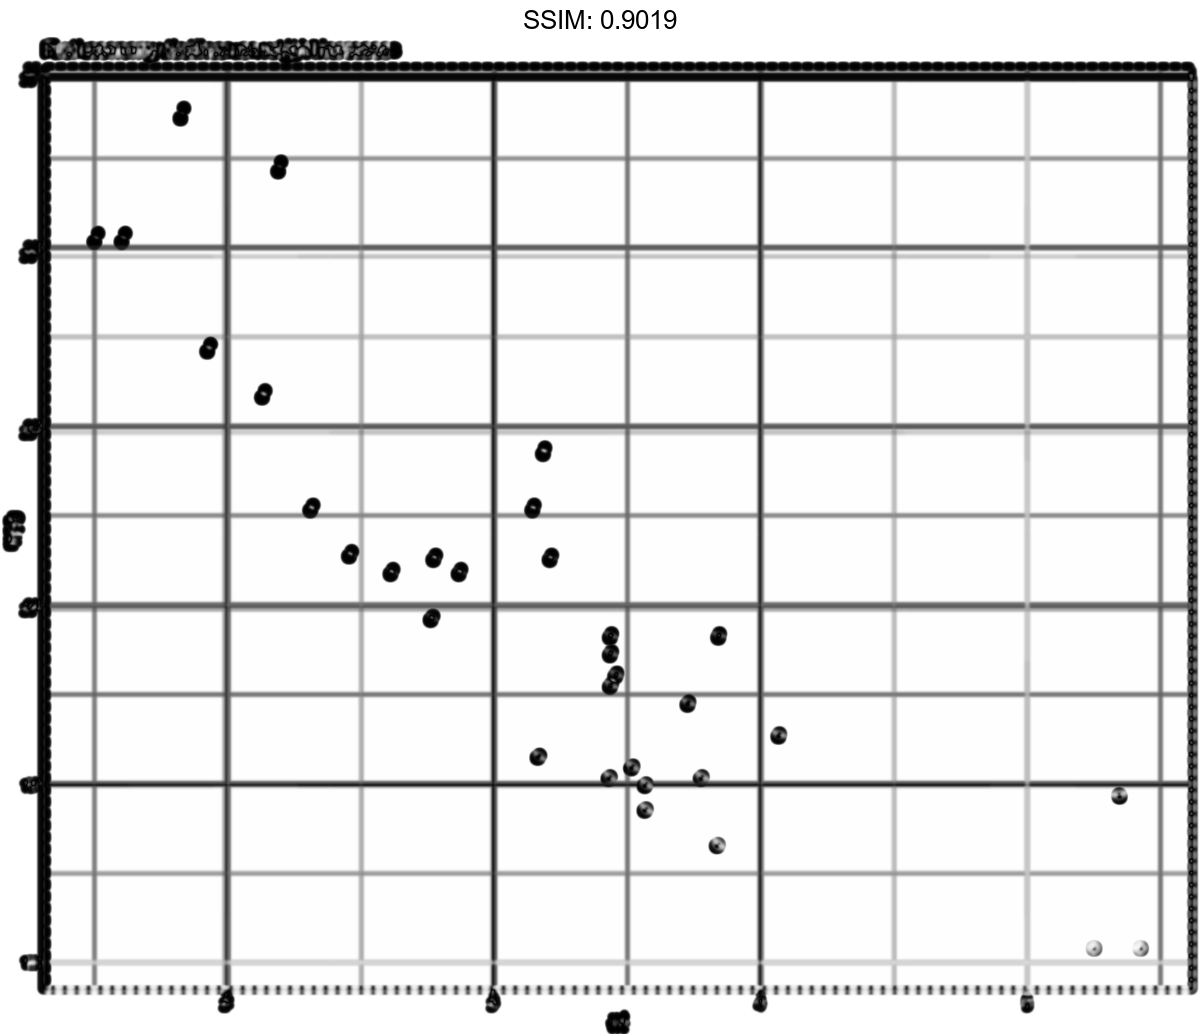
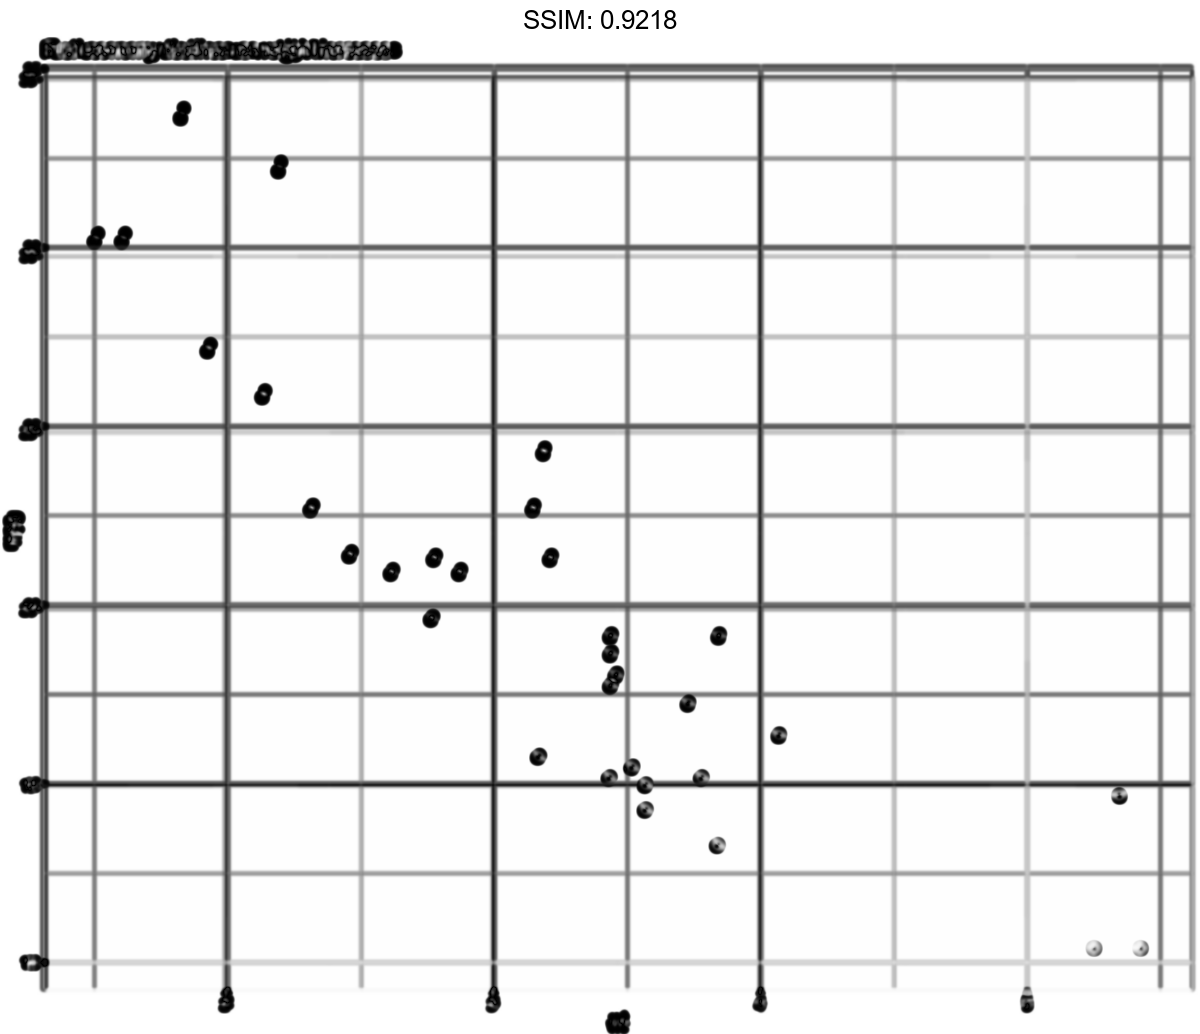
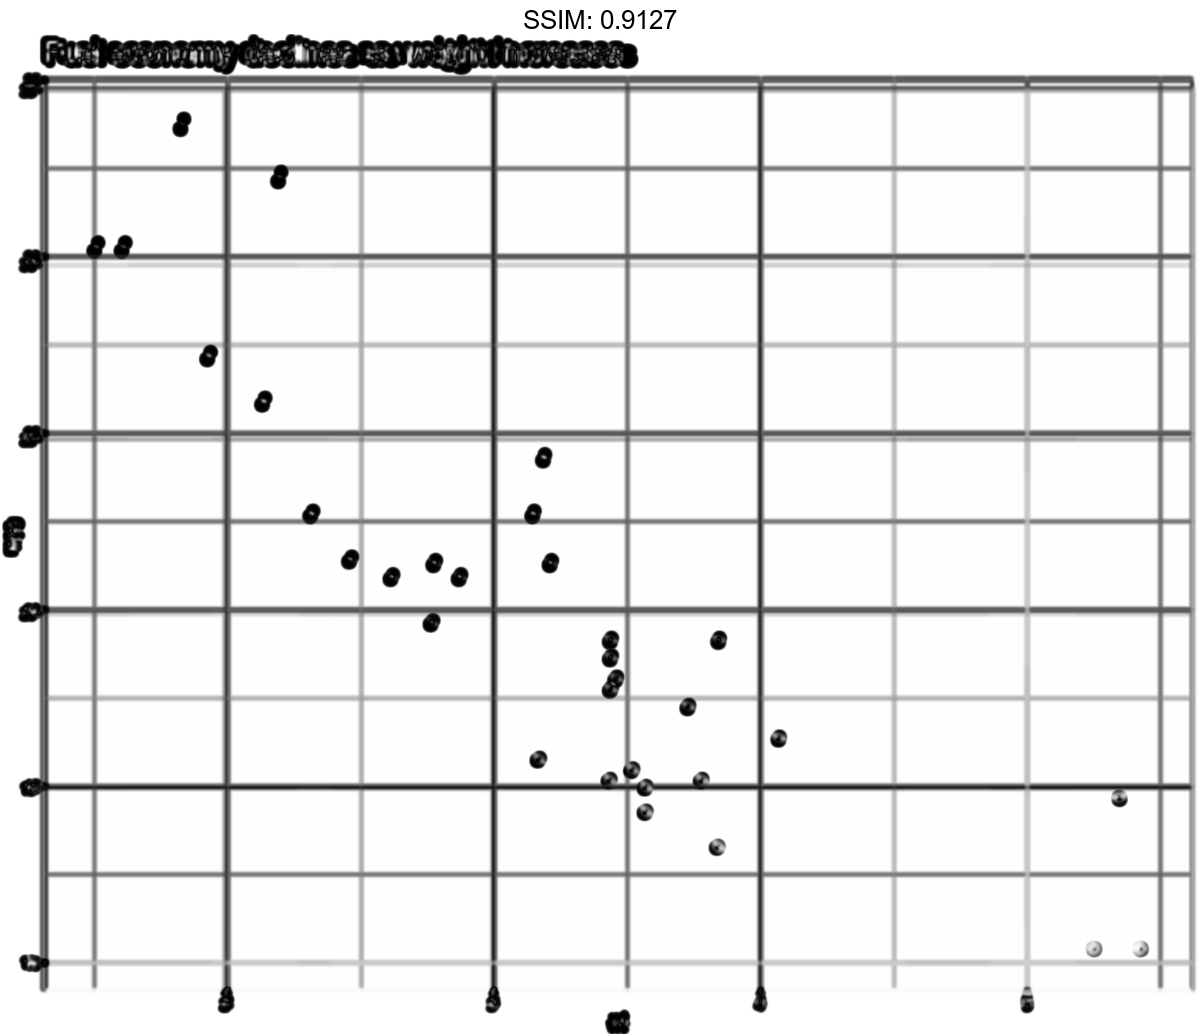
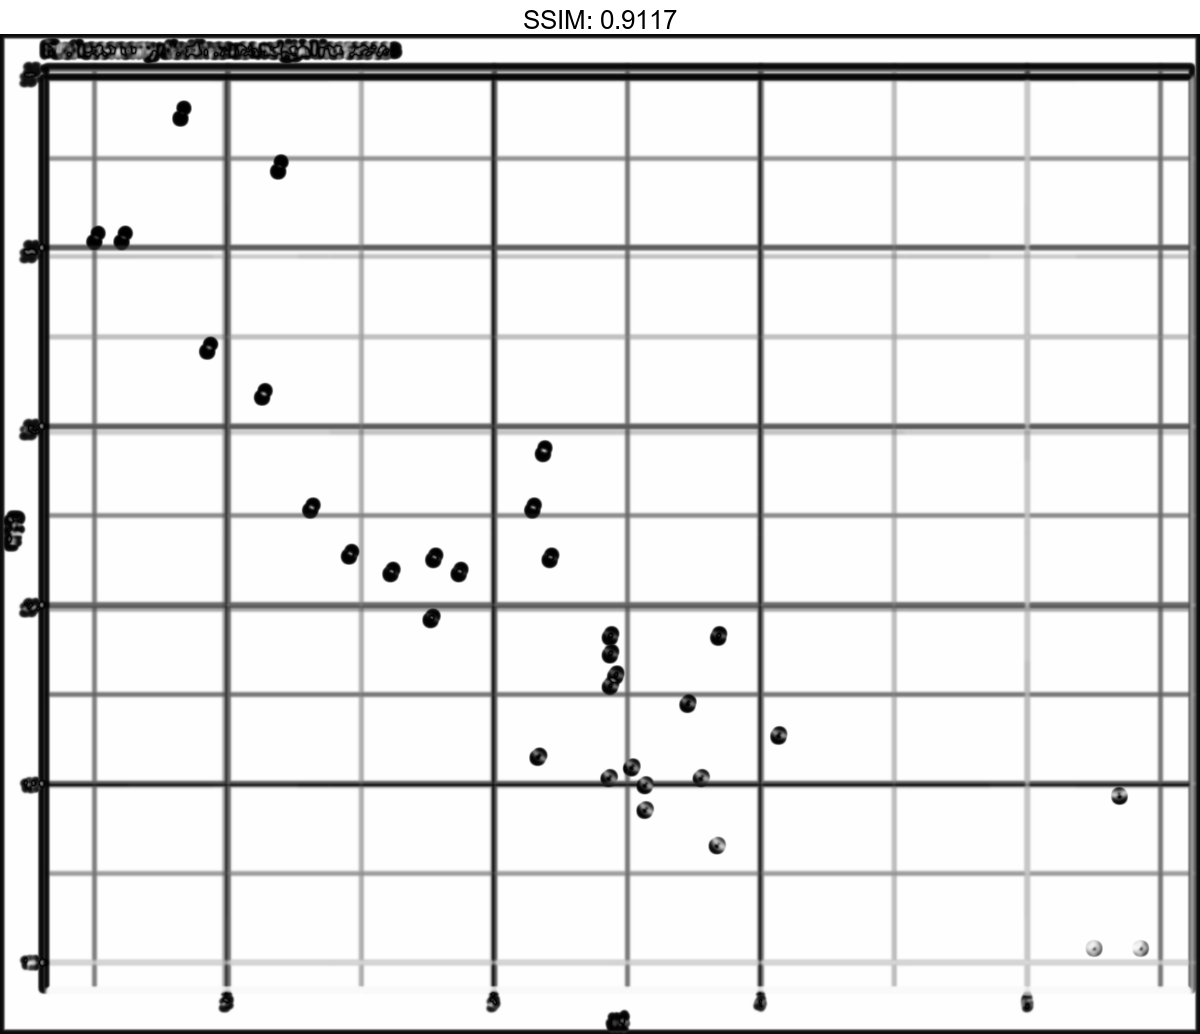
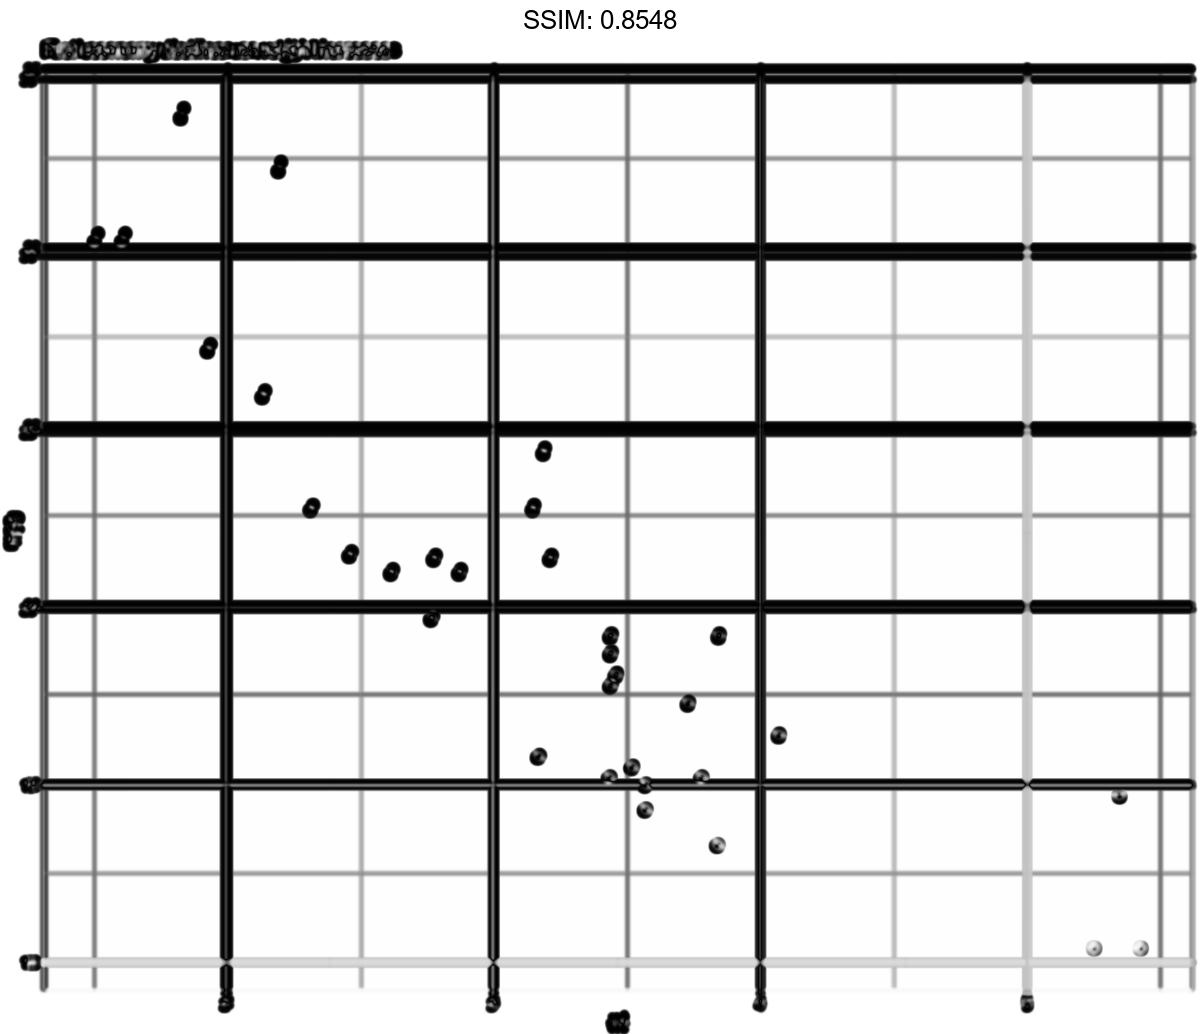
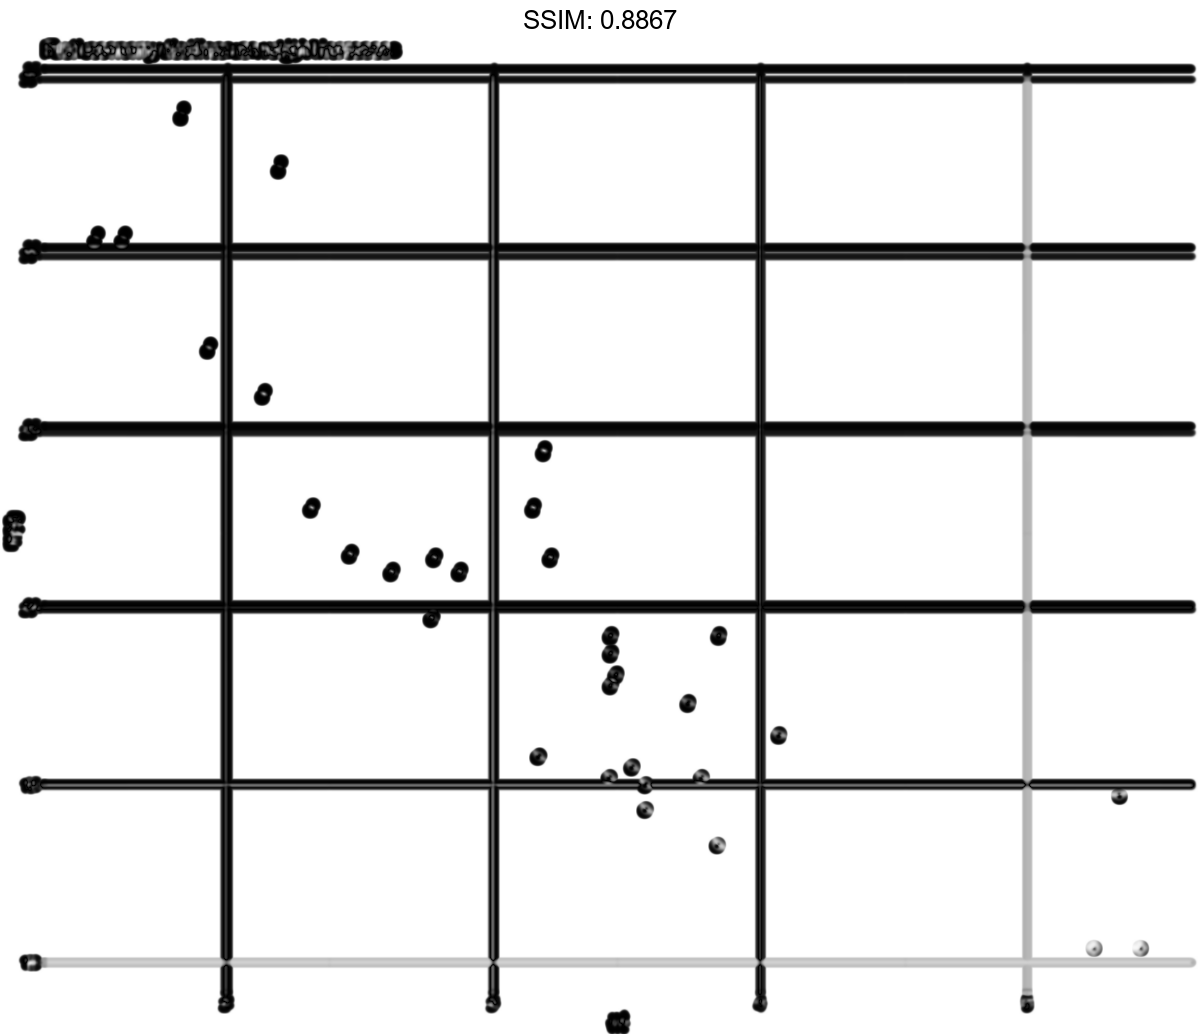
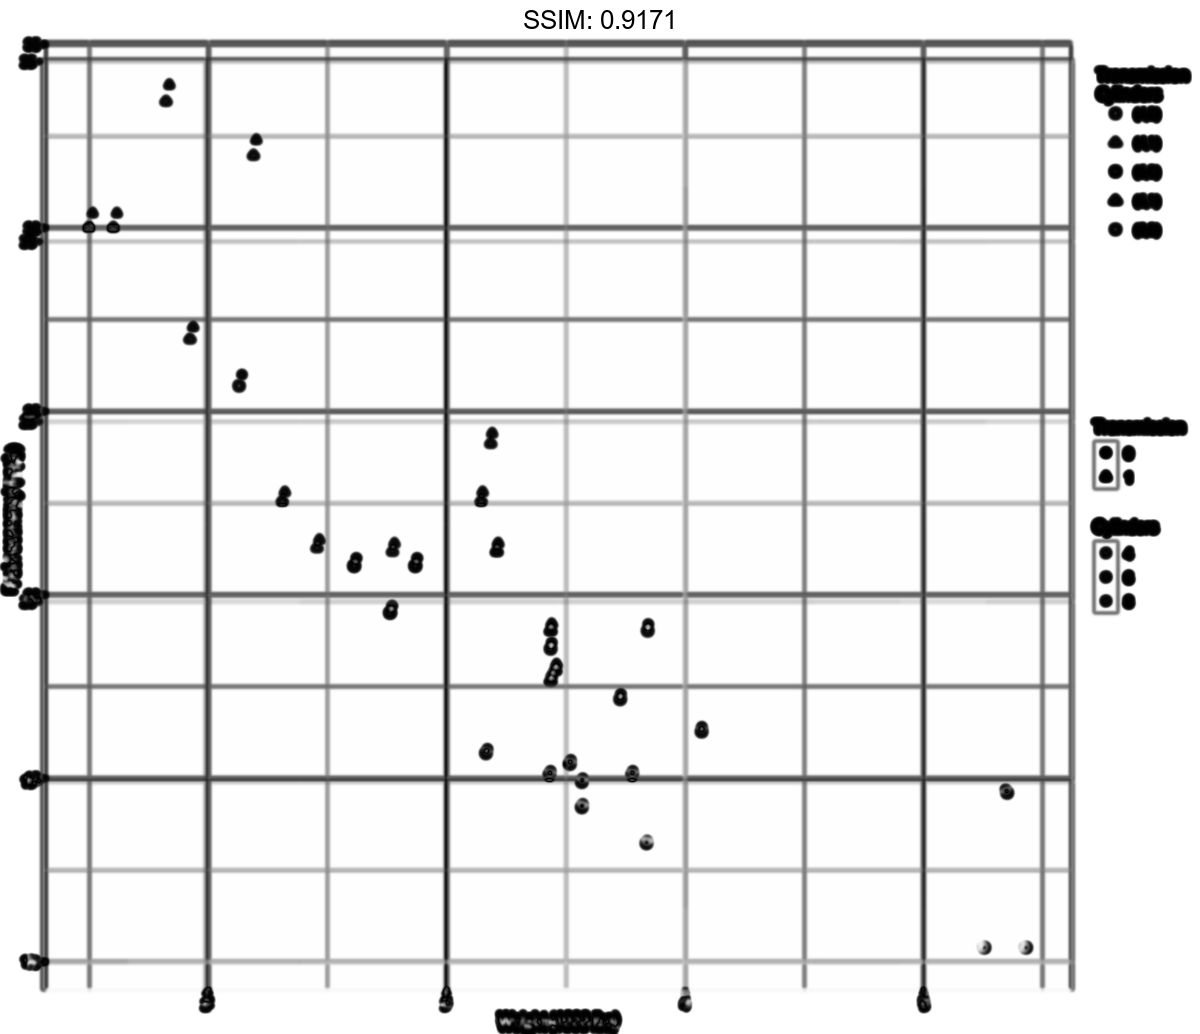
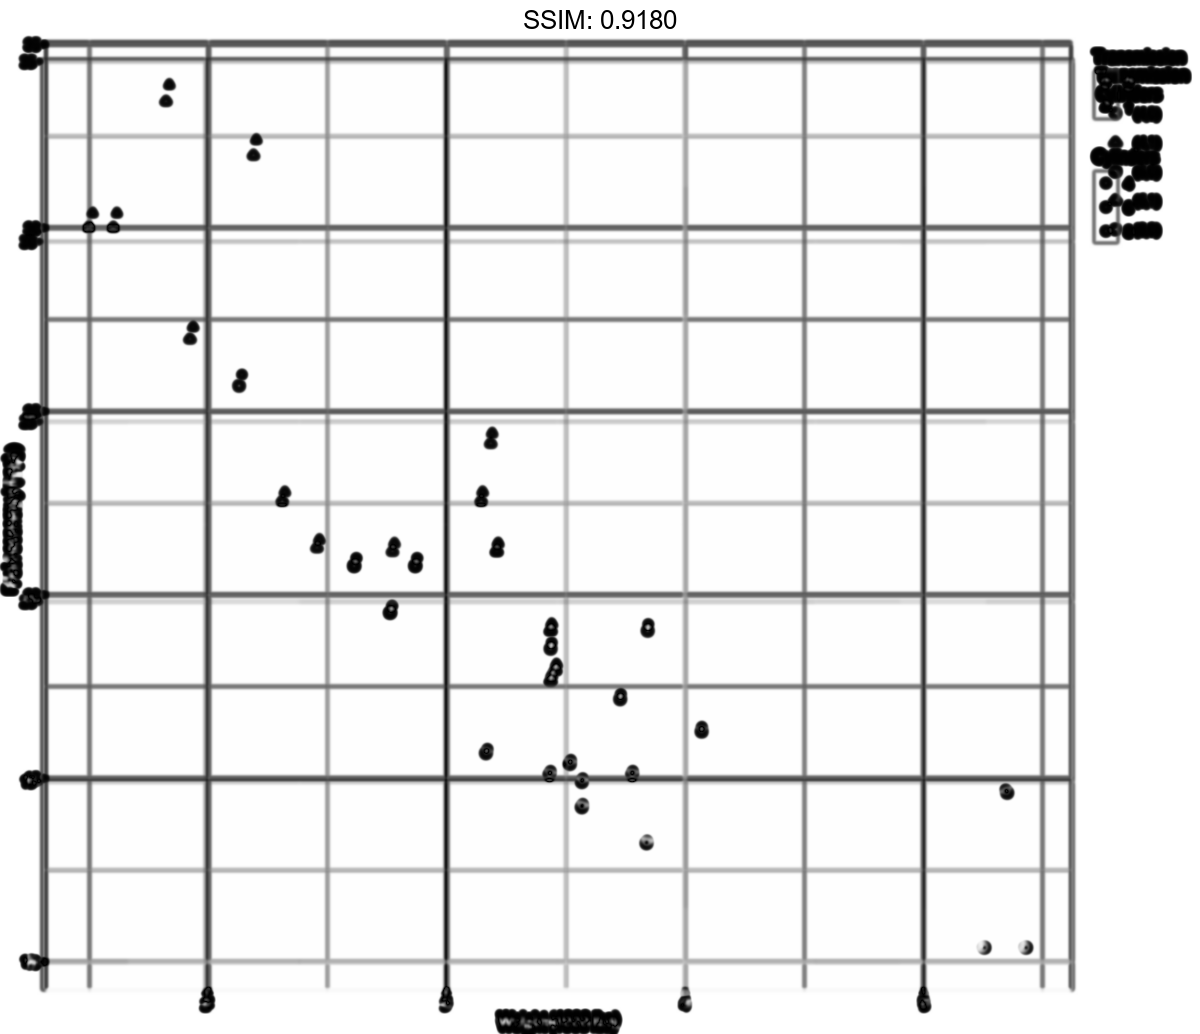
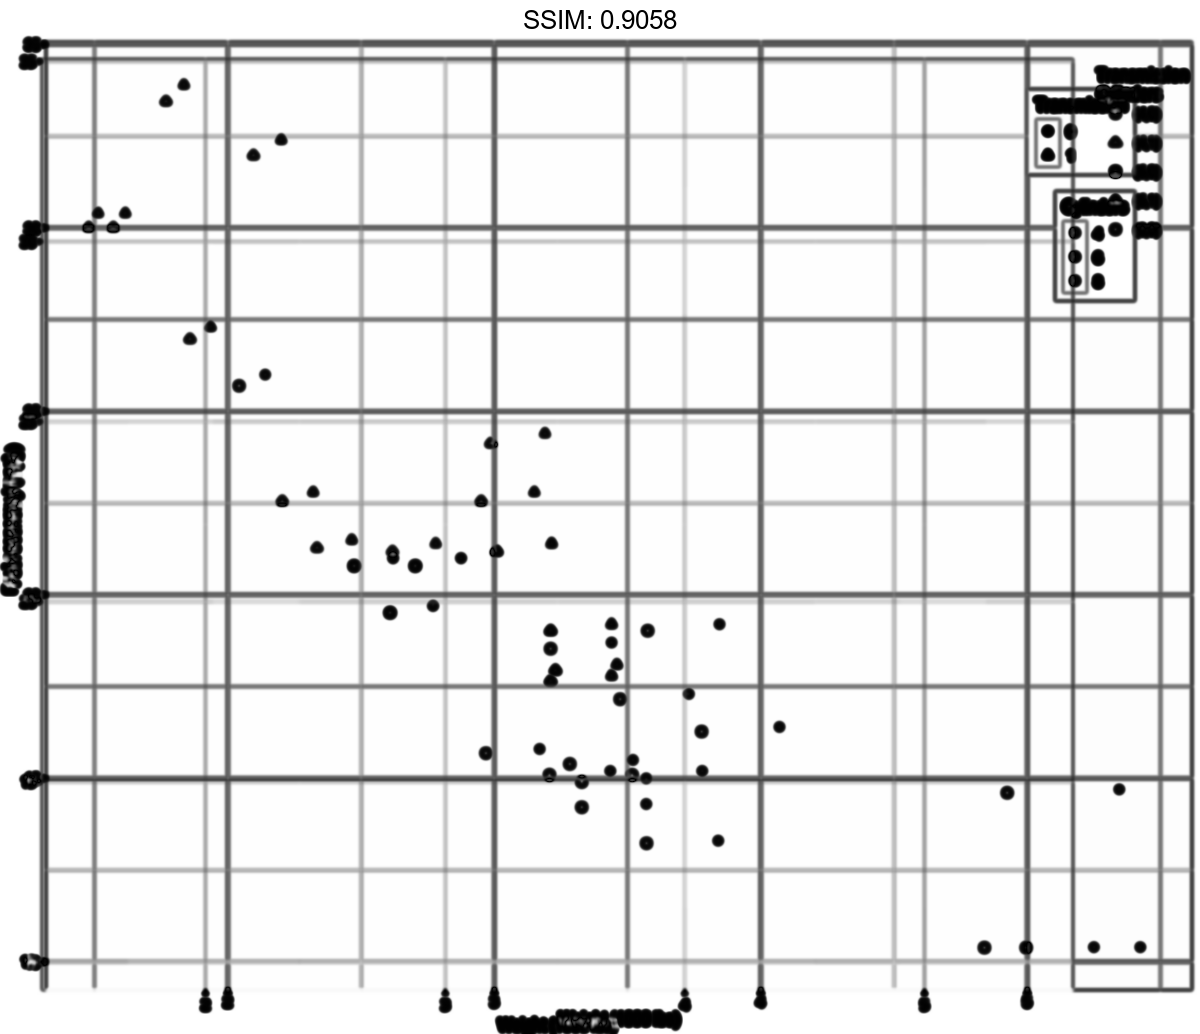
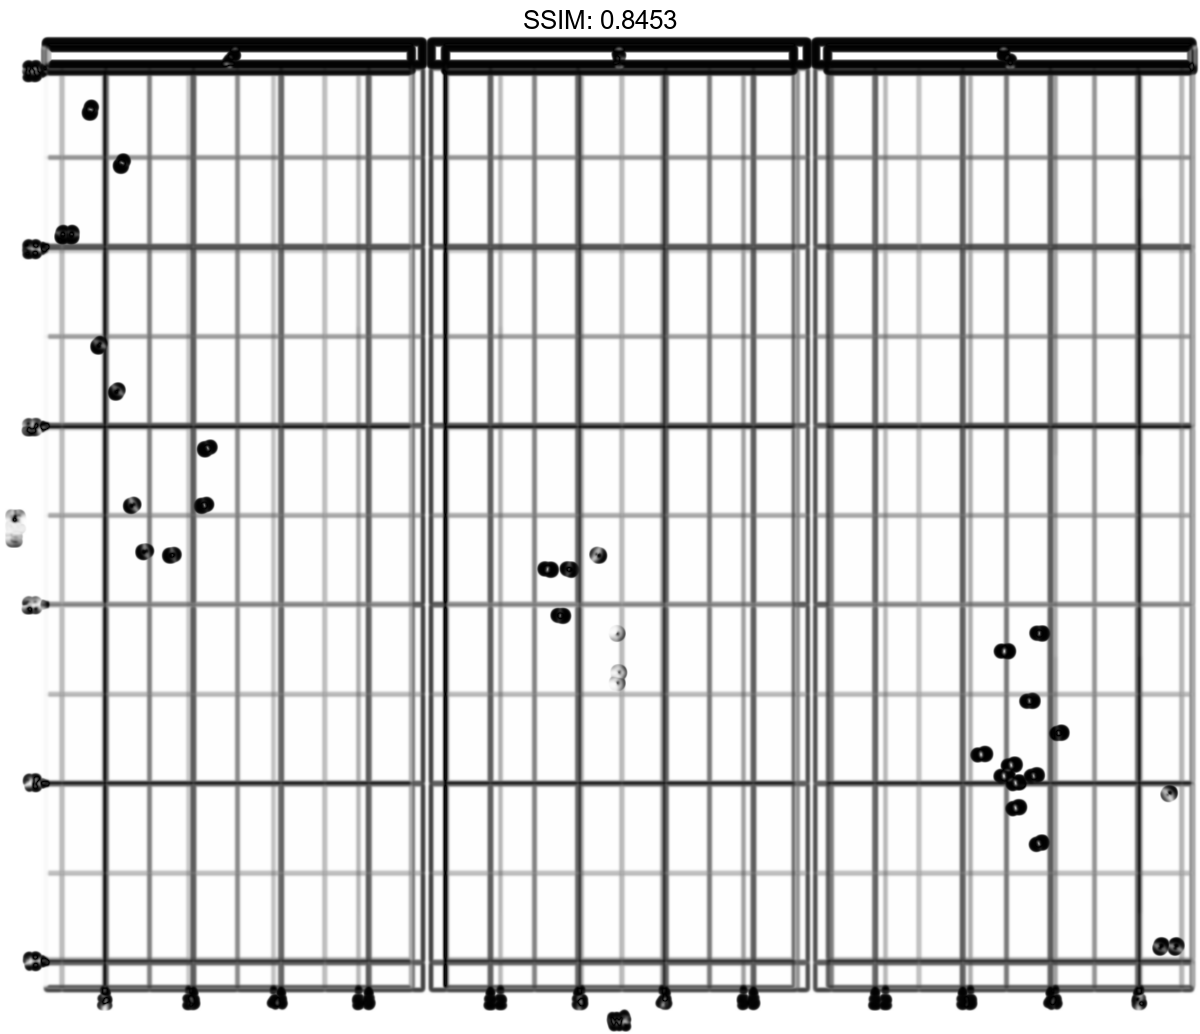
p1 <- ggplot(mtcars, aes(wt, mpg)) +
  geom_point() +
  labs(title = "Fuel economy declines as weight increases")
p <-  p1 + theme(panel.grid.major = element_line(colour = "black"))
plotly::ggplotly(p)
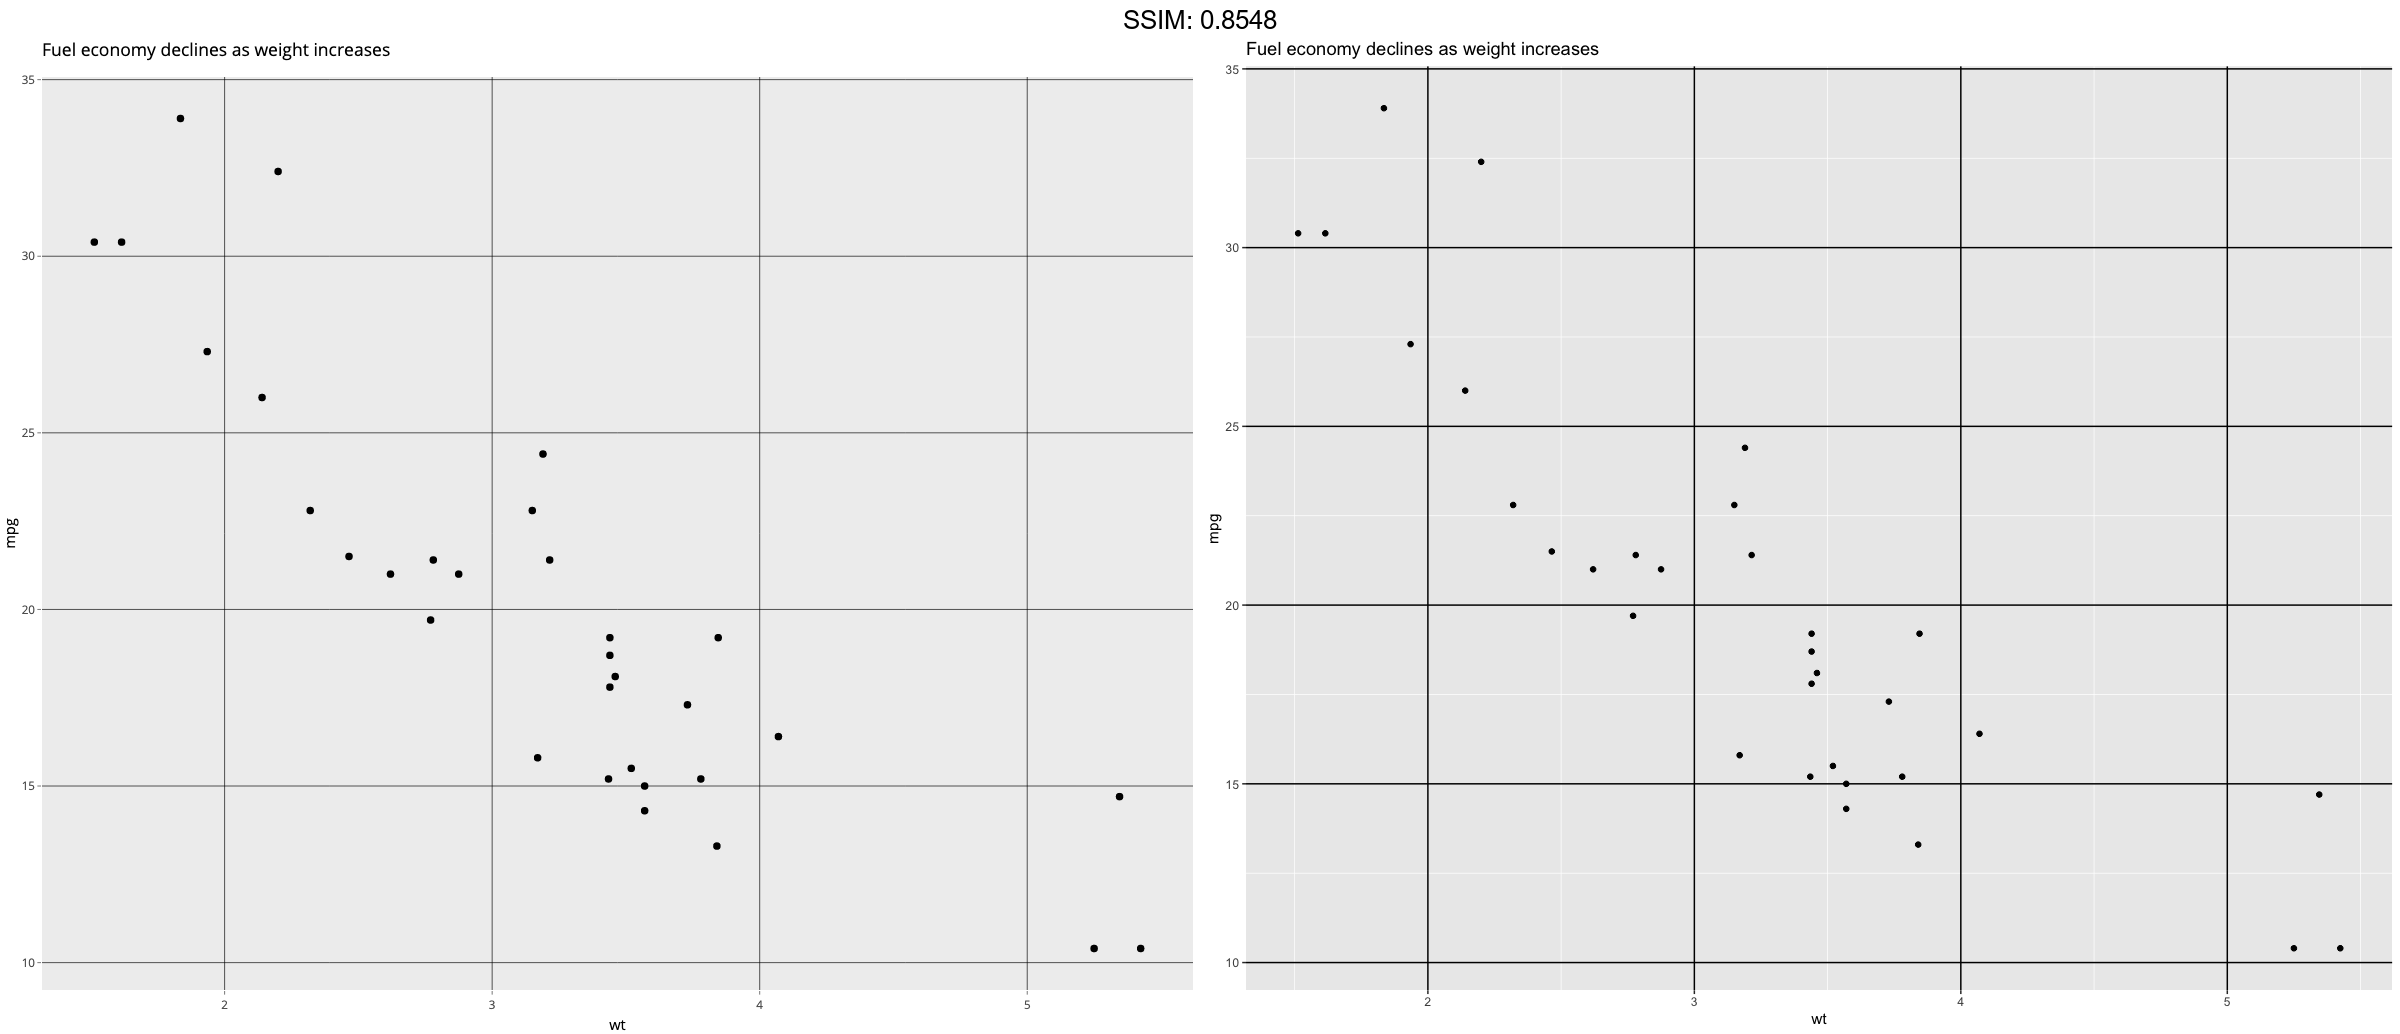
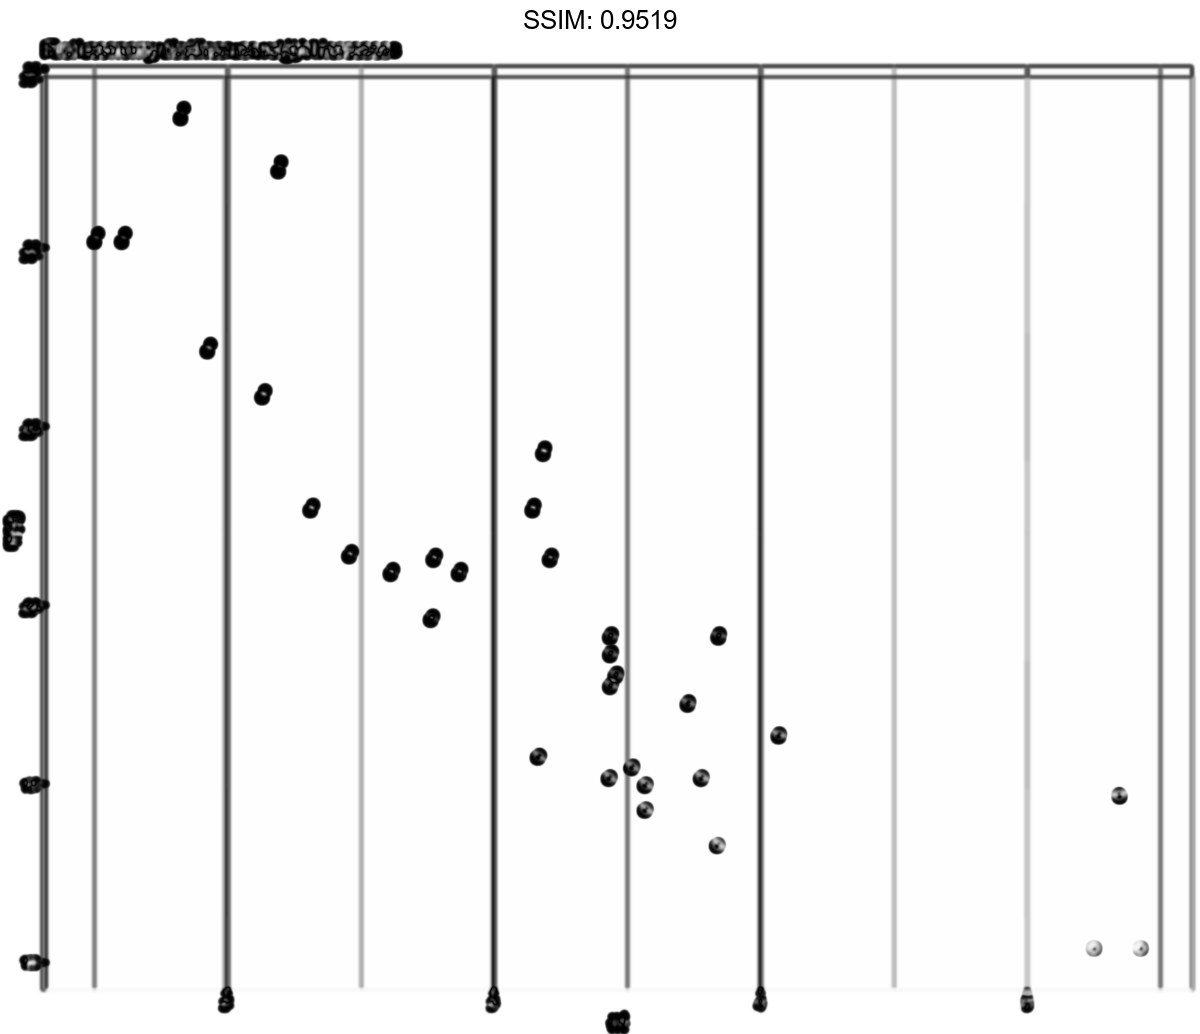
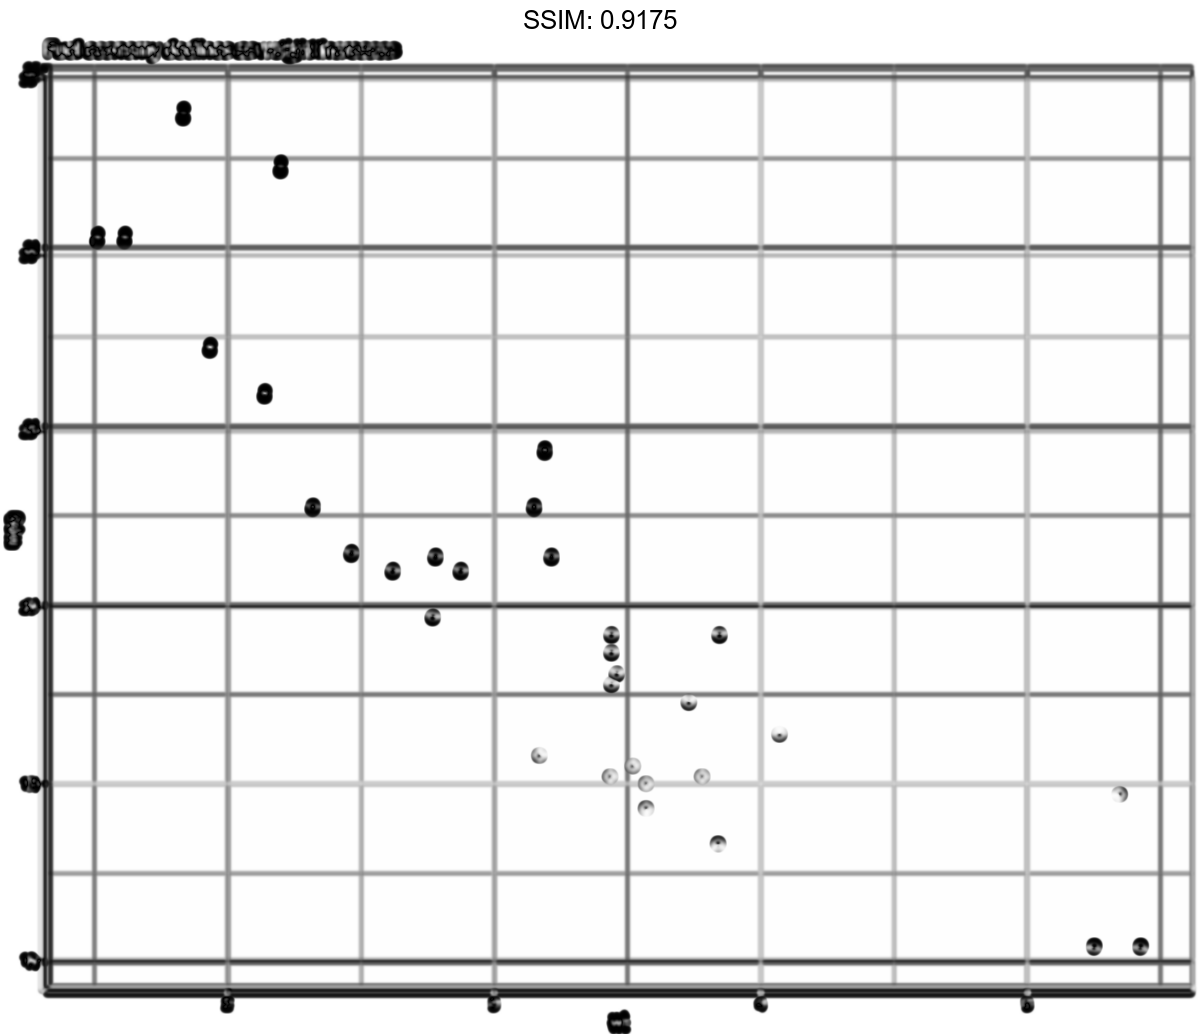
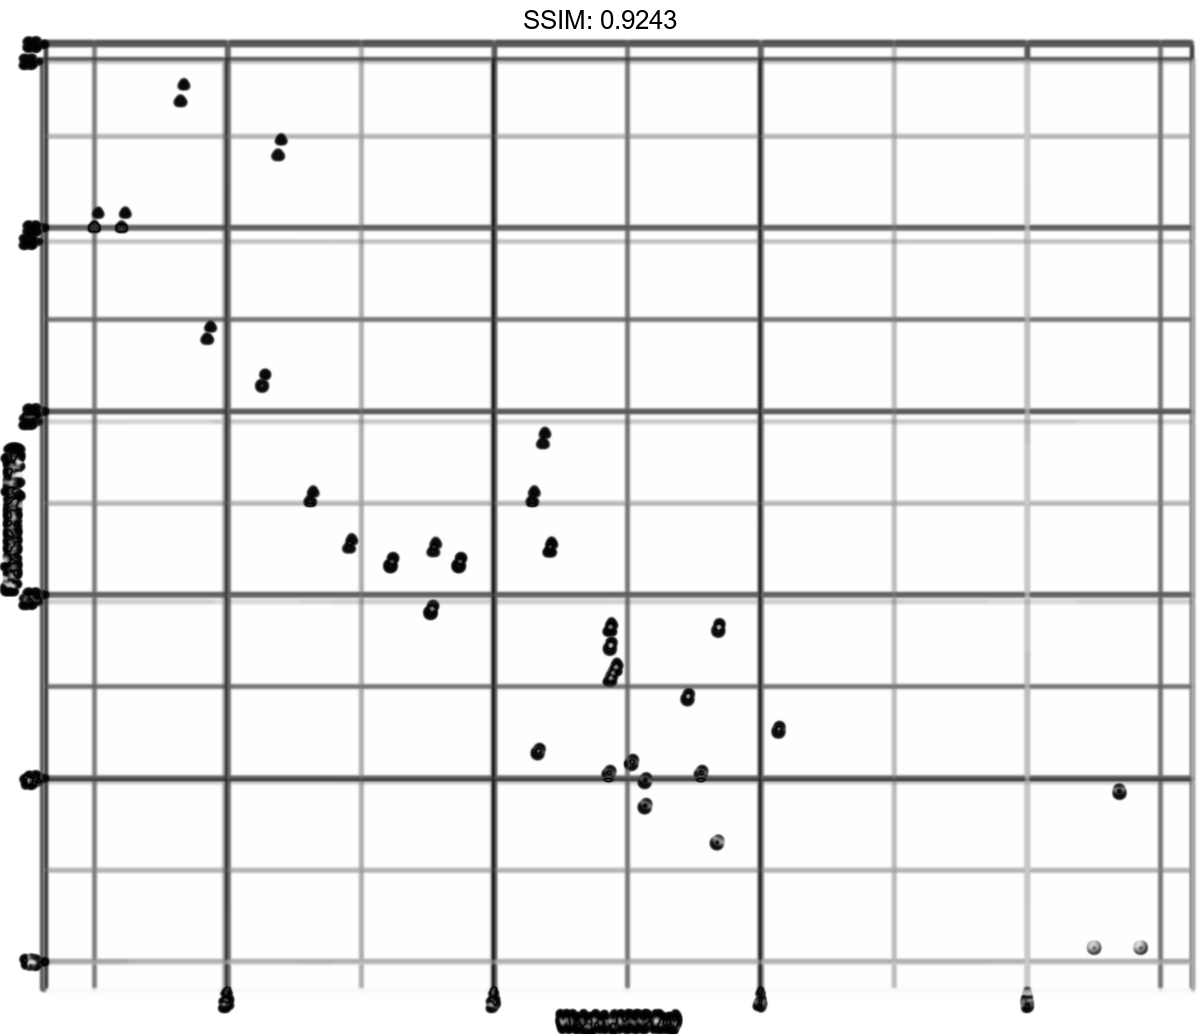
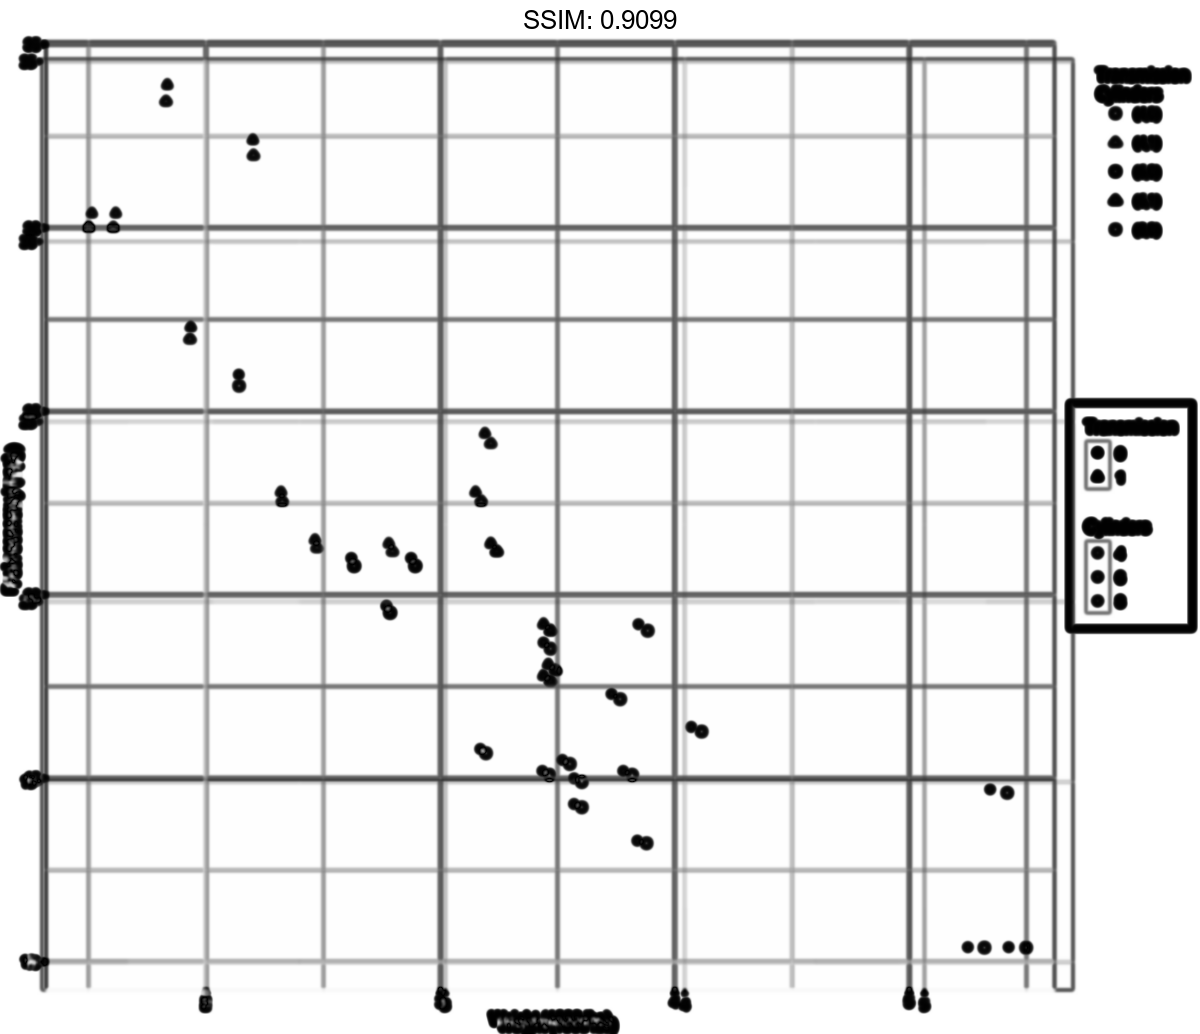
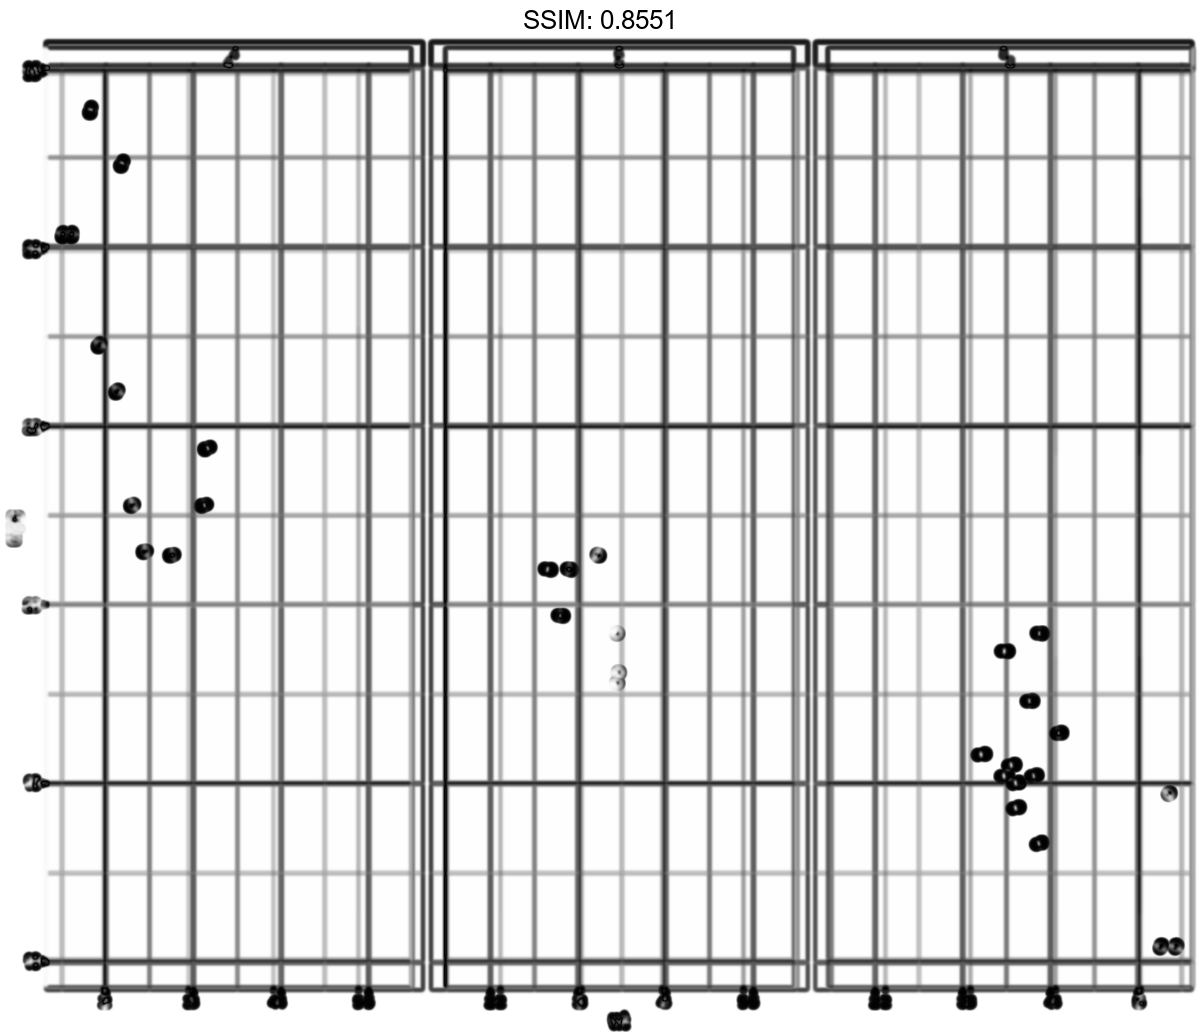
p1 <- ggplot(mtcars, aes(wt, mpg)) +
  geom_point() +
  labs(title = "Fuel economy declines as weight increases")
p <-
 p1 + theme(
  panel.grid.major.y = element_blank(),
  panel.grid.minor.y = element_blank()
)
plotly::ggplotly(p)
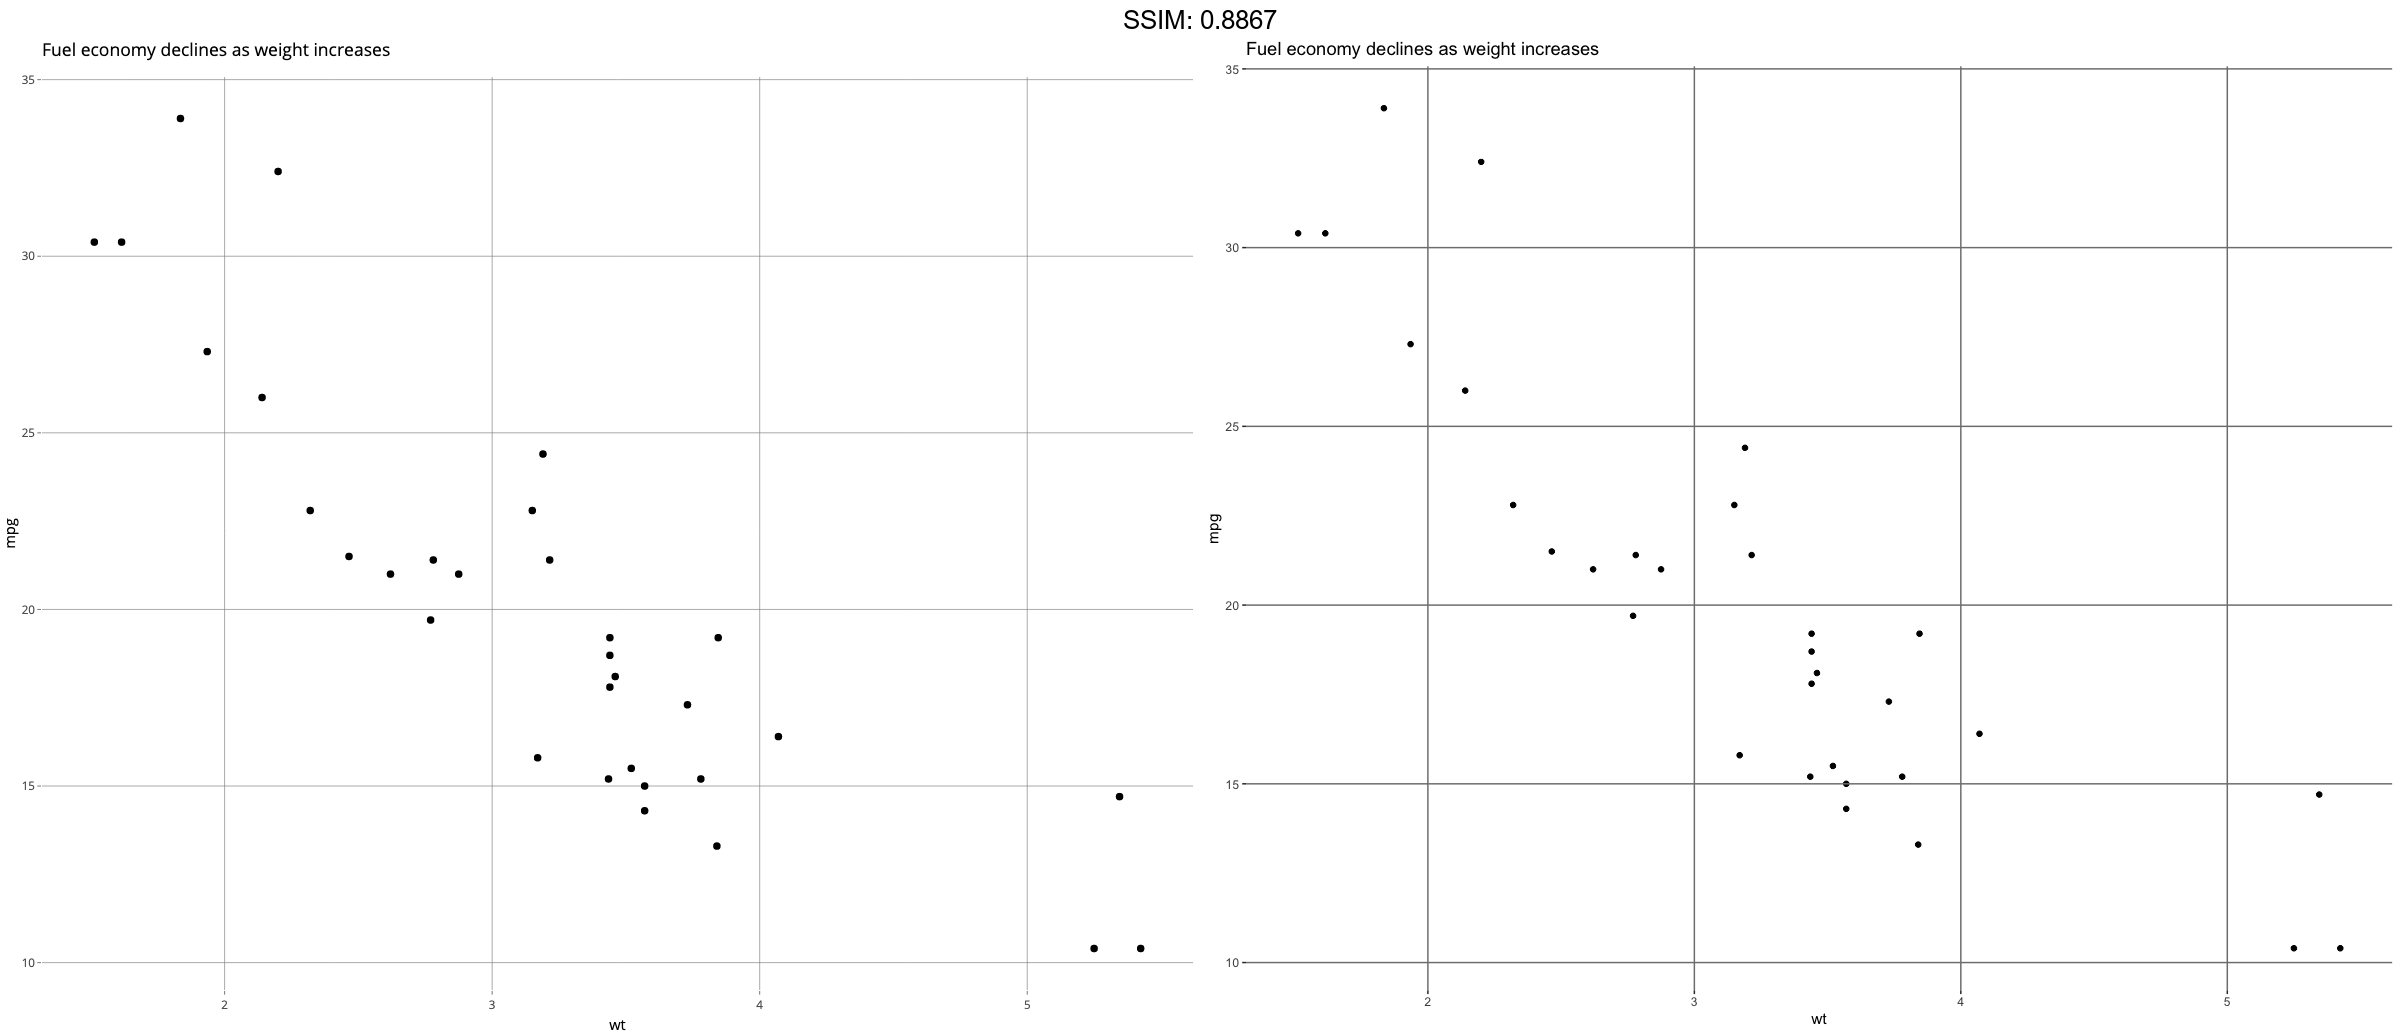
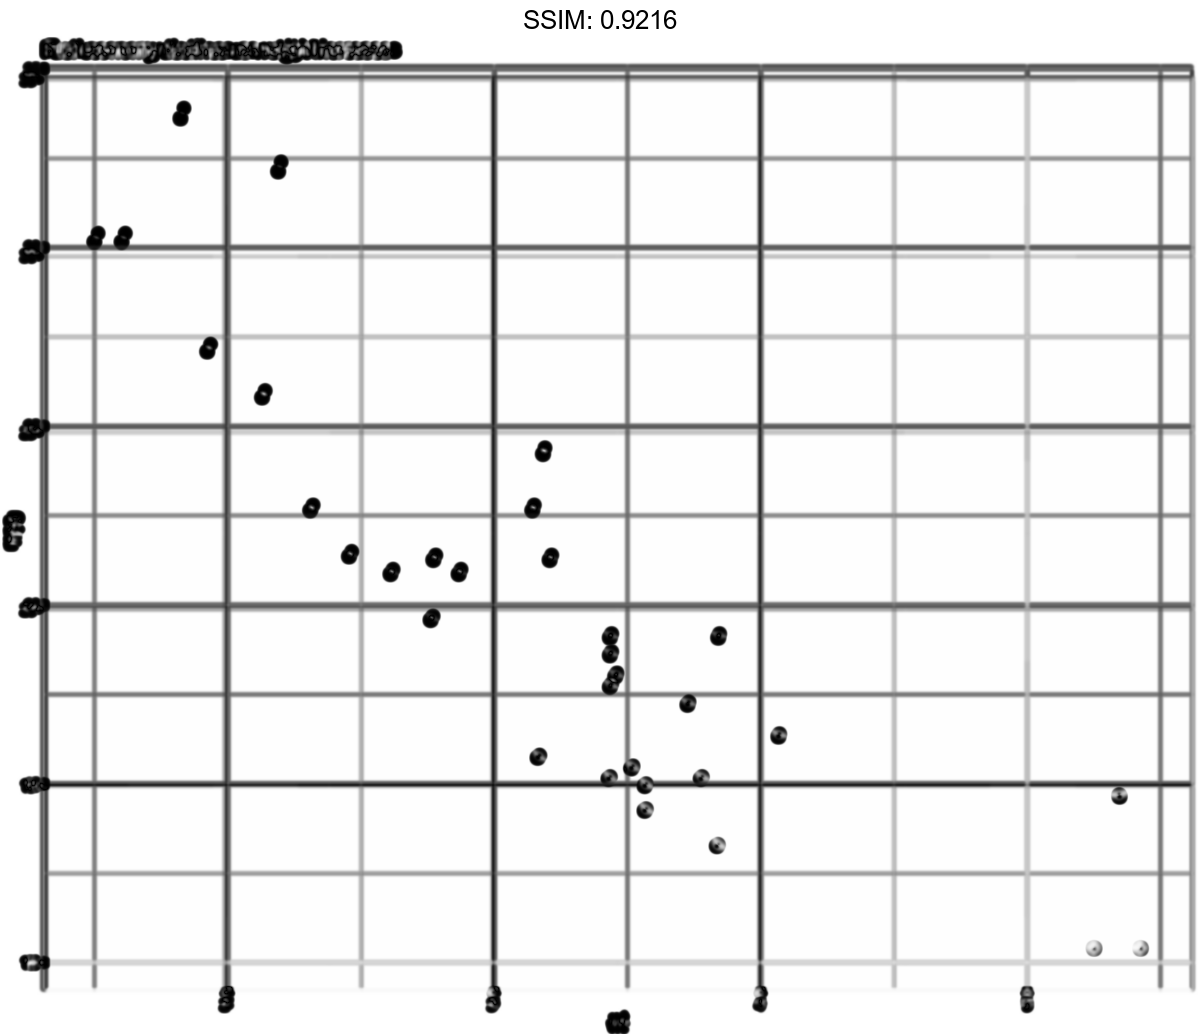
p1 <- ggplot(mtcars, aes(wt, mpg)) +
  geom_point() +
  labs(title = "Fuel economy declines as weight increases")
p <-
 p1 + theme(
  panel.background = element_rect(fill = NA),
  panel.grid.major = element_line(colour = "grey50"),
  panel.ontop = TRUE
)
plotly::ggplotly(p)
p1 <- ggplot(mtcars, aes(wt, mpg)) +
  geom_point() +
  labs(title = "Fuel economy declines as weight increases")
p <-  p1 + theme(axis.line = element_line(size = 3, colour = "grey80"))
plotly::ggplotly(p)
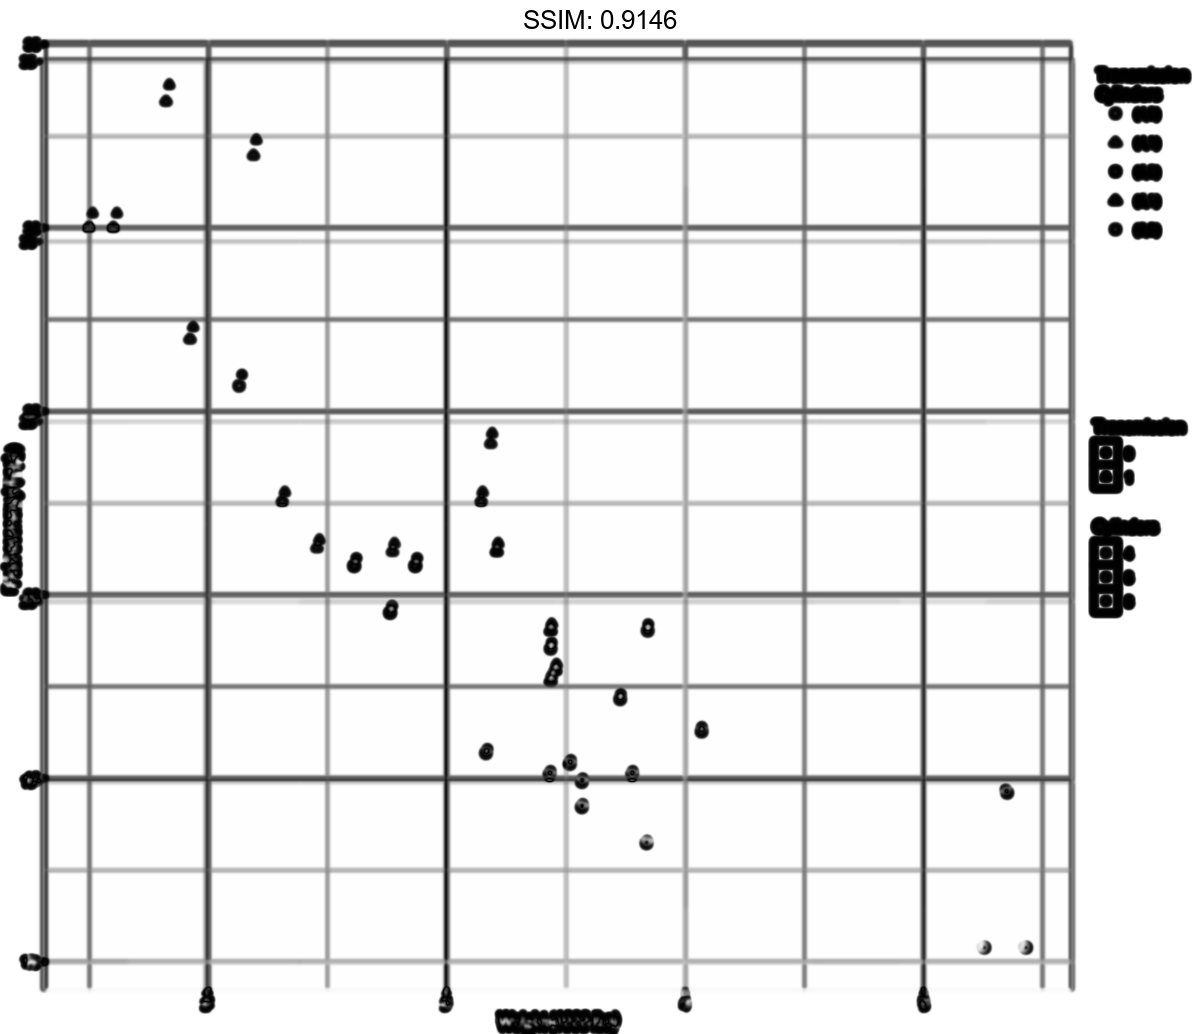
p1 <- ggplot(mtcars, aes(wt, mpg)) +
  geom_point() +
  labs(title = "Fuel economy declines as weight increases")
p <-  p1 + theme(axis.text = element_text(colour = "blue"))
plotly::ggplotly(p)


p1 <- ggplot(mtcars, aes(wt, mpg)) +
  geom_point() +
  labs(title = "Fuel economy declines as weight increases")
p <-  p1 + theme(axis.ticks = element_line(size = 2))
plotly::ggplotly(p)

p1 <- ggplot(mtcars, aes(wt, mpg)) +
  geom_point() +
  labs(title = "Fuel economy declines as weight increases")
p <-  p1 + theme(axis.title.y = element_text(size = rel(1.5), angle = 90))
plotly::ggplotly(p)
p1 <- ggplot(mtcars, aes(wt, mpg)) +
  geom_point() +
  labs(title = "Fuel economy declines as weight increases")
p <-
 p1 + theme(
  axis.ticks.length.y = unit(.25, "cm"),
  axis.ticks.length.x = unit(-.25, "cm"),
  axis.text.x = element_text(margin = margin(t = .3, unit = "cm"))
)
plotly::ggplotly(p)
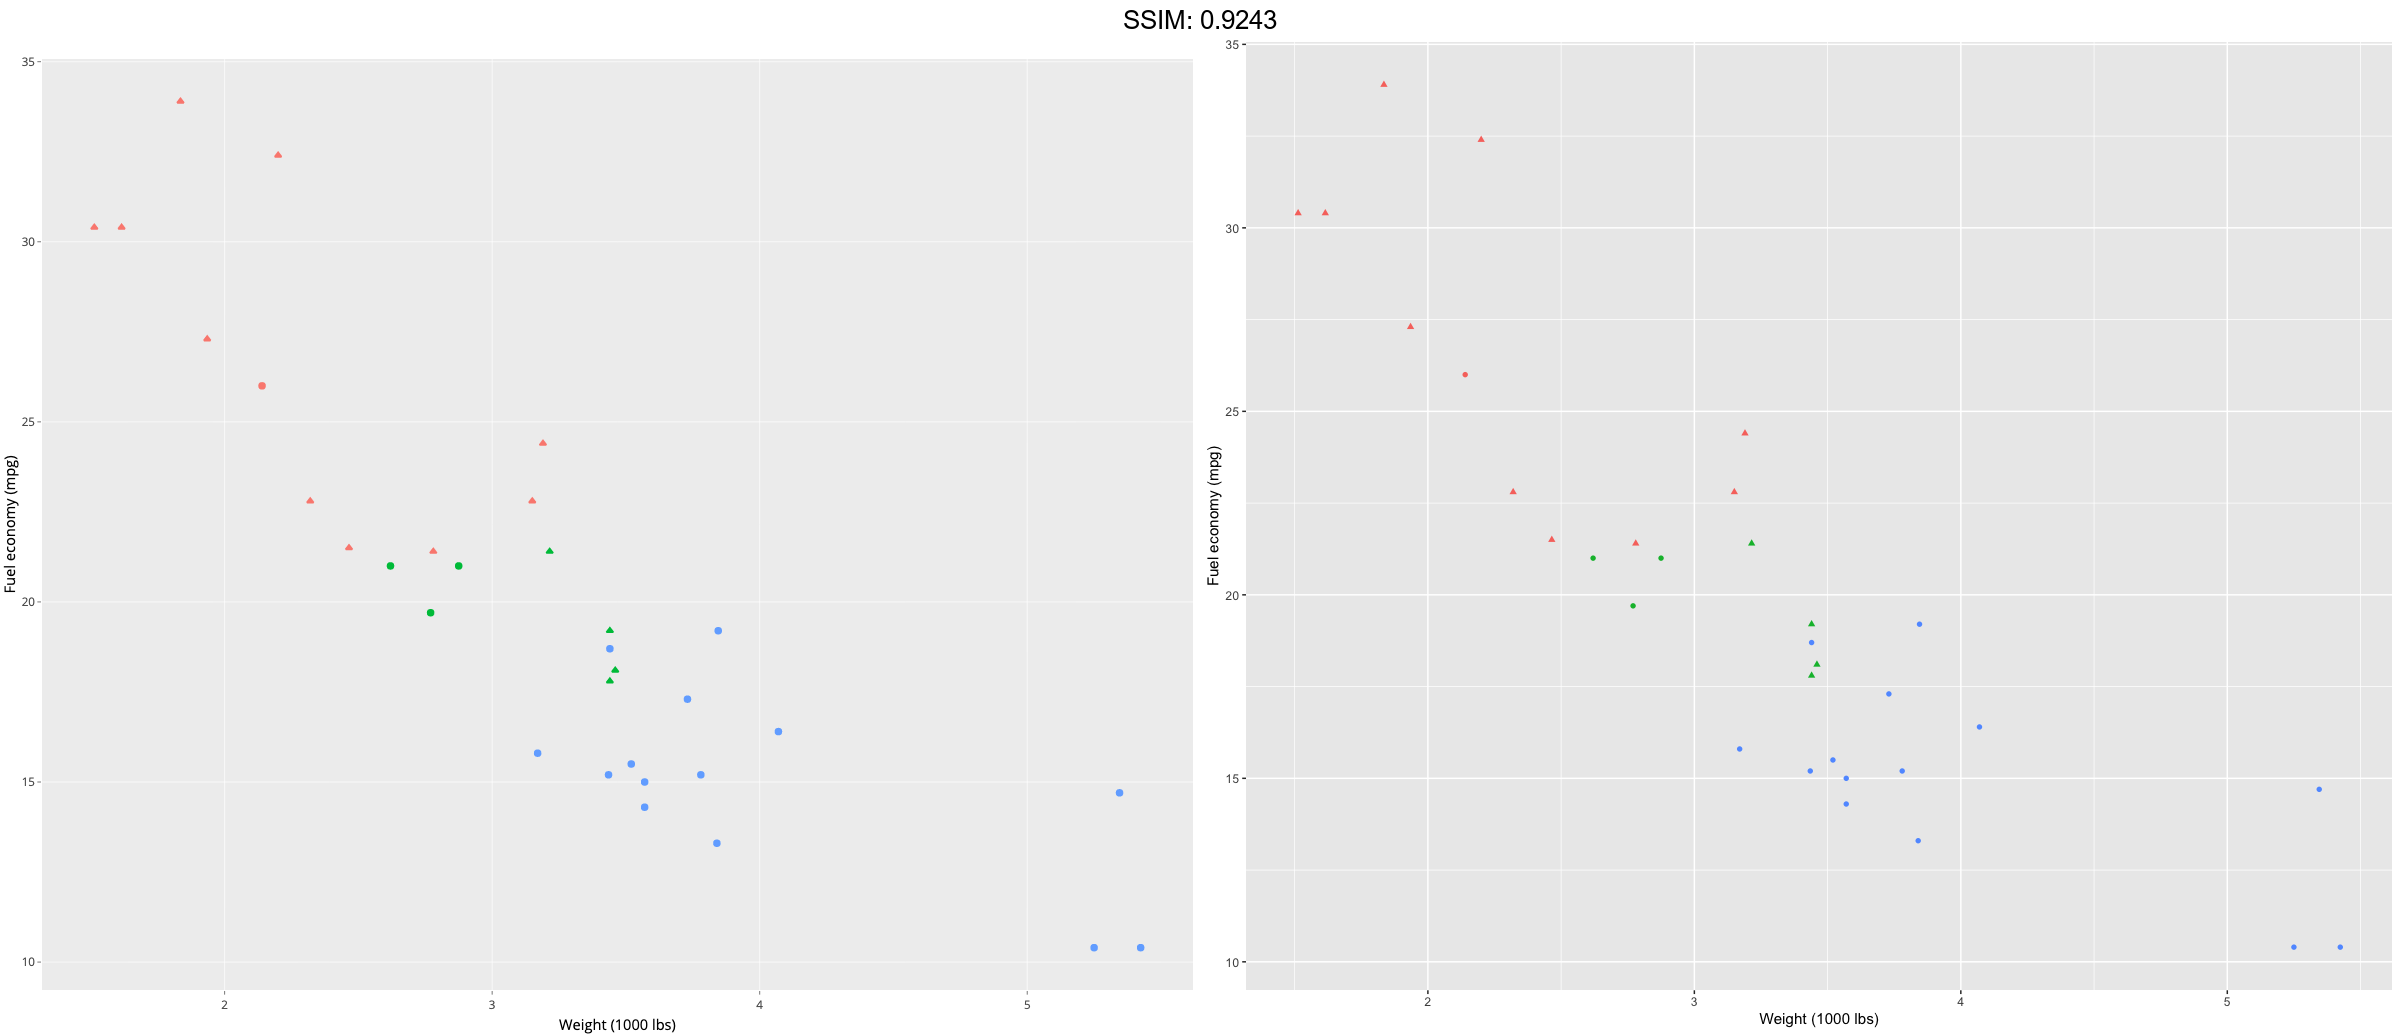
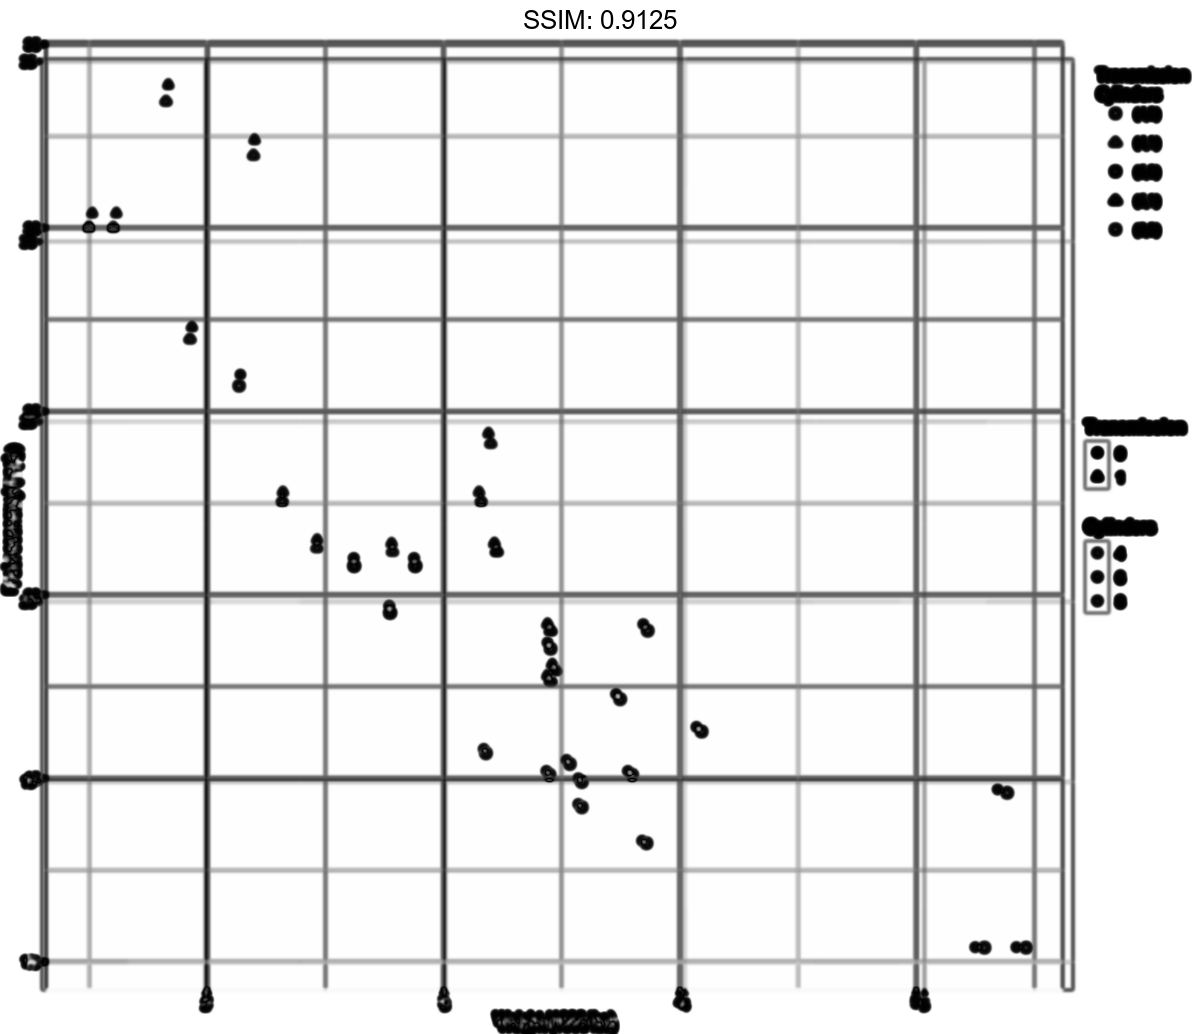
p2 <- ggplot(mtcars, aes(wt, mpg)) +
  geom_point(aes(colour = factor(cyl), shape = factor(vs))) +
  labs(
    x = "Weight (1000 lbs)",
    y = "Fuel economy (mpg)",
    colour = "Cylinders",
    shape = "Transmission"
   )
plotly::ggplotly(p2)

p2 <- ggplot(mtcars, aes(wt, mpg)) +
  geom_point(aes(colour = factor(cyl), shape = factor(vs))) +
  labs(
    x = "Weight (1000 lbs)",
    y = "Fuel economy (mpg)",
    colour = "Cylinders",
    shape = "Transmission"
   )
p <-  p2 + theme(legend.position = "none")
plotly::ggplotly(p)
p2 <- ggplot(mtcars, aes(wt, mpg)) +
  geom_point(aes(colour = factor(cyl), shape = factor(vs))) +
  labs(
    x = "Weight (1000 lbs)",
    y = "Fuel economy (mpg)",
    colour = "Cylinders",
    shape = "Transmission"
   )
p <-  p2 + theme(legend.justification = "top")
plotly::ggplotly(p)
p2 <- ggplot(mtcars, aes(wt, mpg)) +
  geom_point(aes(colour = factor(cyl), shape = factor(vs))) +
  labs(
    x = "Weight (1000 lbs)",
    y = "Fuel economy (mpg)",
    colour = "Cylinders",
    shape = "Transmission"
   )
p <-  p2 + theme(legend.position = "bottom")
plotly::ggplotly(p)
p2 <- ggplot(mtcars, aes(wt, mpg)) +
  geom_point(aes(colour = factor(cyl), shape = factor(vs))) +
  labs(
    x = "Weight (1000 lbs)",
    y = "Fuel economy (mpg)",
    colour = "Cylinders",
    shape = "Transmission"
   )
p <-
 p2 + theme(
  legend.position = c(.95, .95),
  legend.justification = c("right", "top"),
  legend.box.just = "right",
  legend.margin = margin(6, 6, 6, 6)
)
plotly::ggplotly(p)
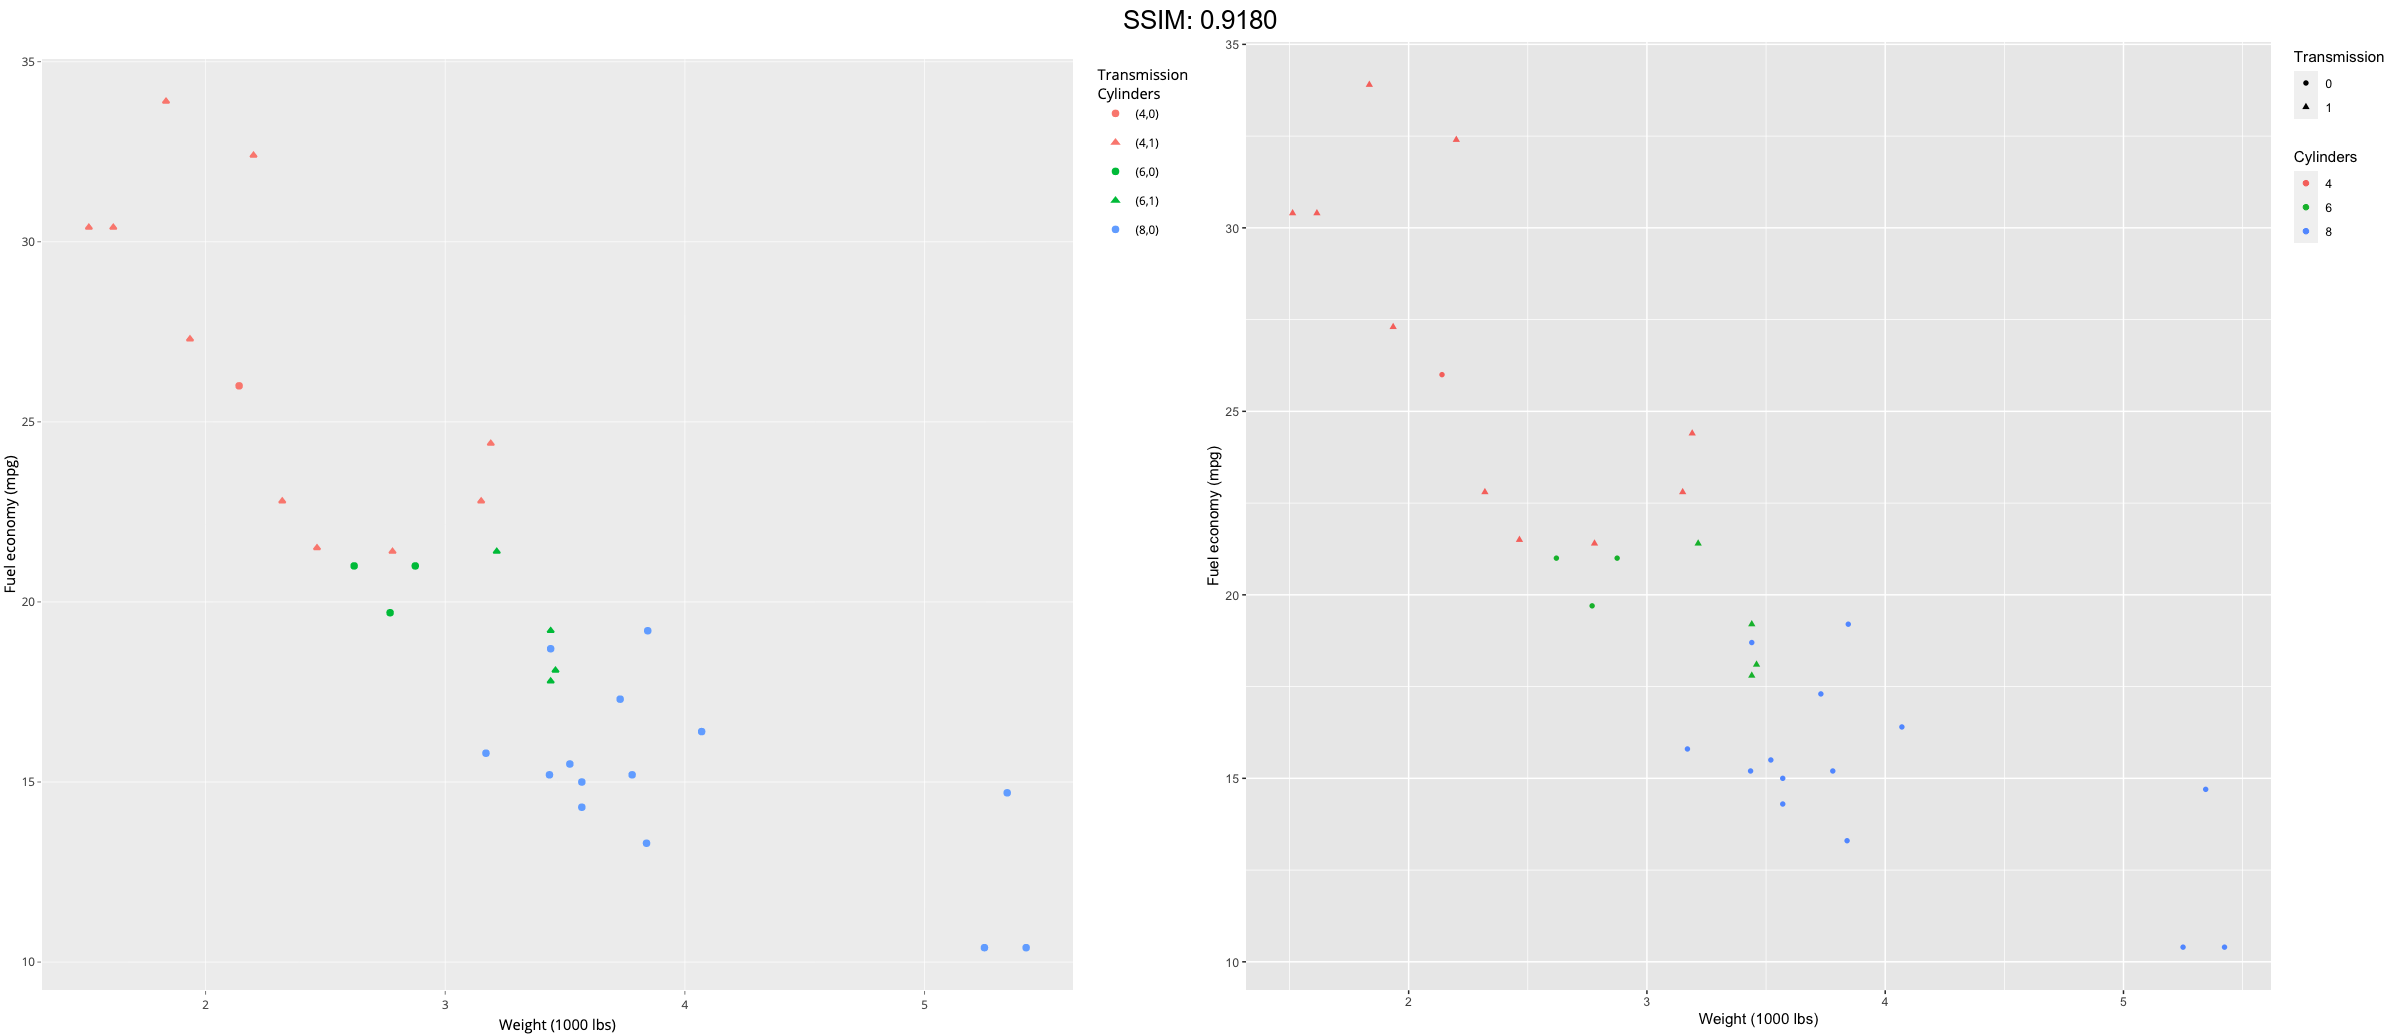
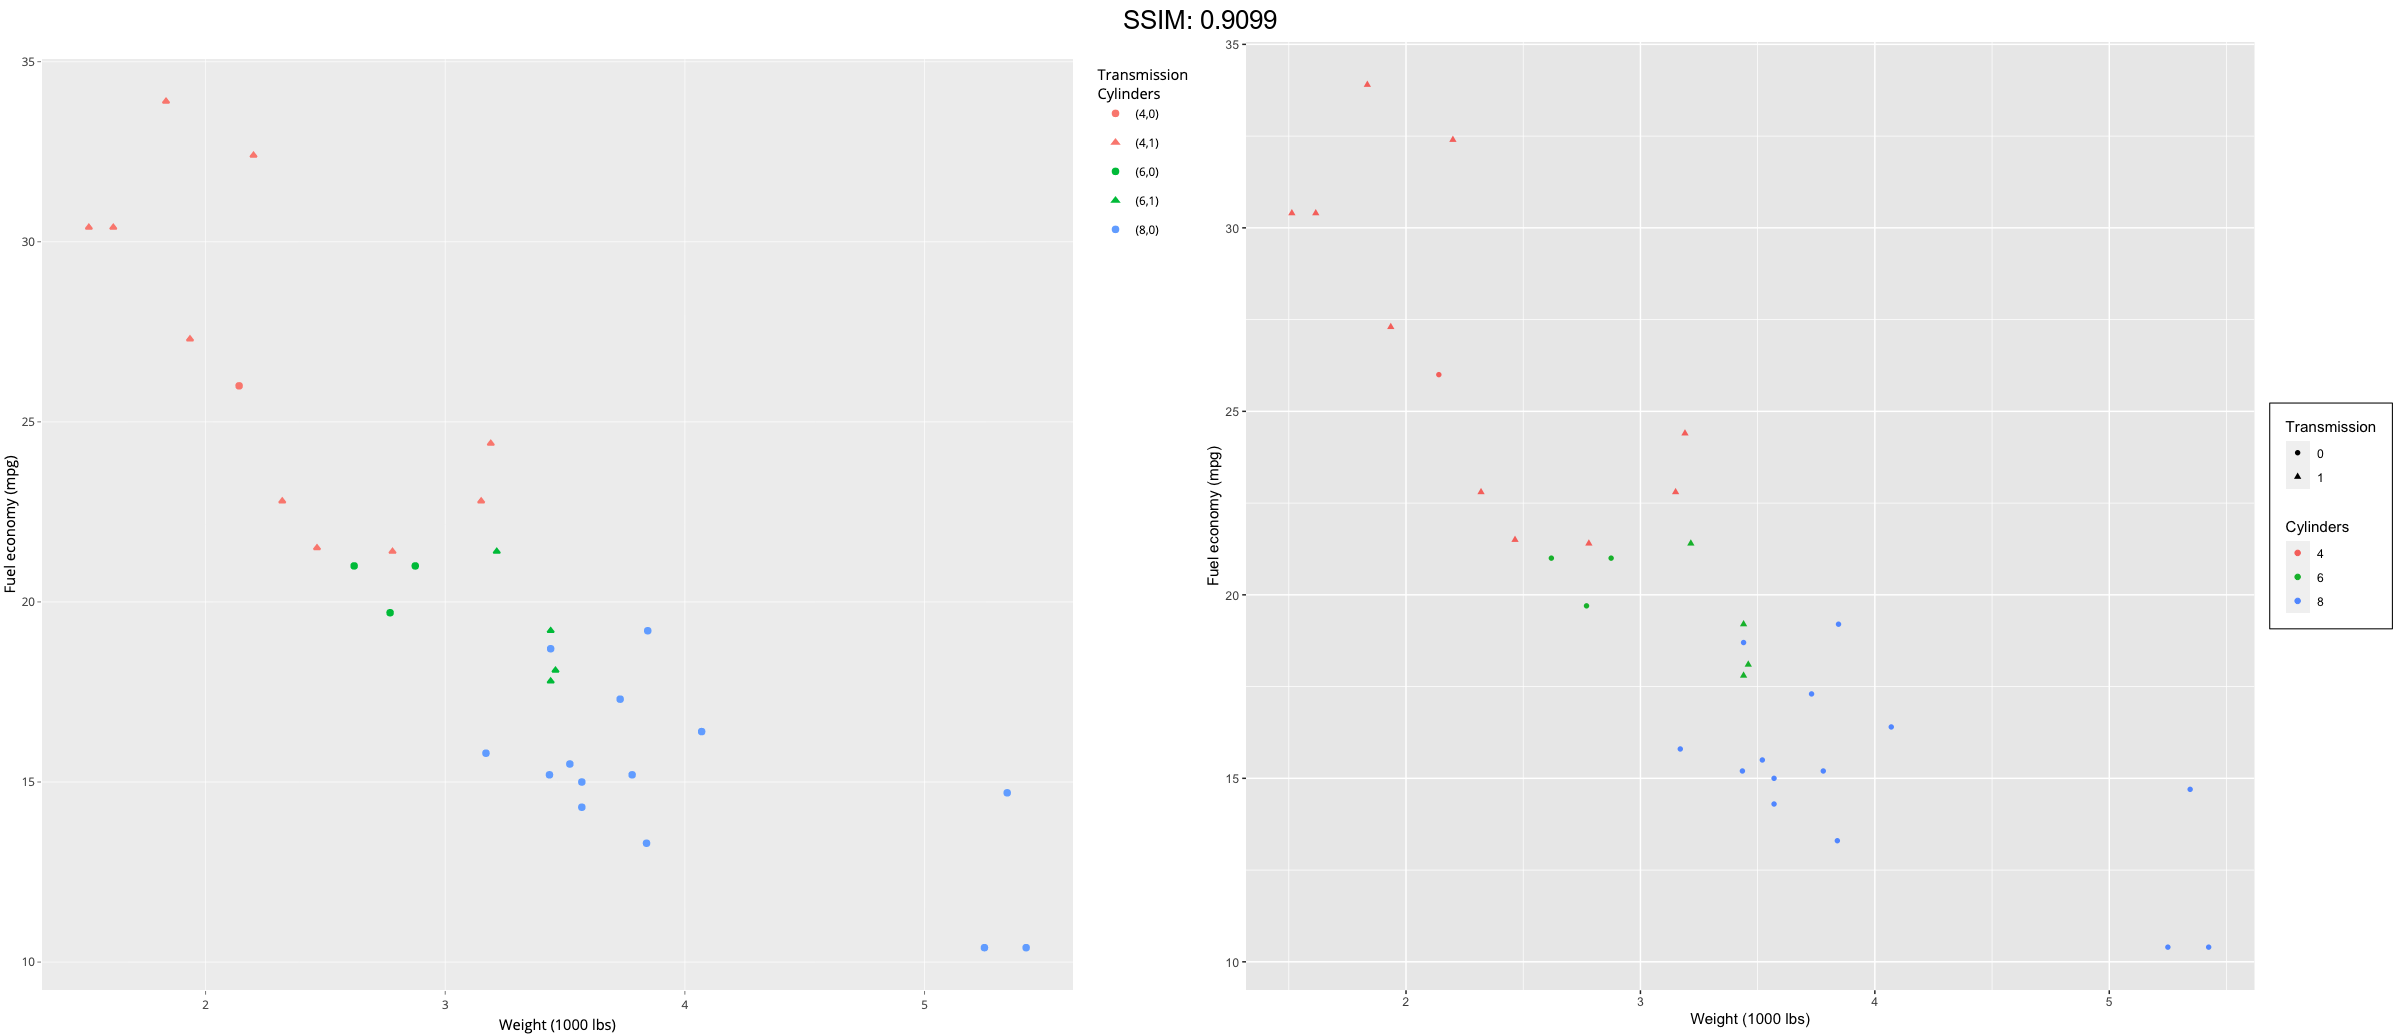
p2 <- ggplot(mtcars, aes(wt, mpg)) +
  geom_point(aes(colour = factor(cyl), shape = factor(vs))) +
  labs(
    x = "Weight (1000 lbs)",
    y = "Fuel economy (mpg)",
    colour = "Cylinders",
    shape = "Transmission"
   )
p <-
 p2 + theme(
  legend.box.background = element_rect(),
  legend.box.margin = margin(6, 6, 6, 6)
)
plotly::ggplotly(p)
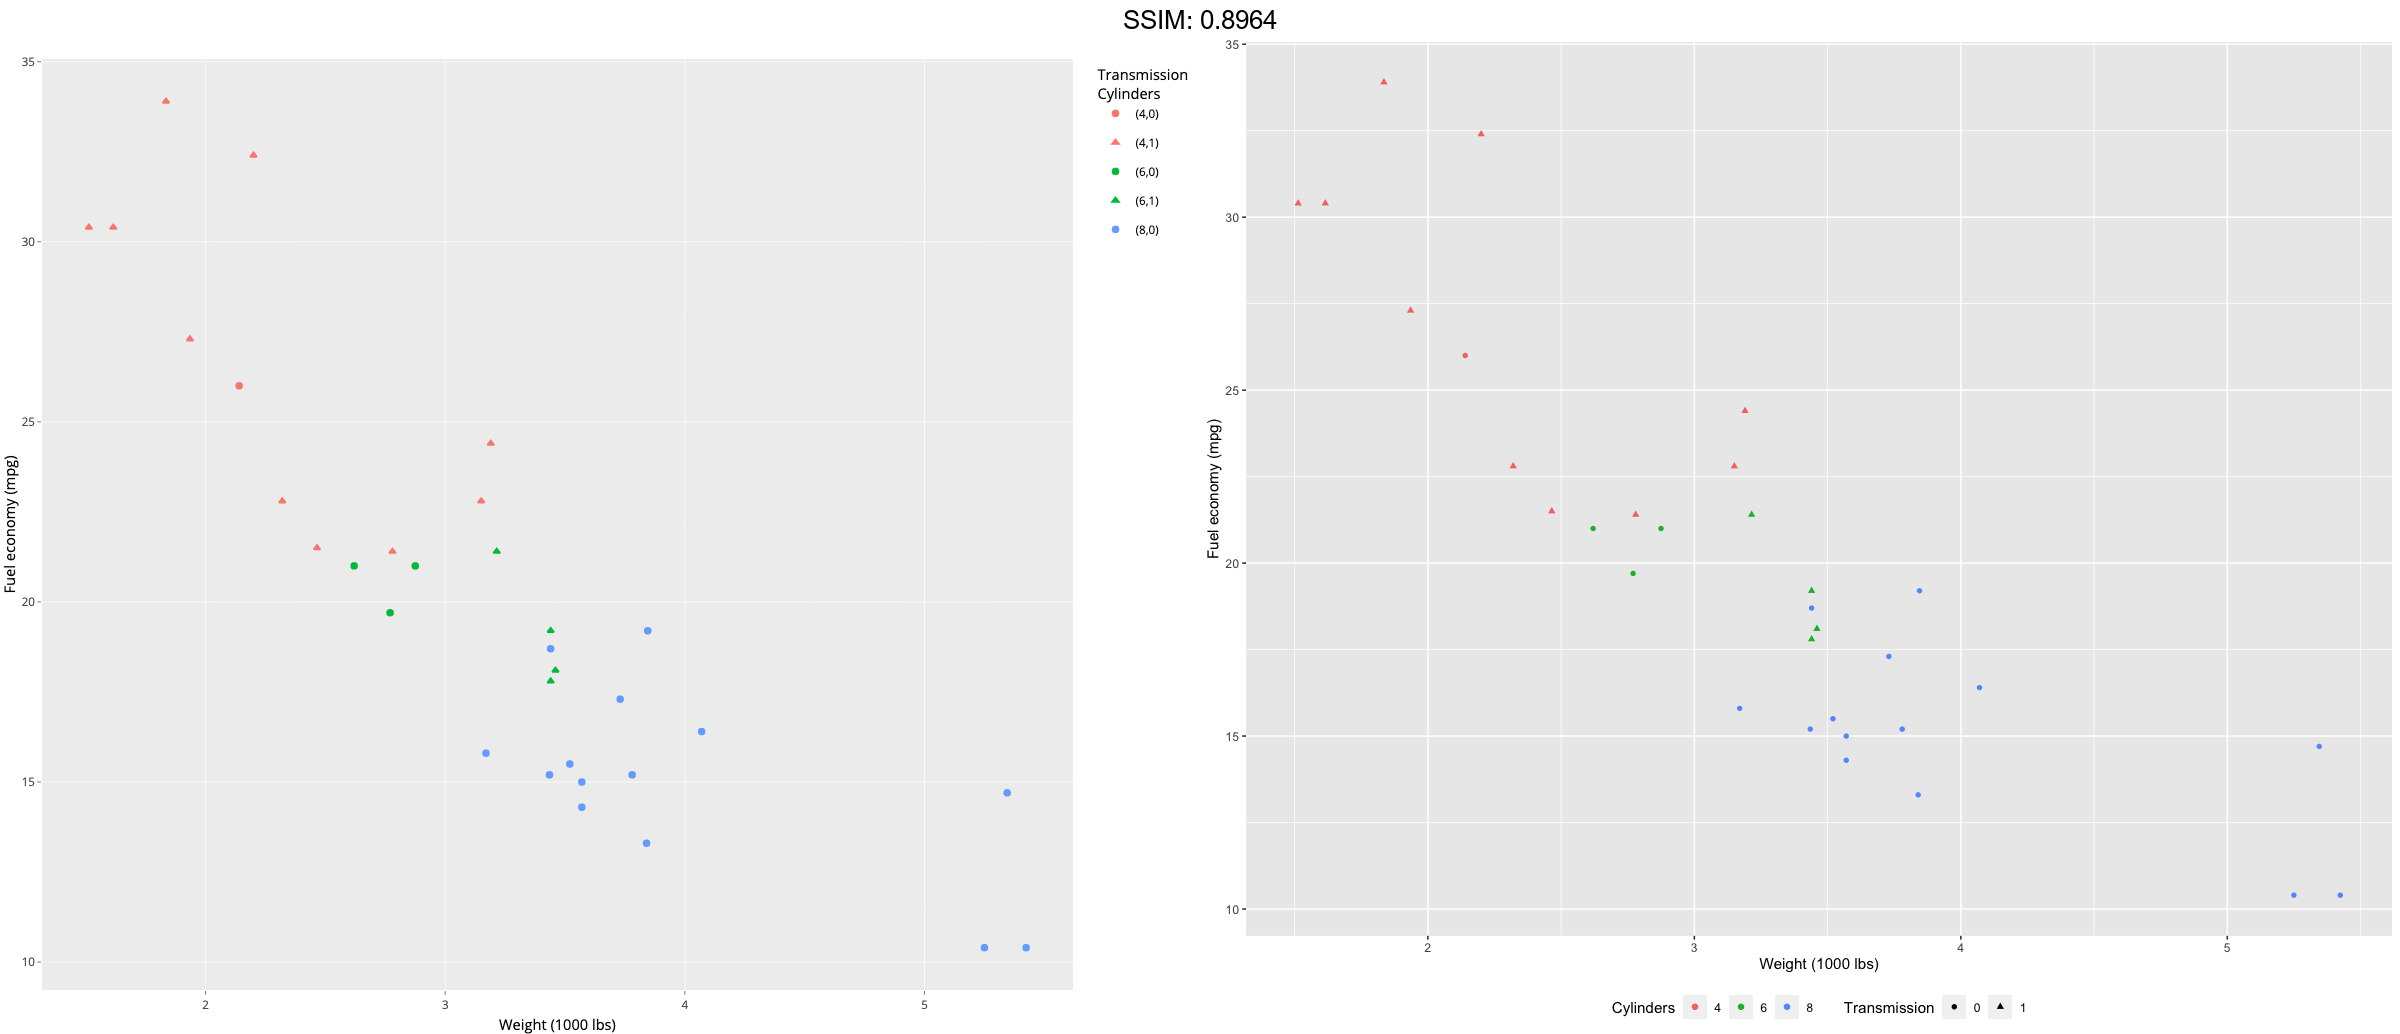
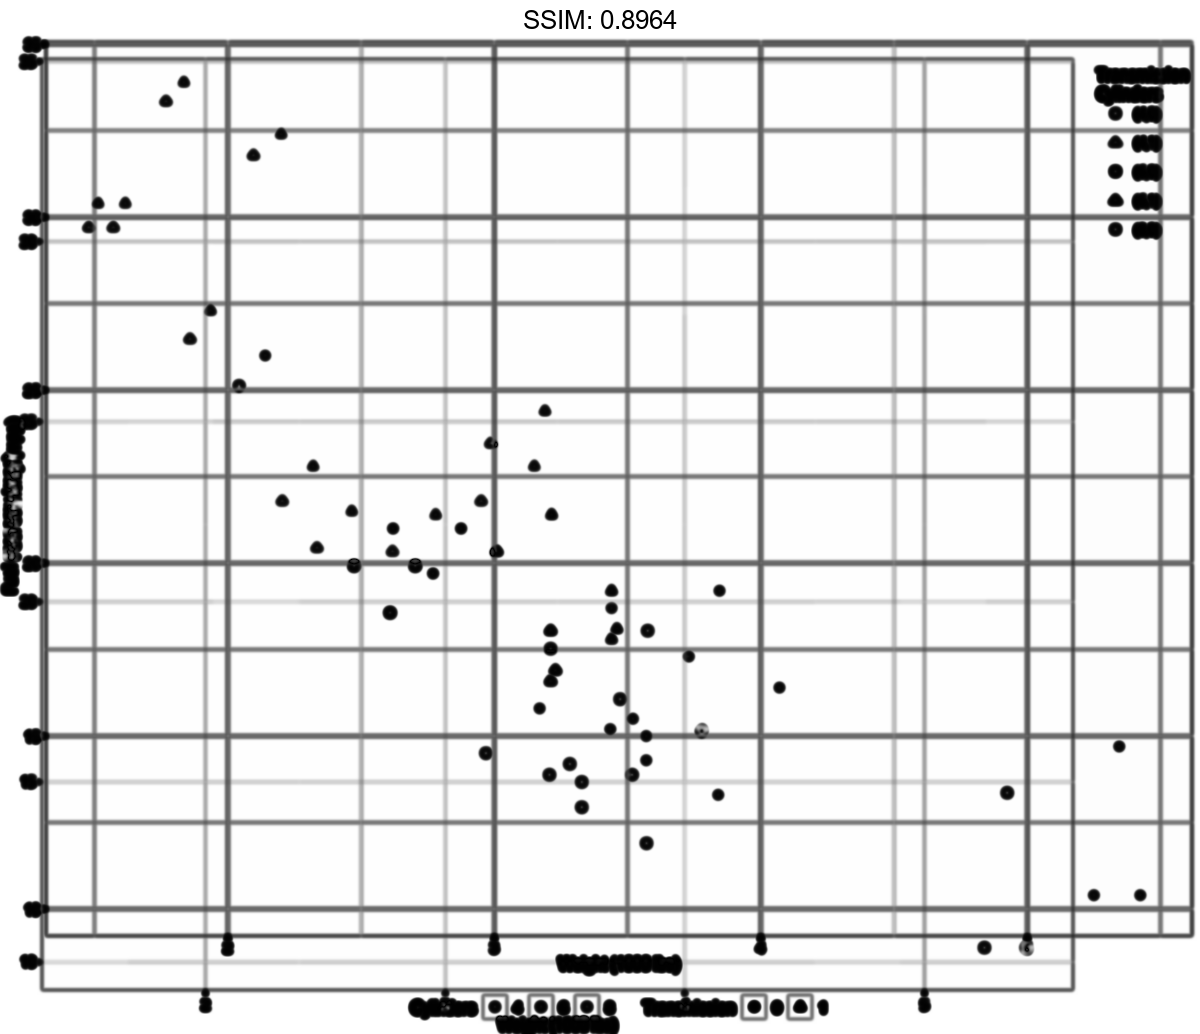
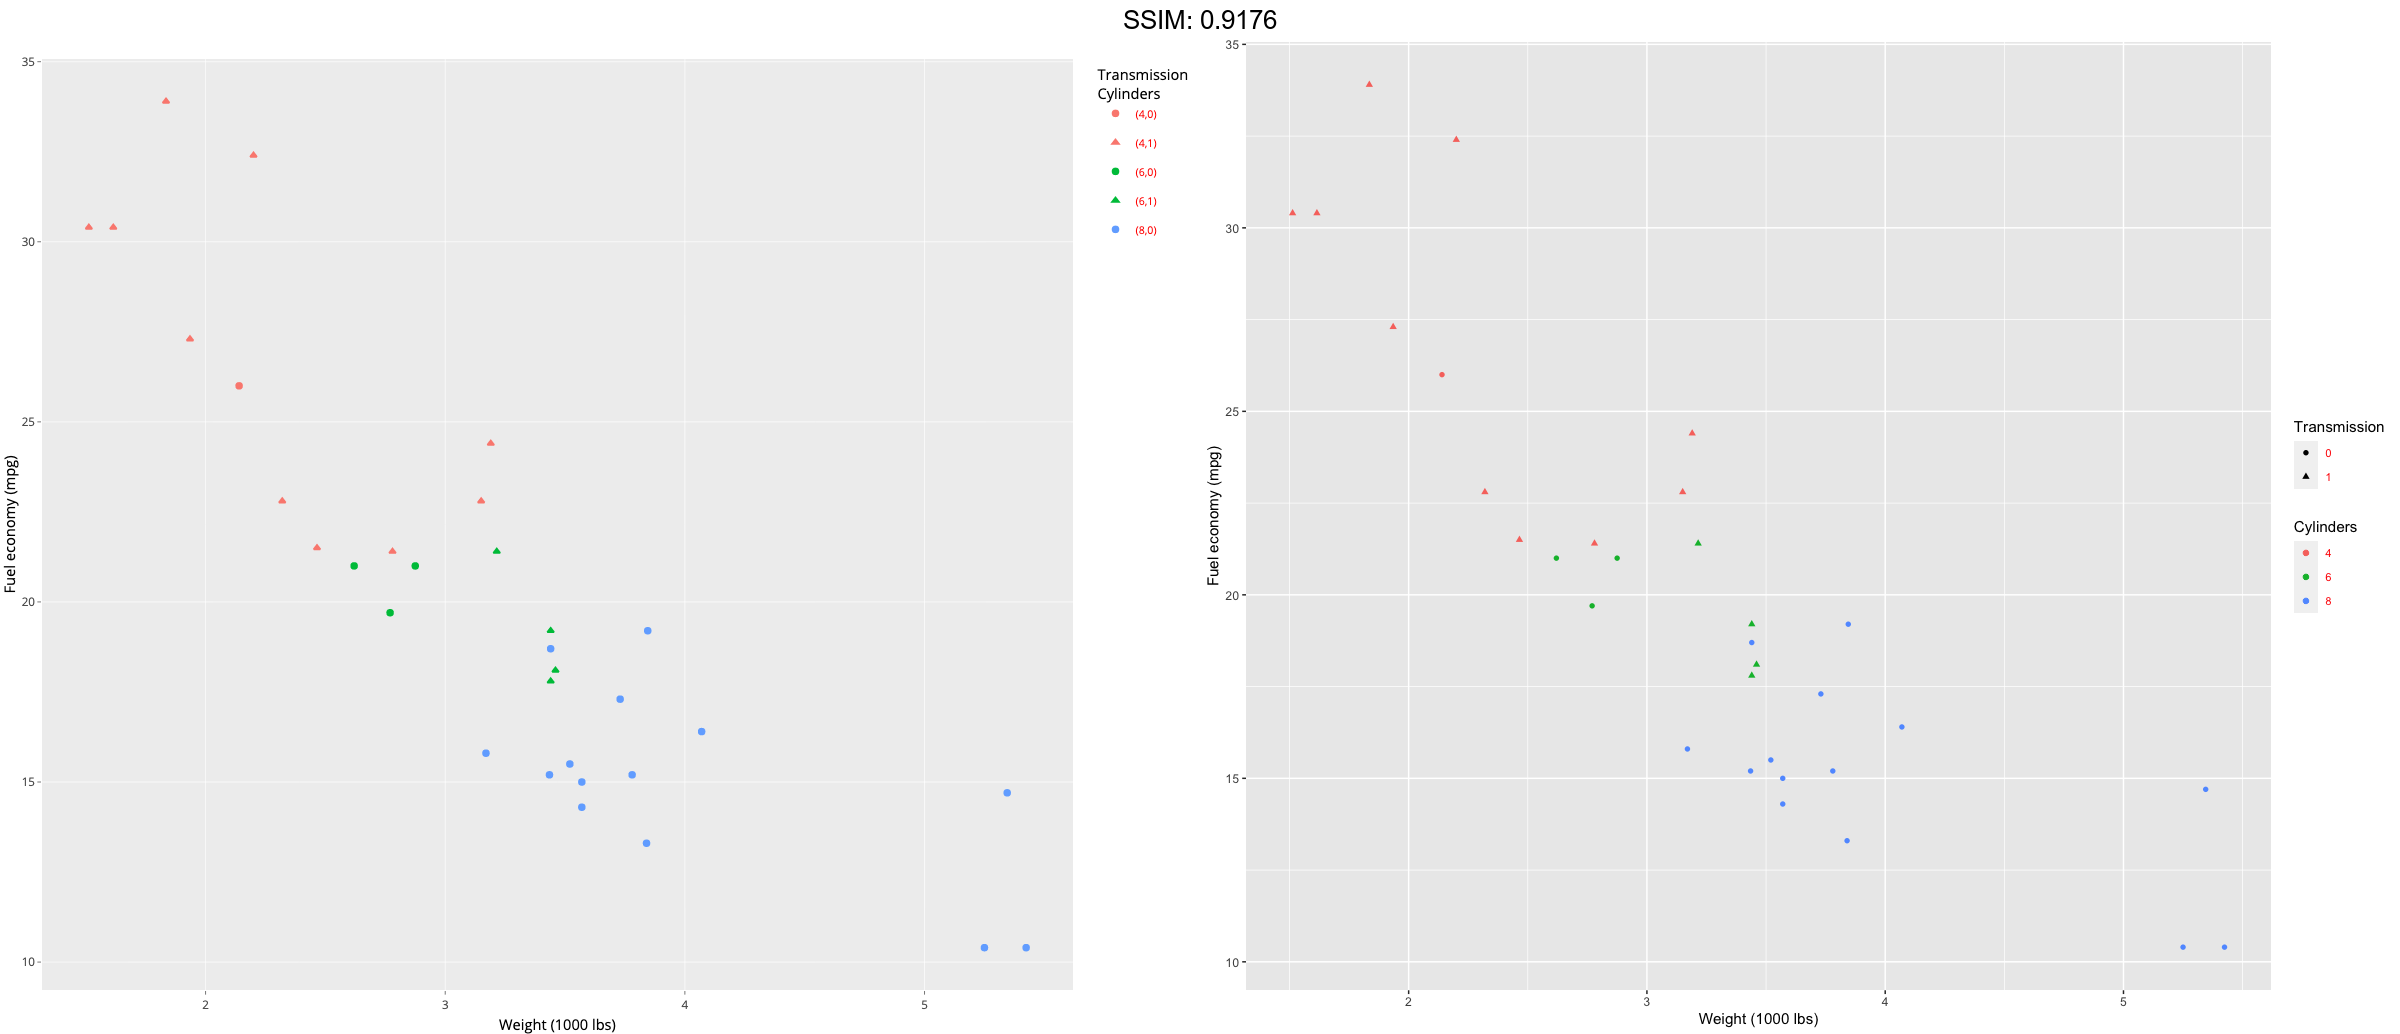
p2 <- ggplot(mtcars, aes(wt, mpg)) +
  geom_point(aes(colour = factor(cyl), shape = factor(vs))) +
  labs(
    x = "Weight (1000 lbs)",
    y = "Fuel economy (mpg)",
    colour = "Cylinders",
    shape = "Transmission"
   )
p <-  p2 + theme(legend.key = element_rect(fill = "white", colour = "black"))
plotly::ggplotly(p)
p2 <- ggplot(mtcars, aes(wt, mpg)) +
geom_point(aes(colour = factor(cyl), shape = factor(vs))) +
labs(
x = "Weight (1000 lbs)",
y = "Fuel economy (mpg)",
colour = "Cylinders",
shape = "Transmission"
)
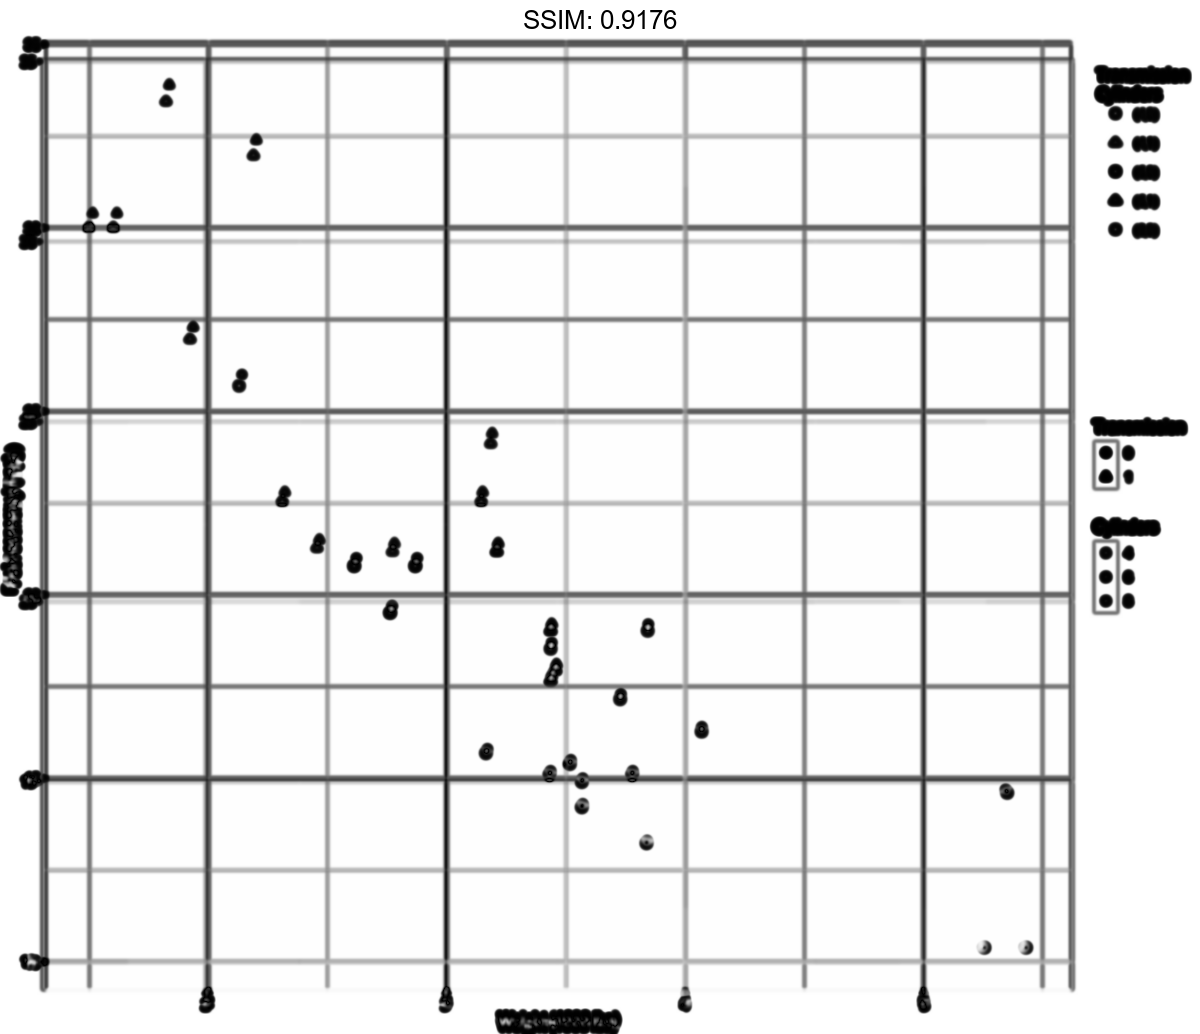
p <- p2 + theme(legend.text = element_text(size = 8, colour = "red"))
plotly::ggplotly(p)
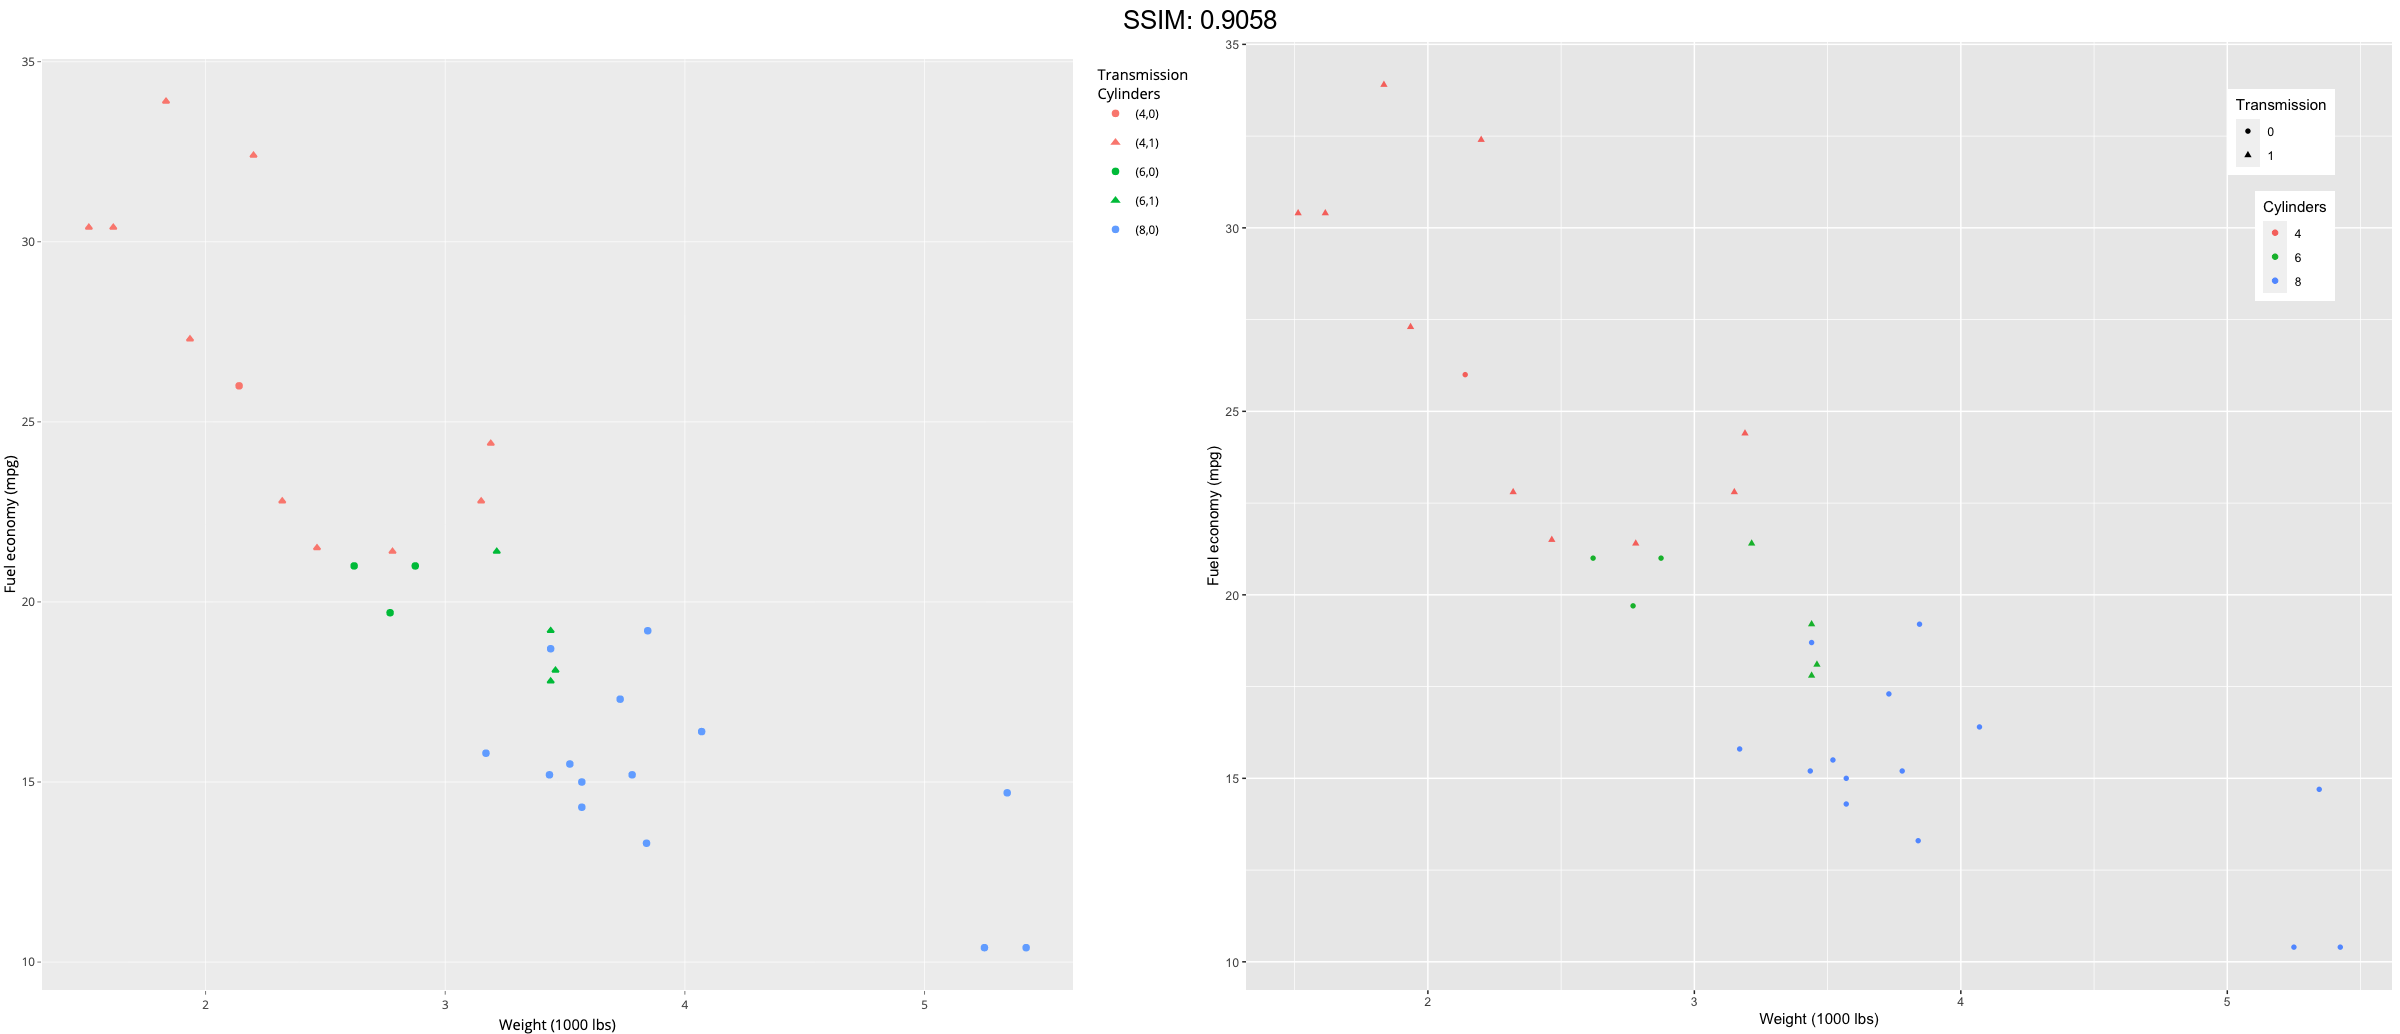
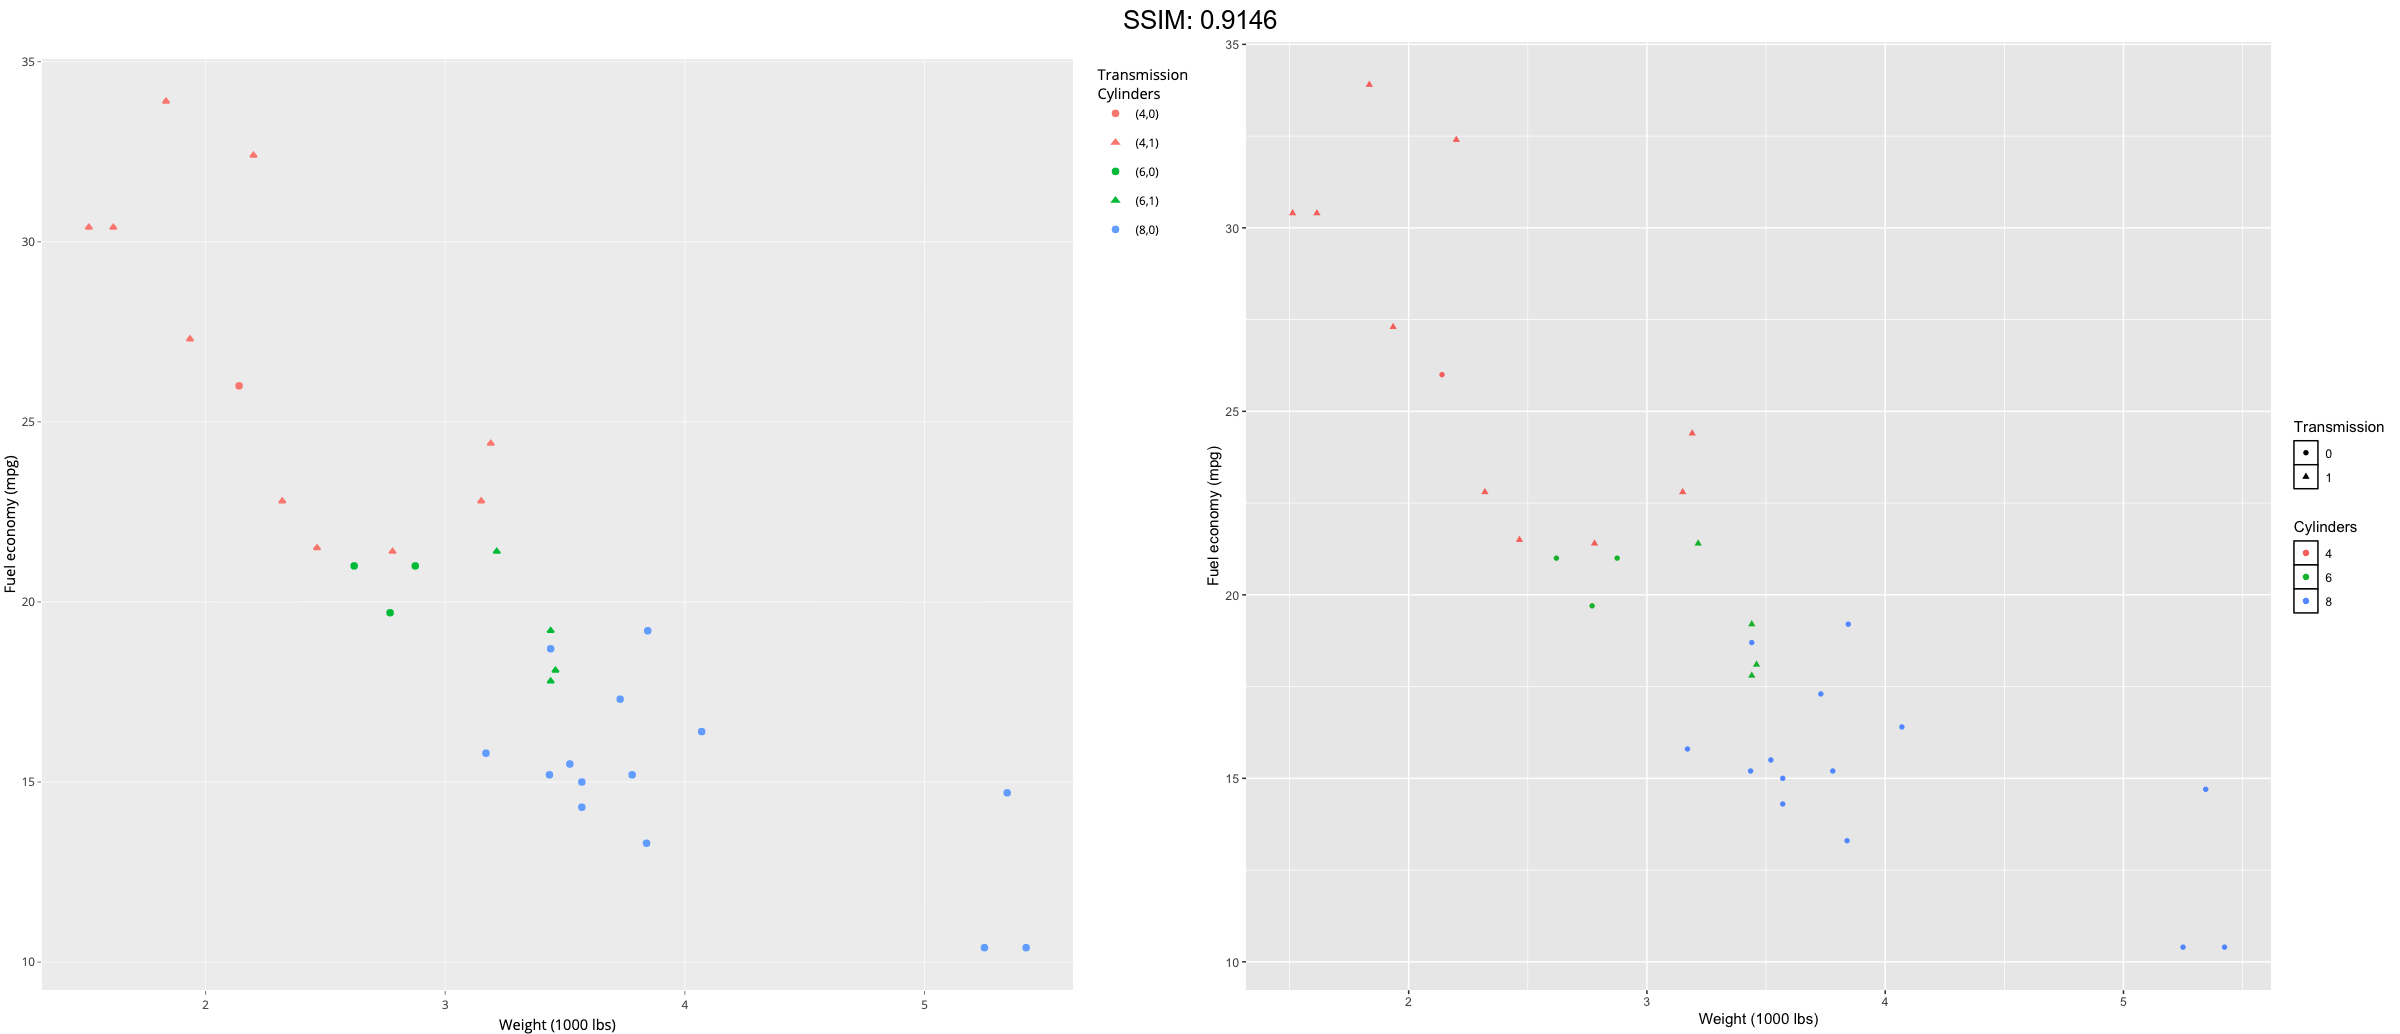
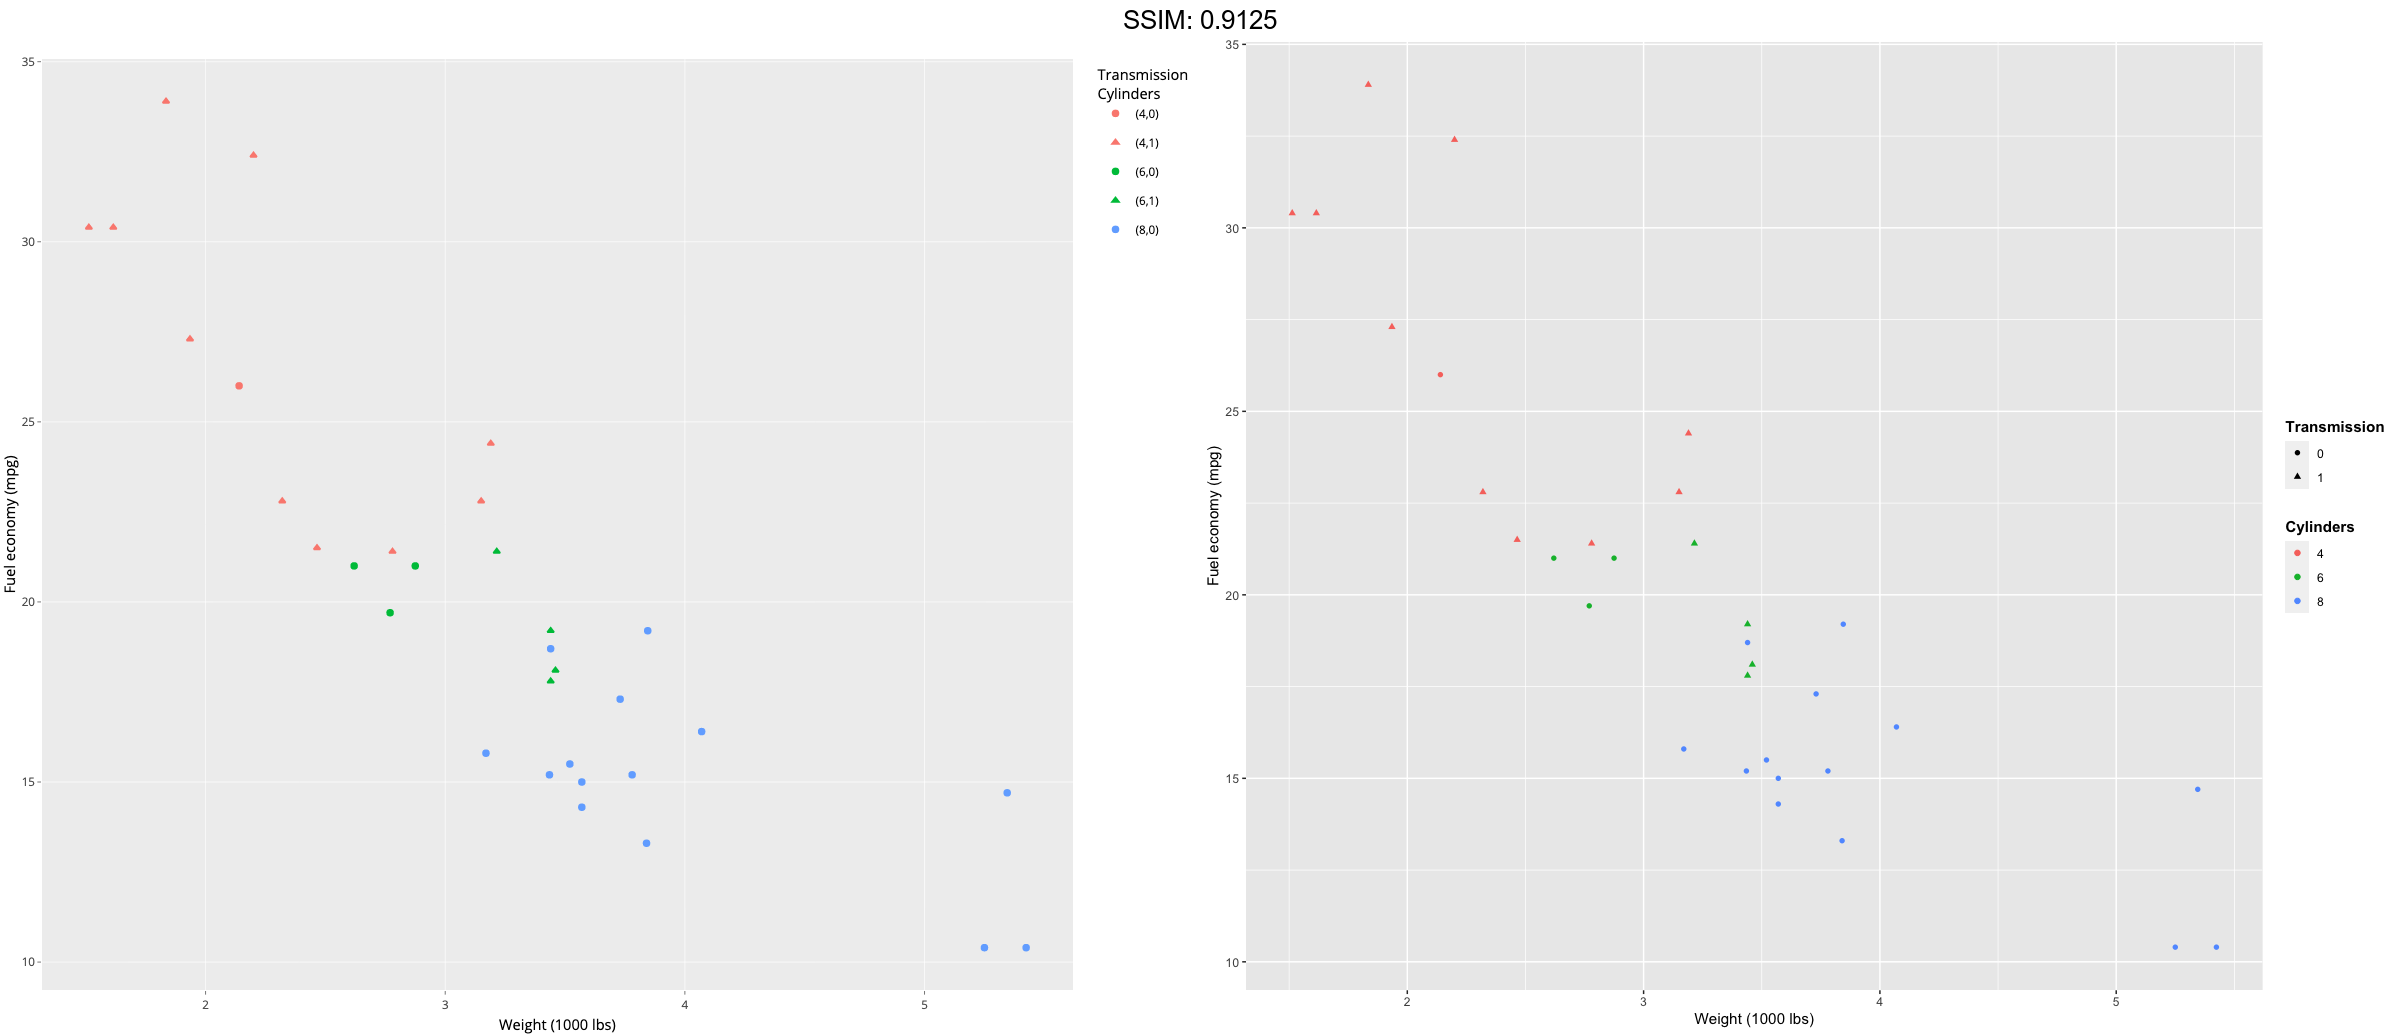
p2 <- ggplot(mtcars, aes(wt, mpg)) +
  geom_point(aes(colour = factor(cyl), shape = factor(vs))) +
  labs(
    x = "Weight (1000 lbs)",
    y = "Fuel economy (mpg)",
    colour = "Cylinders",
    shape = "Transmission"
   )
p <-  p2 + theme(legend.title = element_text(face = "bold"))
plotly::ggplotly(p)
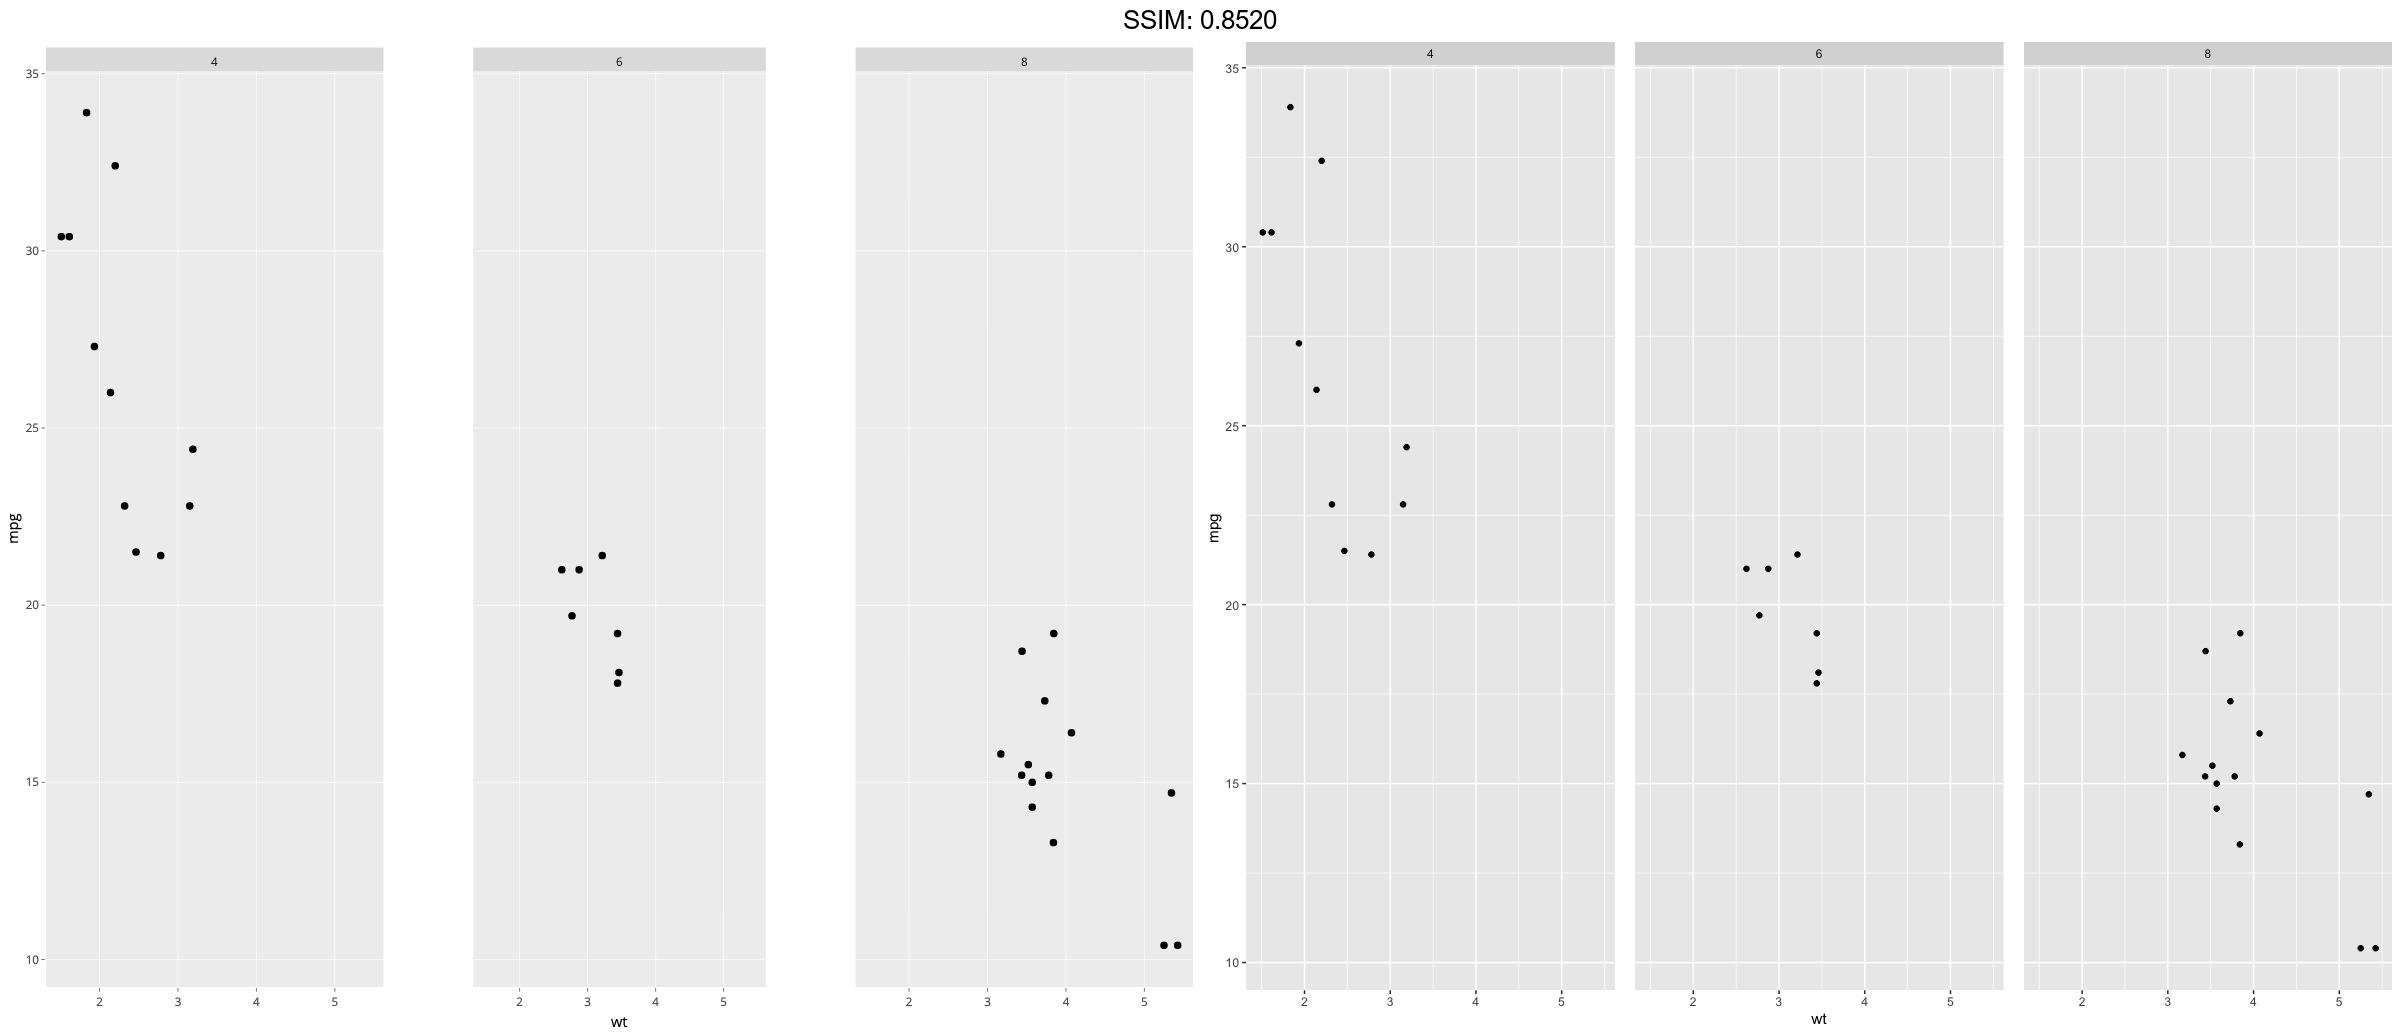
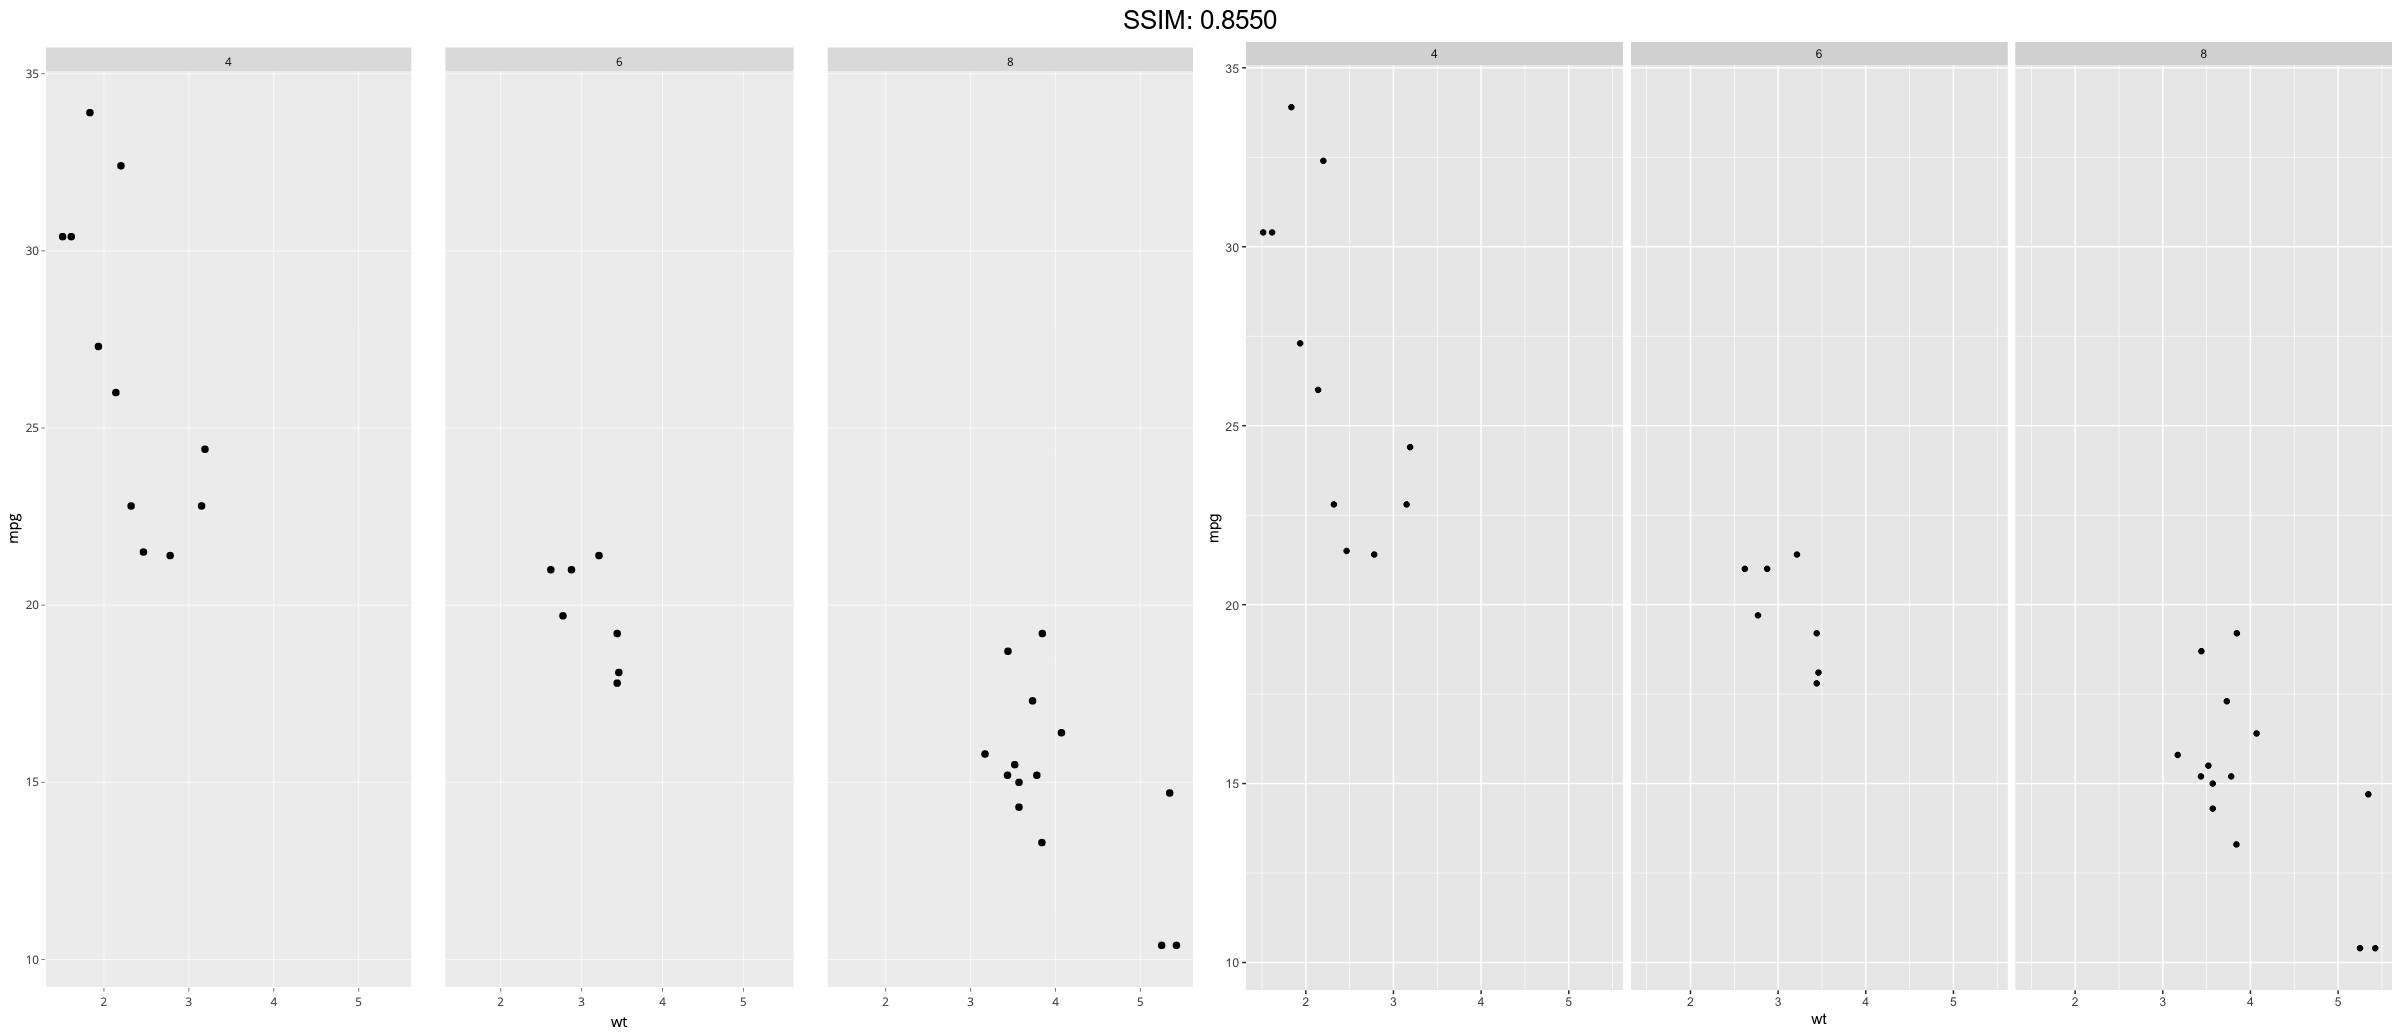
p3 <- ggplot(mtcars, aes(wt, mpg)) +
  geom_point() +
  facet_wrap(~ cyl)
plotly::ggplotly(p3)
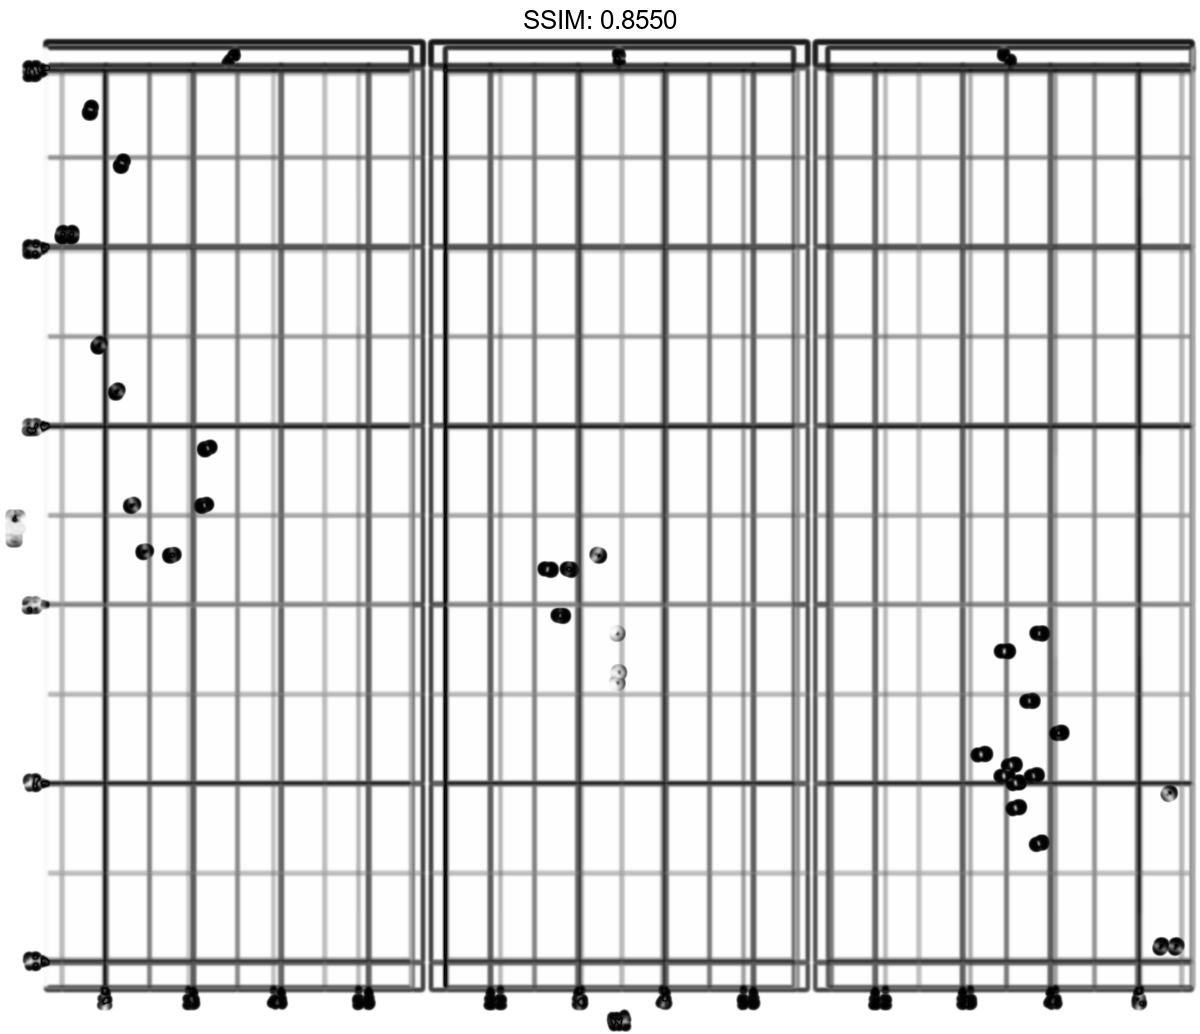
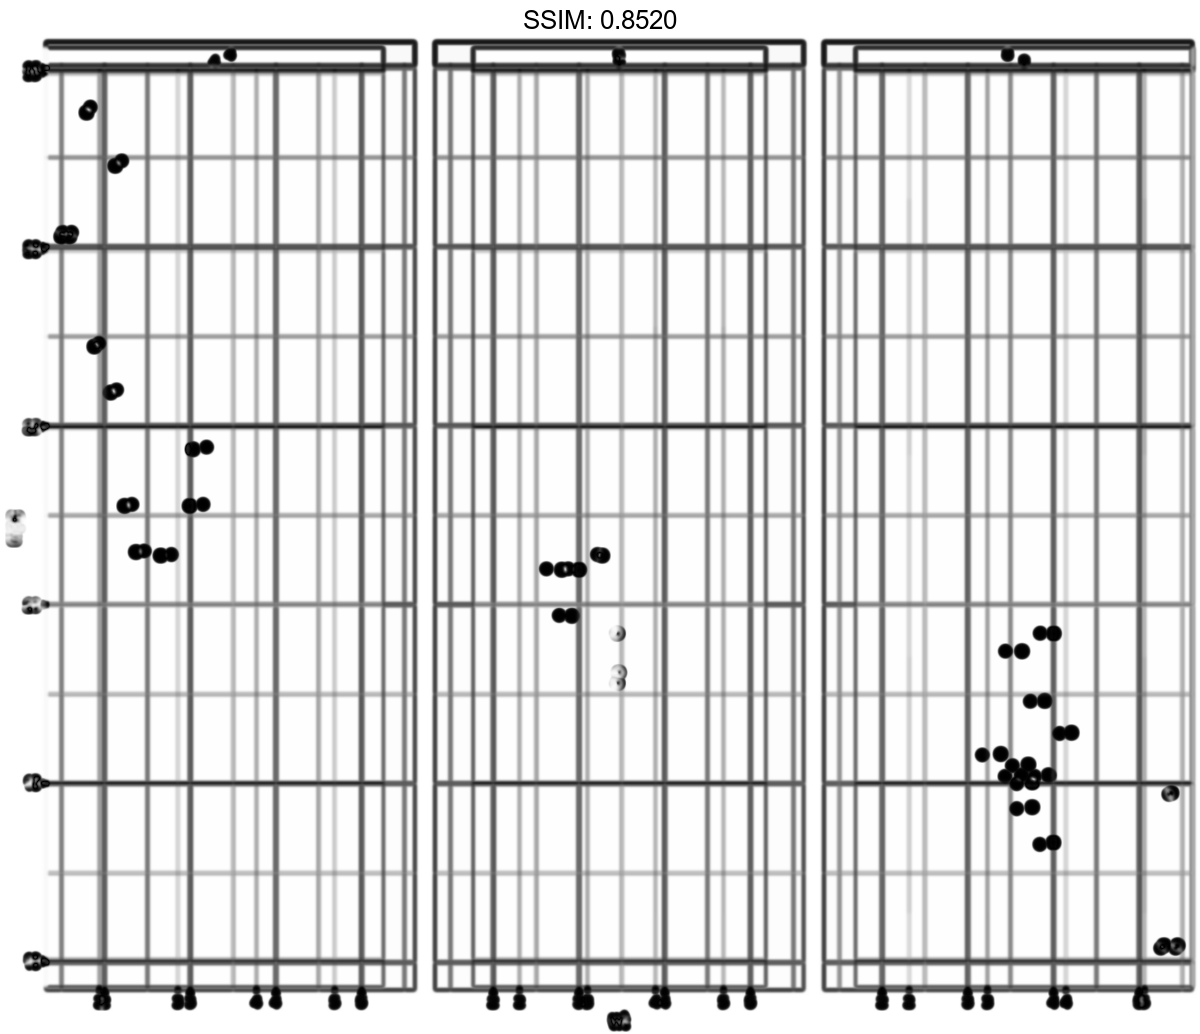
p3 <- ggplot(mtcars, aes(wt, mpg)) +
  geom_point() +
  facet_wrap(~ cyl)
p <-  p3 + theme(strip.background = element_rect(colour = "black", fill = "white"))
plotly::ggplotly(p)
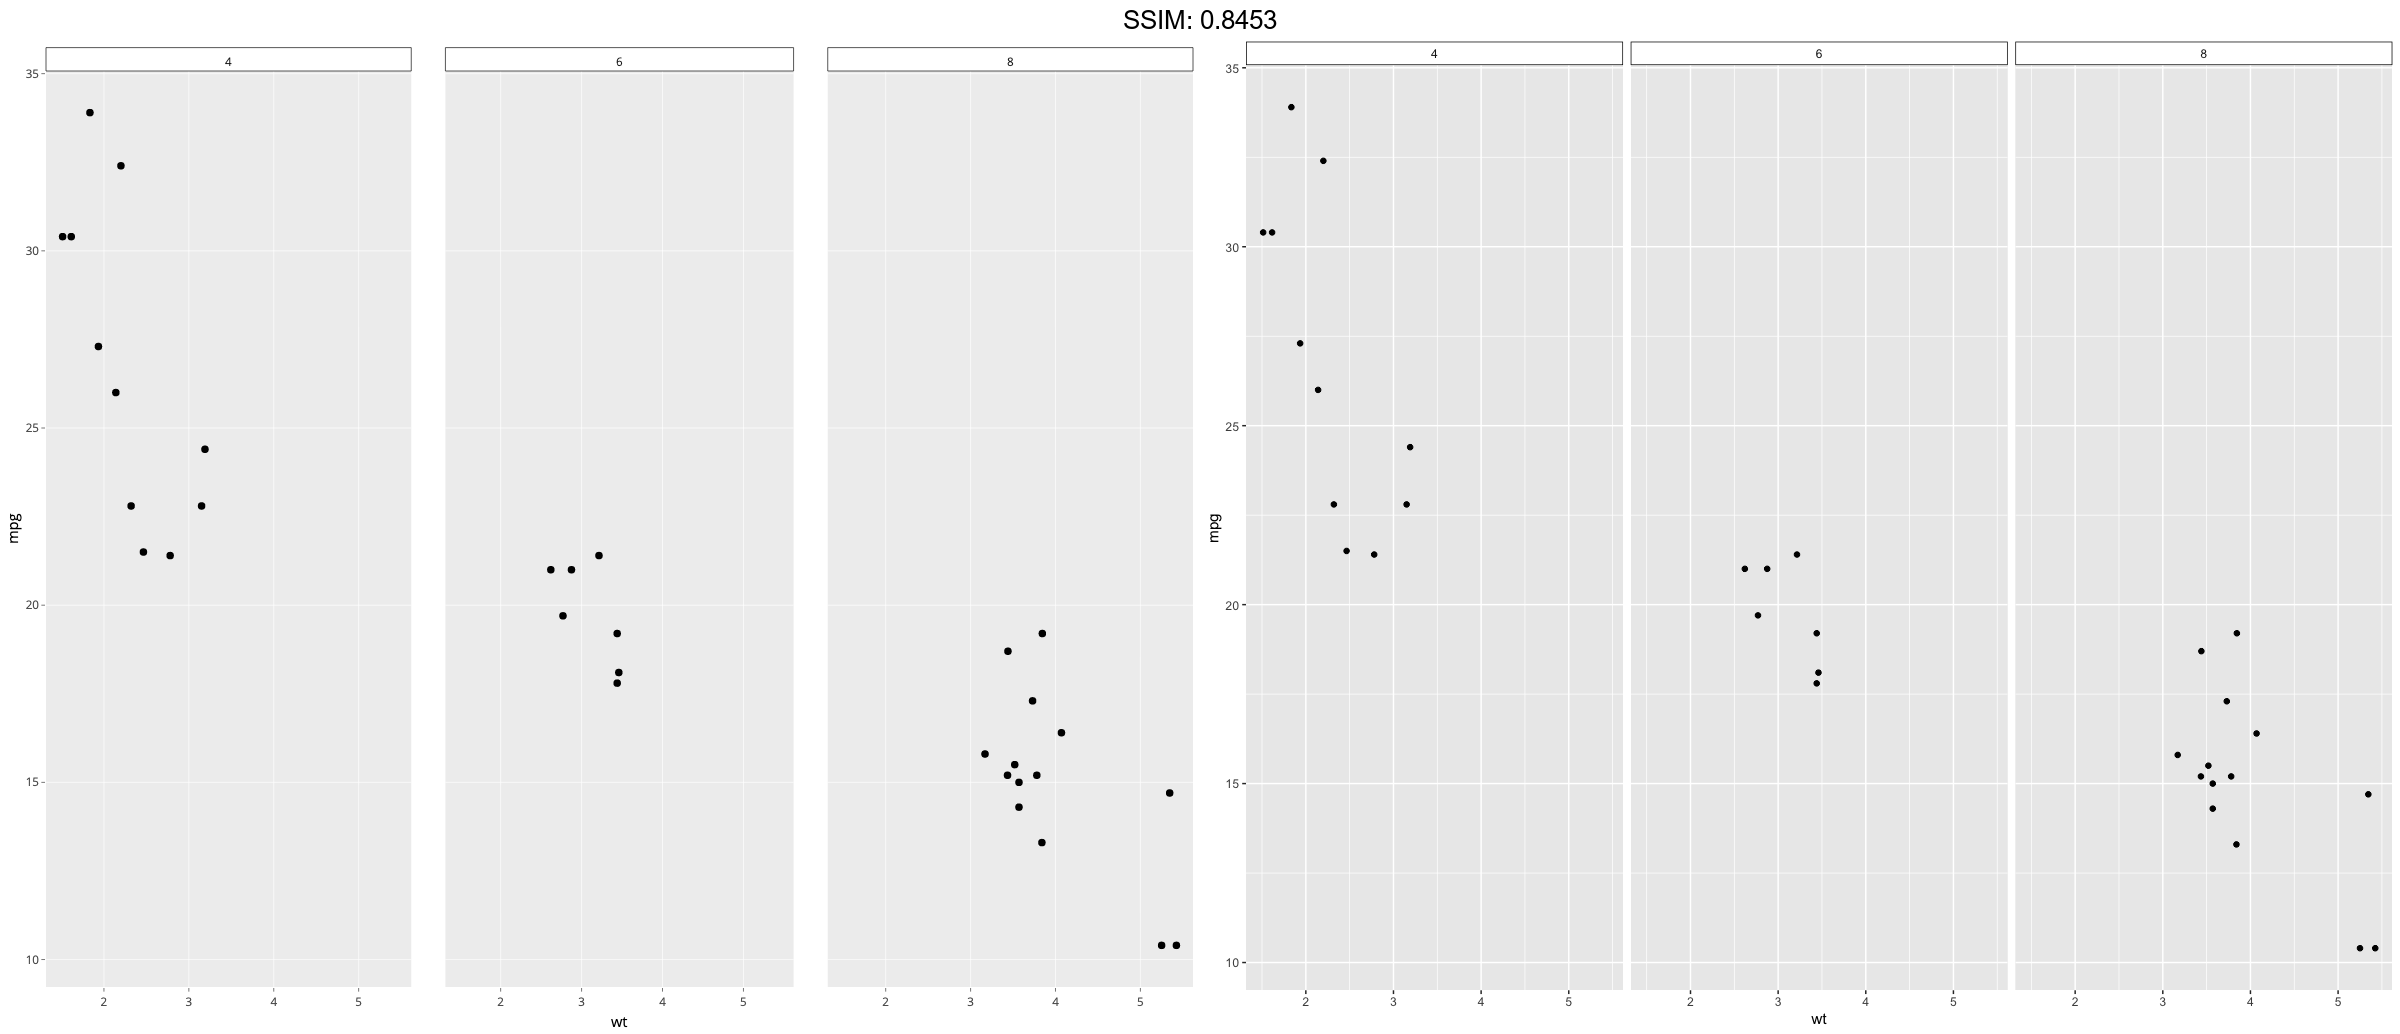
p3 <- ggplot(mtcars, aes(wt, mpg)) +
  geom_point() +
  facet_wrap(~ cyl)
p <-  p3 + theme(strip.text.x = element_text(colour = "white", face = "bold"))
plotly::ggplotly(p)

p3 <- ggplot(mtcars, aes(wt, mpg)) +
  geom_point() +
  facet_wrap(~ cyl)
p <-  p3 + theme(panel.spacing = unit(1, "lines"))
plotly::ggplotly(p)