Themes in ggplot2
New to Plotly?
Plotly is a free and open-source graphing library for R. We recommend you read our Getting Started guide for the latest installation or upgrade instructions, then move on to our Plotly Fundamentals tutorials or dive straight in to some Basic Charts tutorials.
Specify the display of how non-data components of the plot are drawn and then convert them with ggplotly.
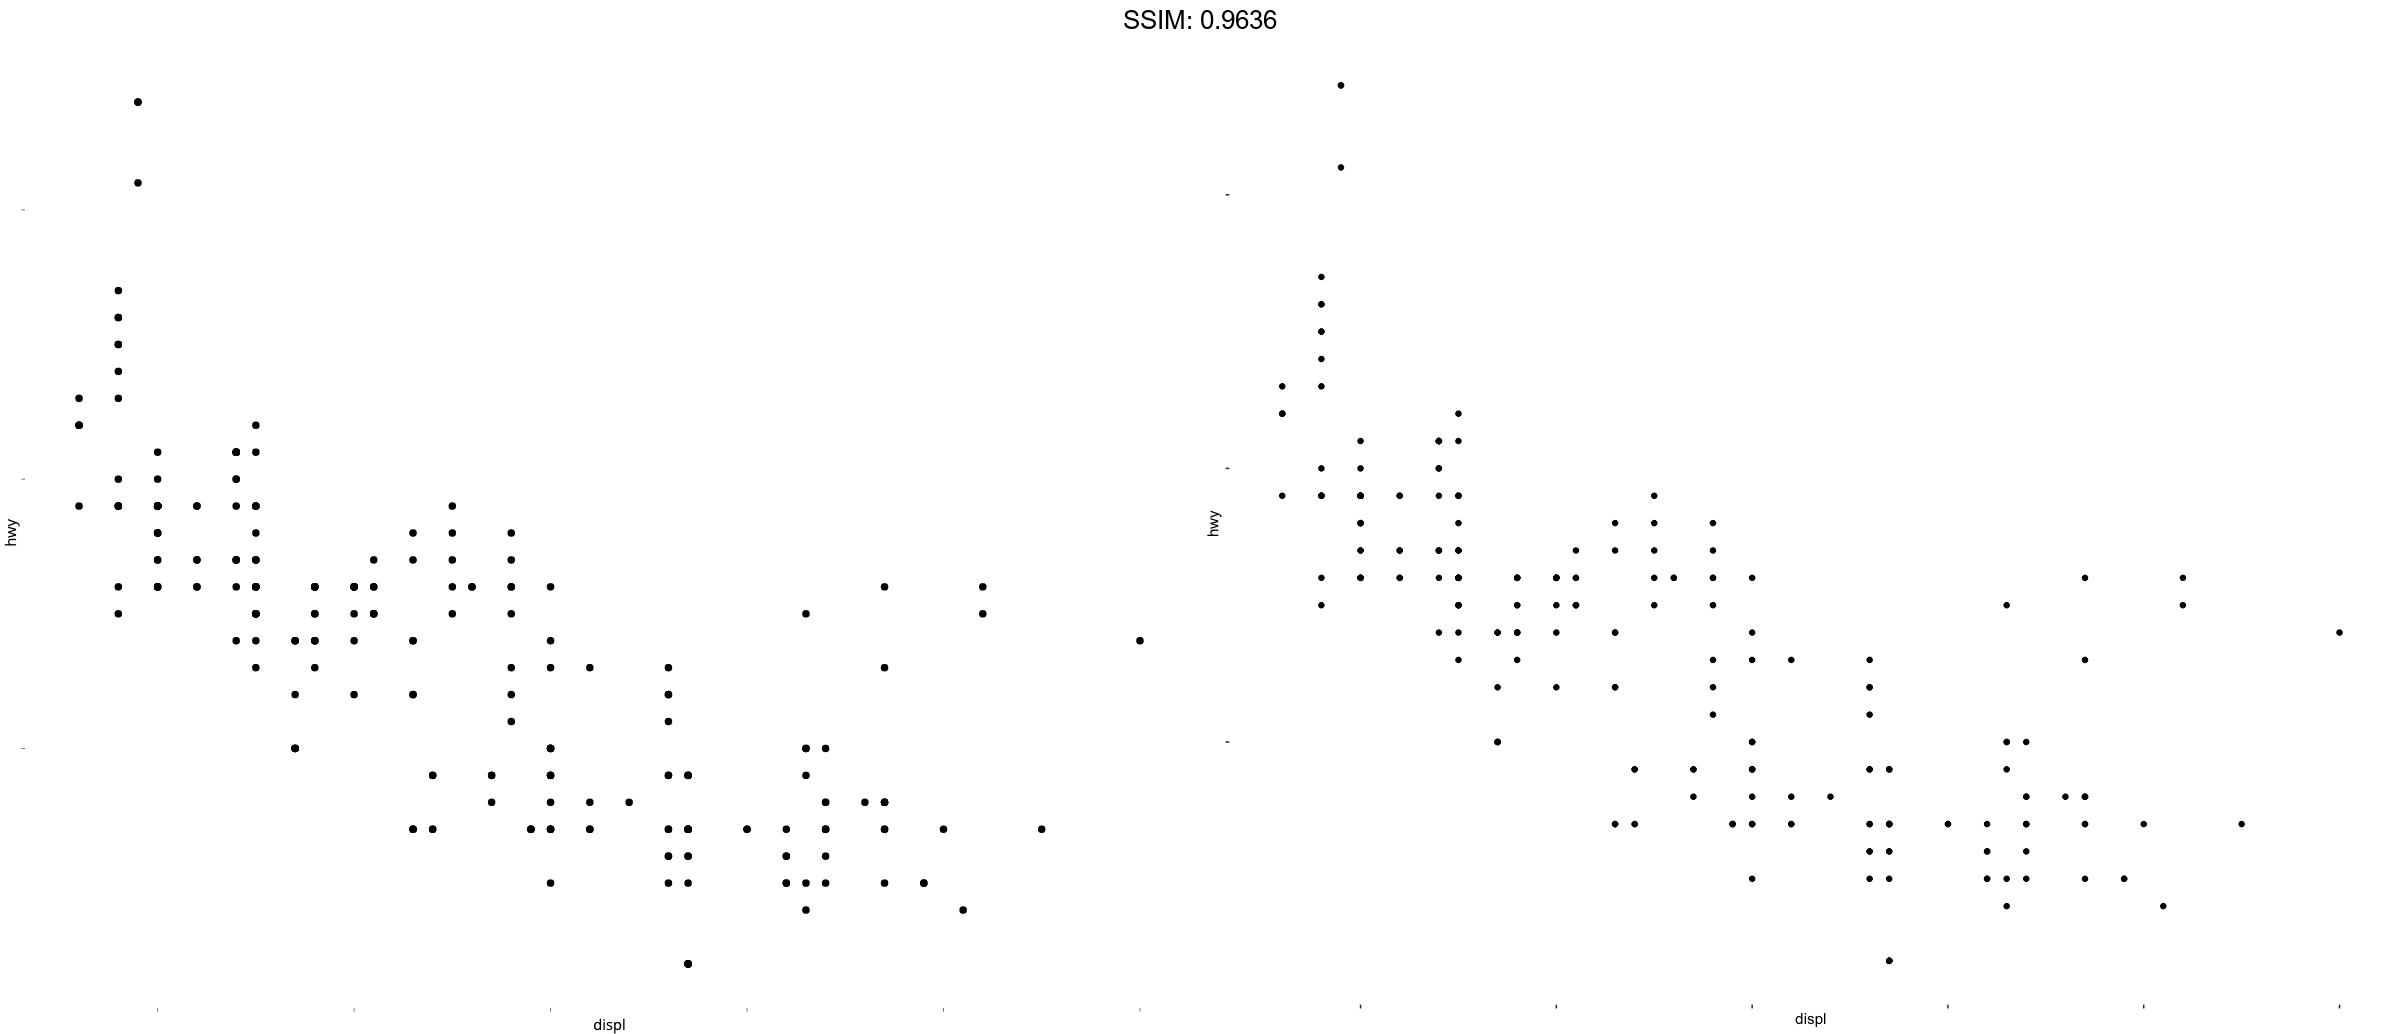
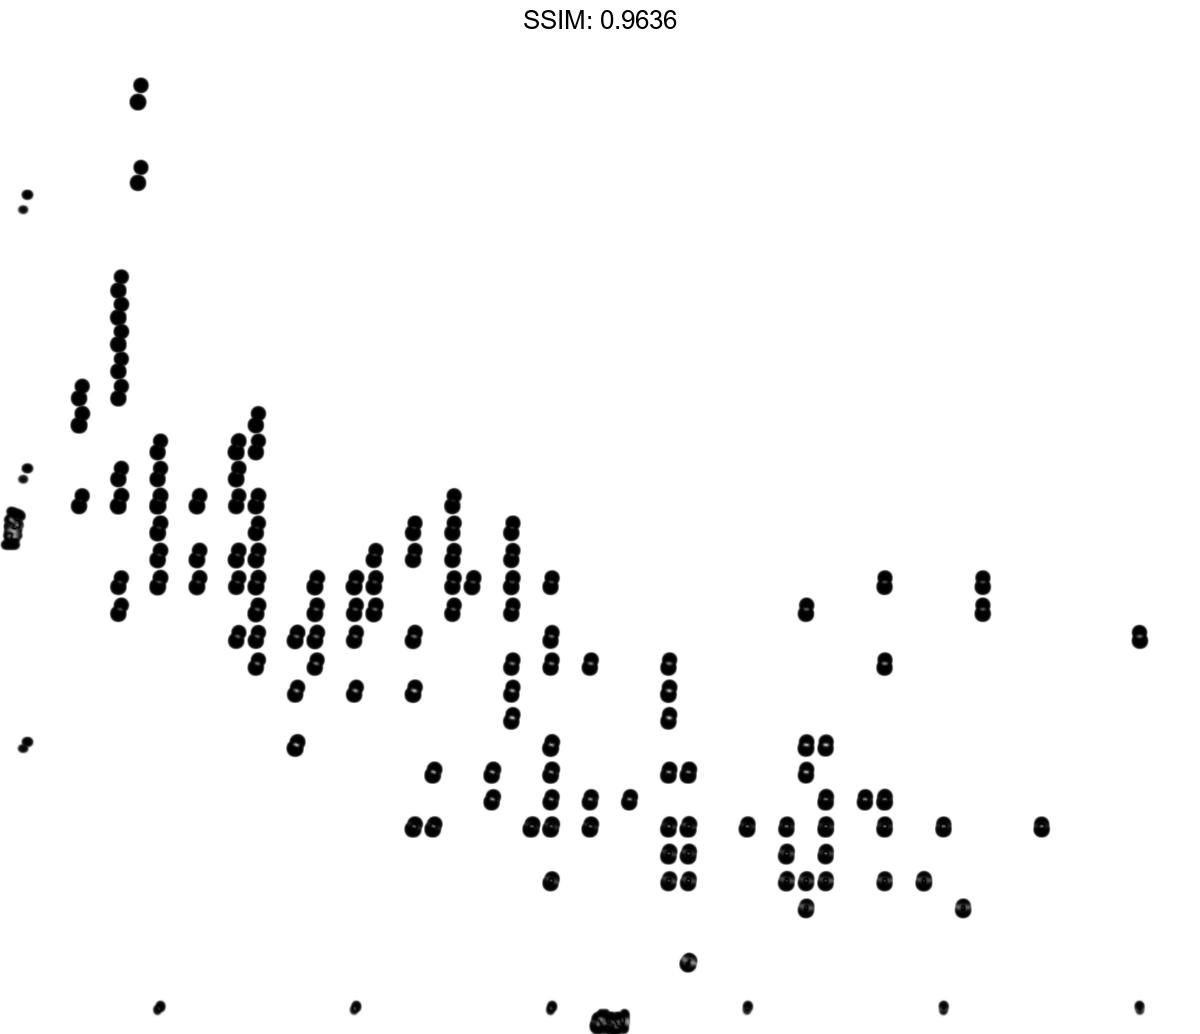
plot <- ggplot(mpg, aes(displ, hwy)) + geom_point()
p <-
 plot + theme(
  panel.background = element_blank(),
  axis.text = element_blank()
)
plotly::ggplotly(p)
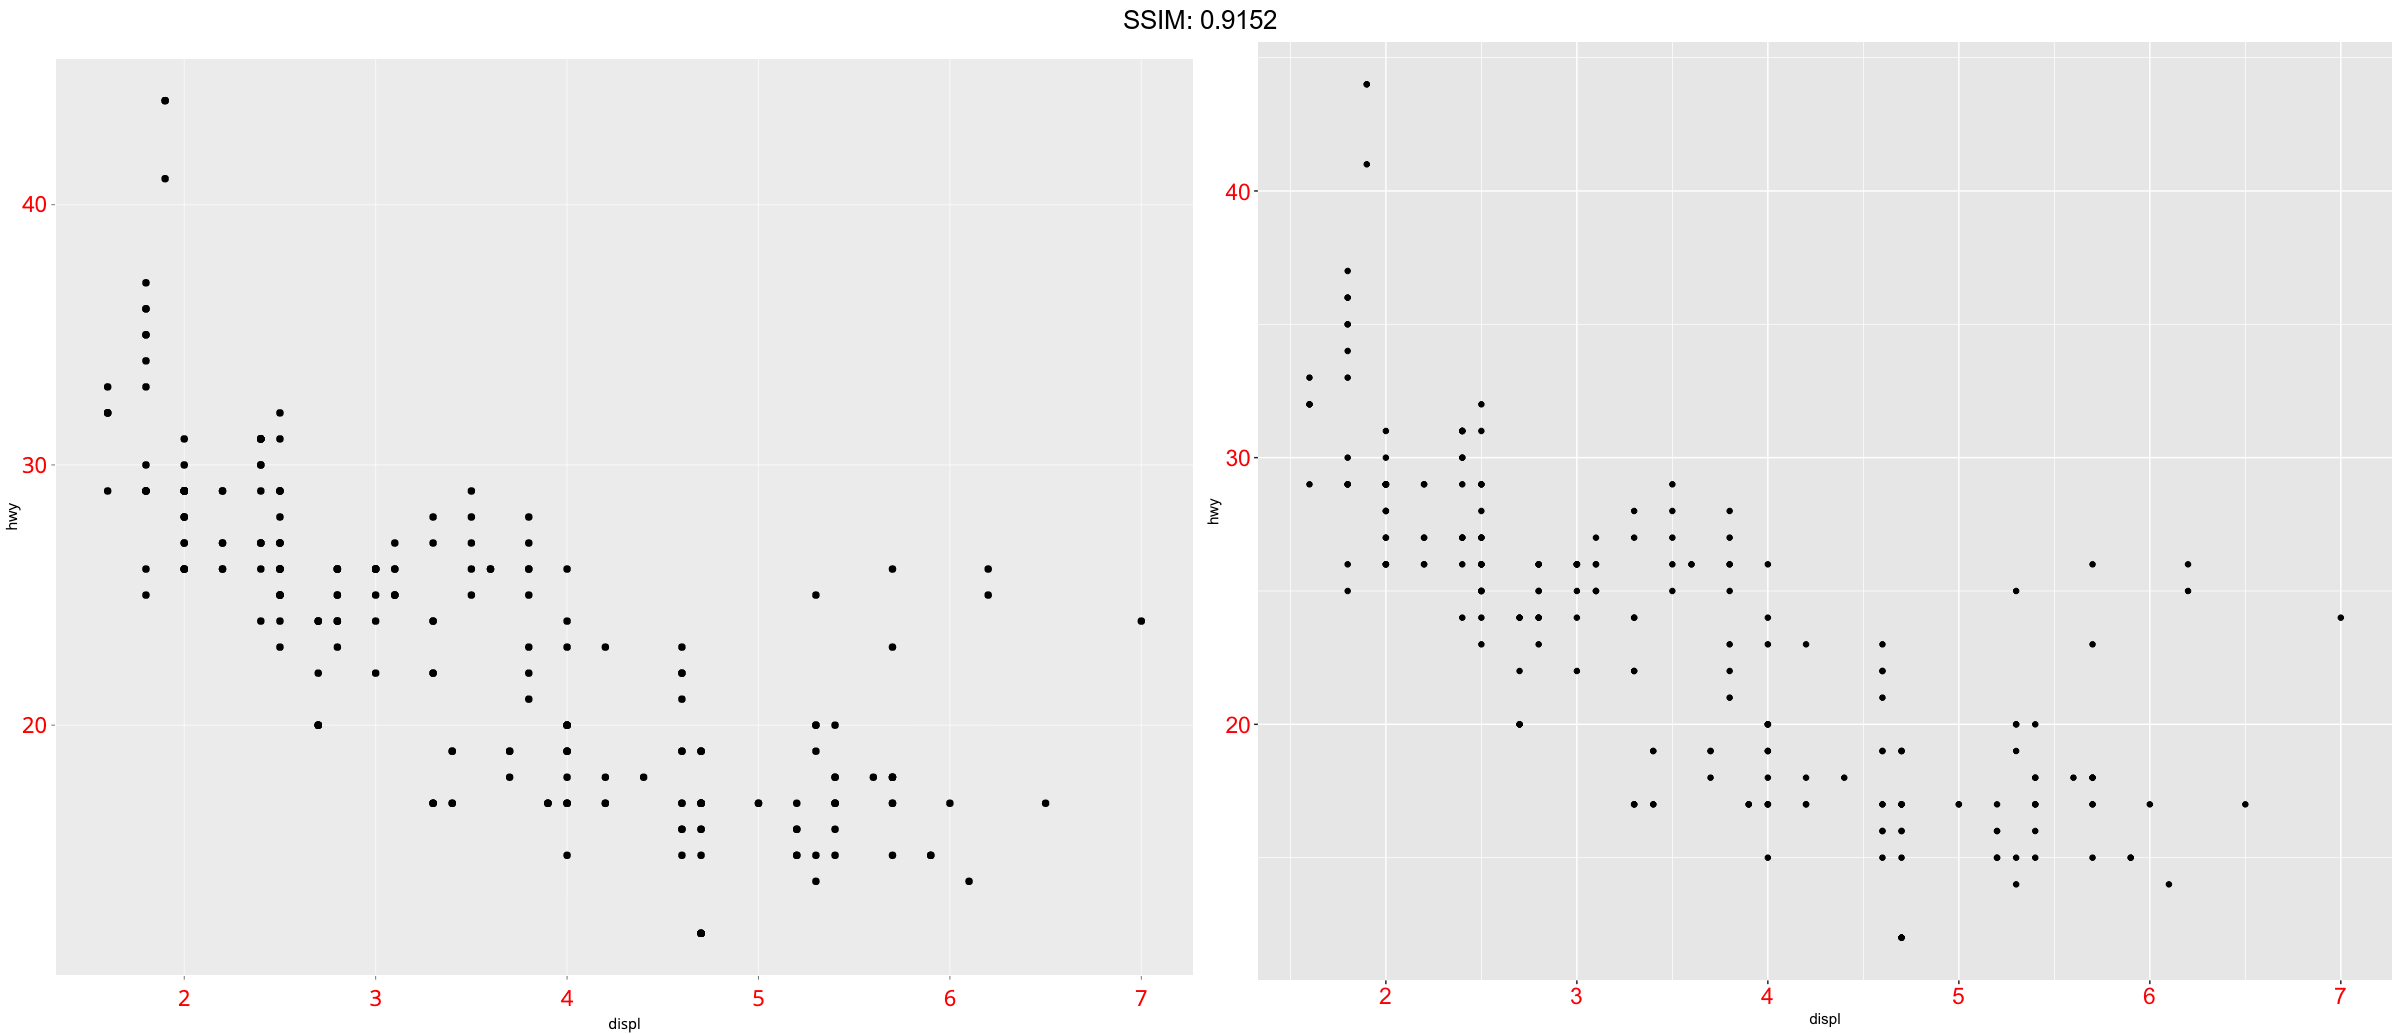
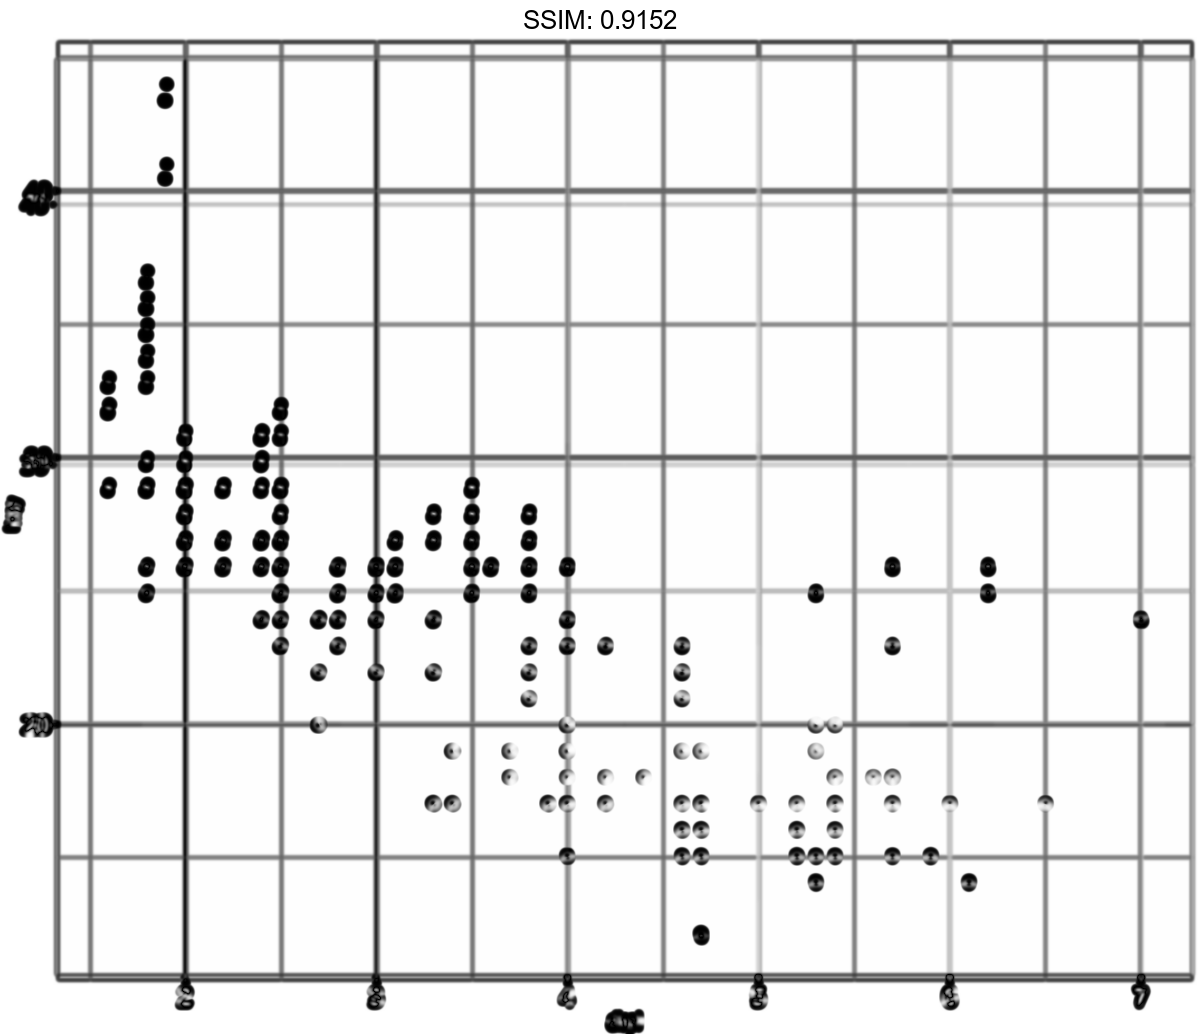
plot <- ggplot(mpg, aes(displ, hwy)) + geom_point()
p <-
 plot + theme(
  axis.text = element_text(colour = "red", size = rel(1.5))
)
plotly::ggplotly(p)
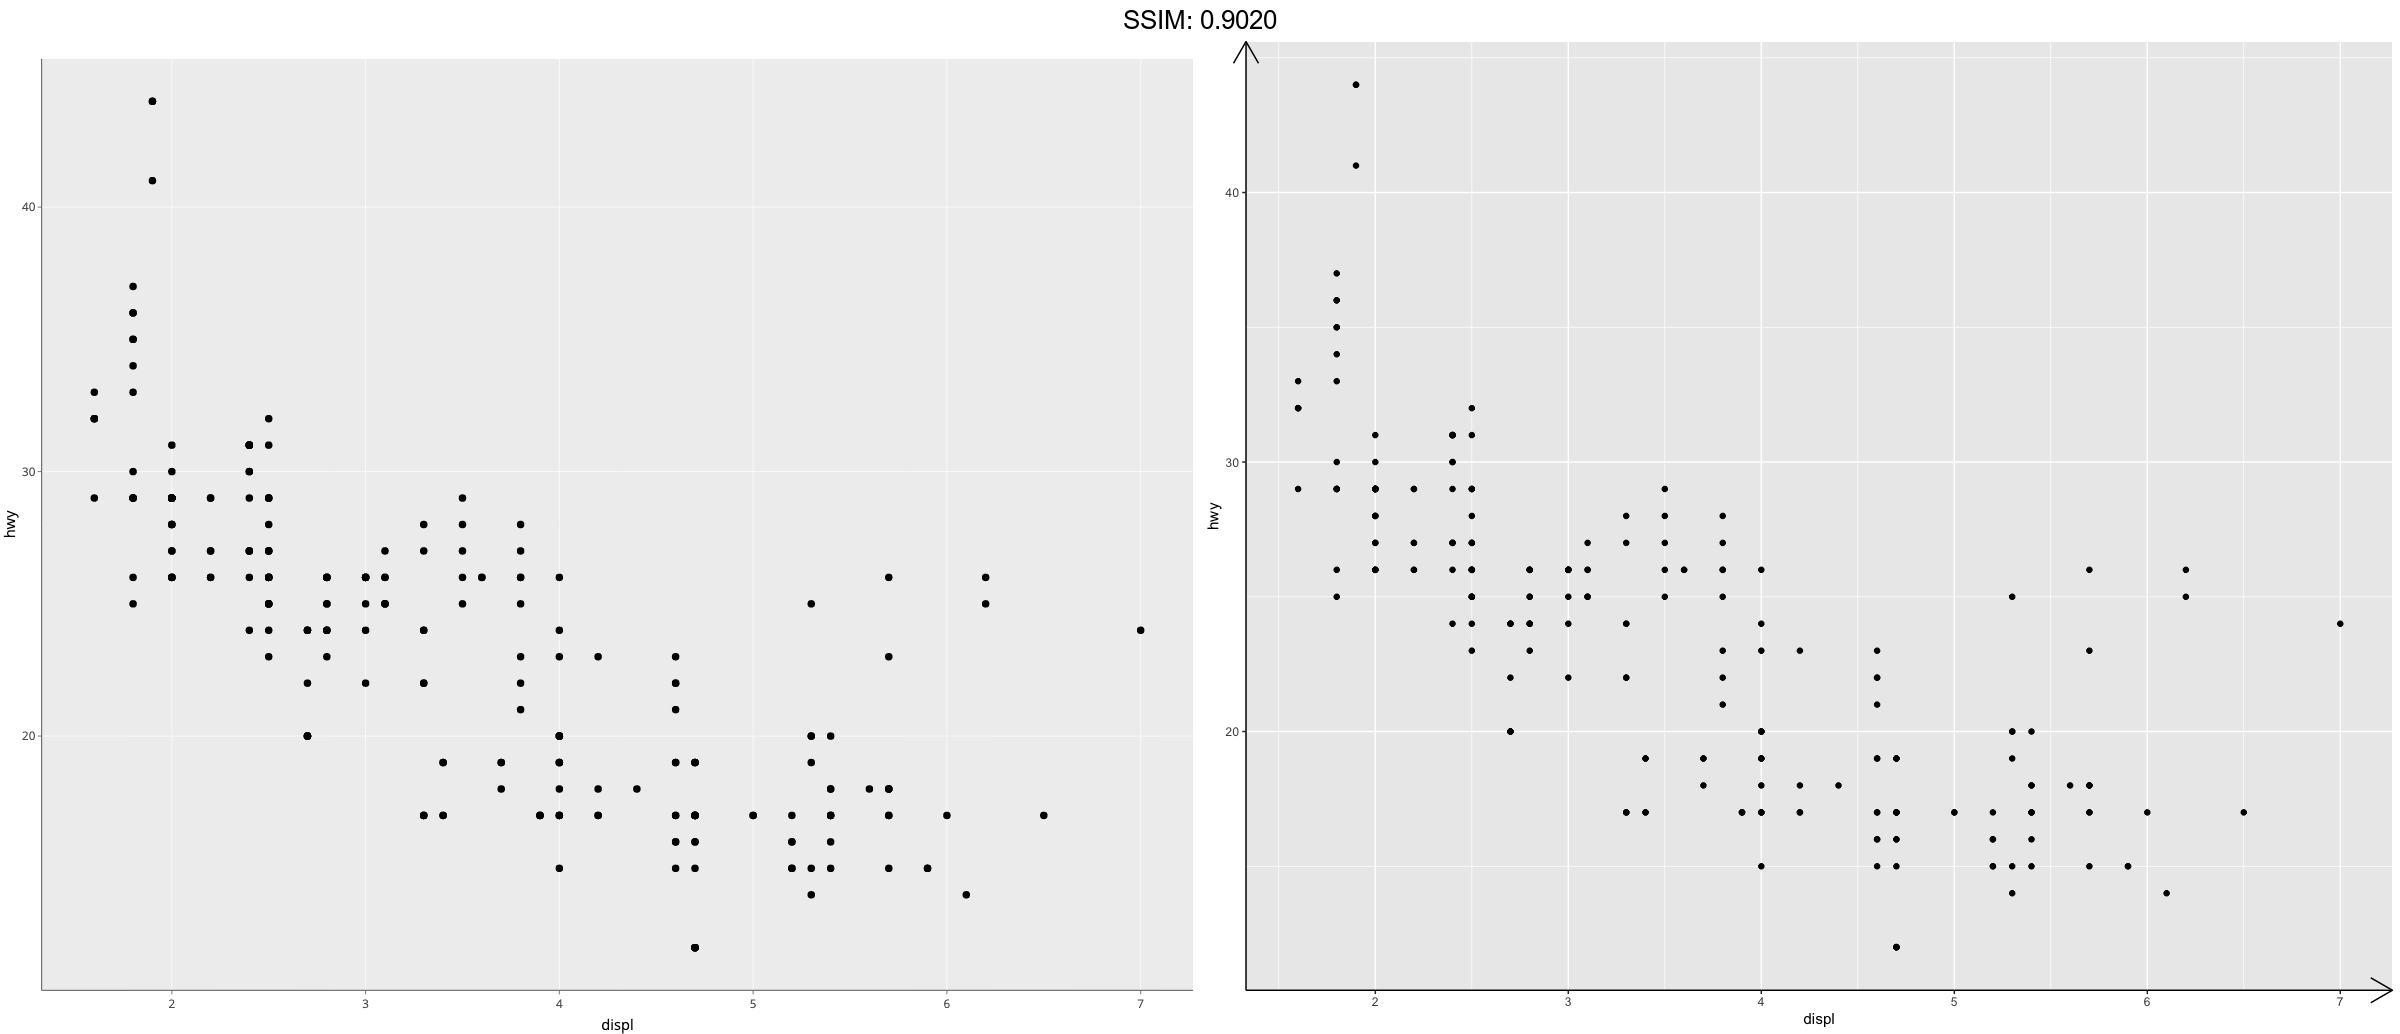
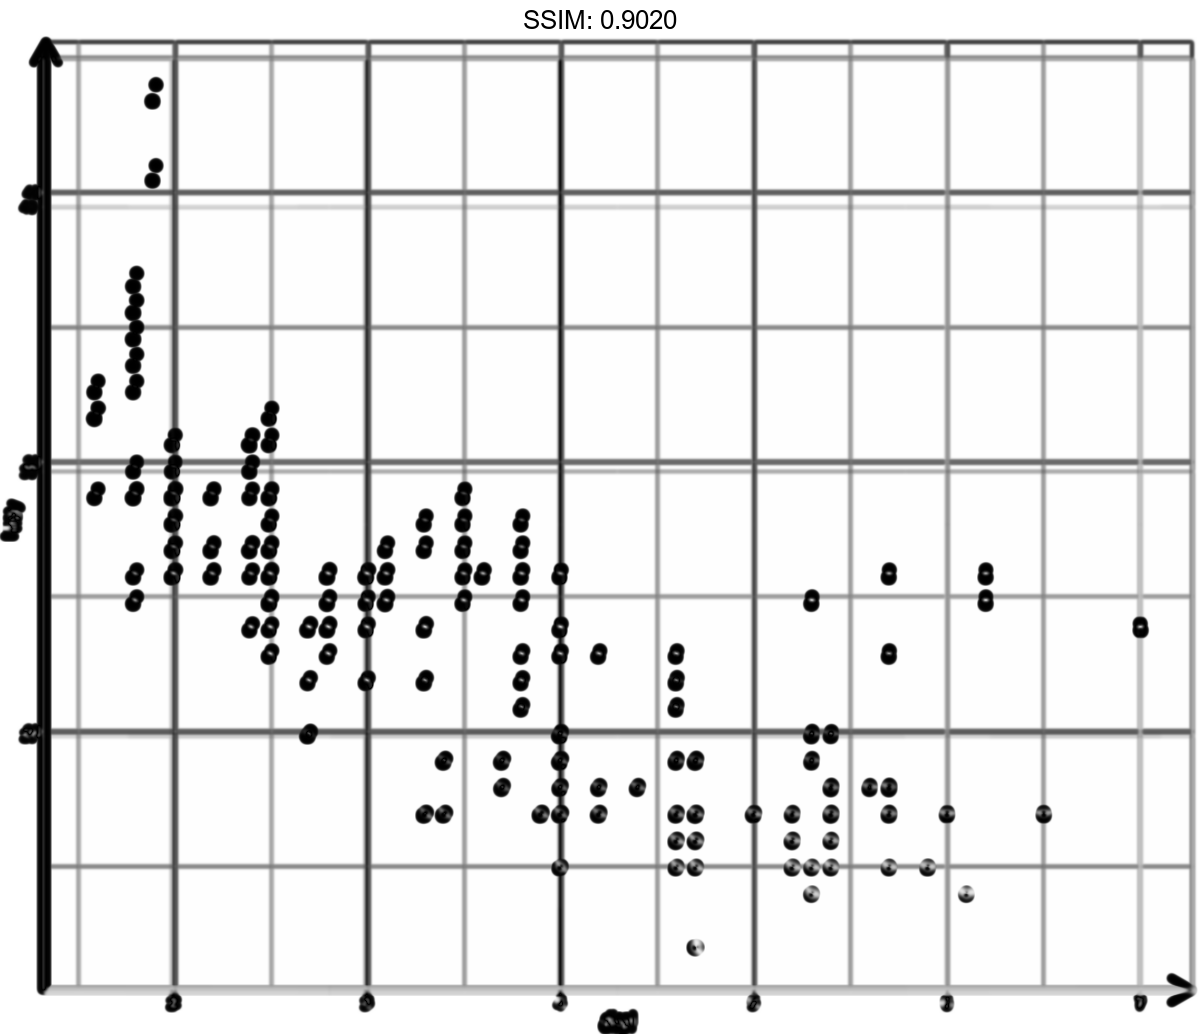
plot <- ggplot(mpg, aes(displ, hwy)) + geom_point()
p <-
 plot + theme(
  axis.line = element_line(arrow = arrow())
)
plotly::ggplotly(p)
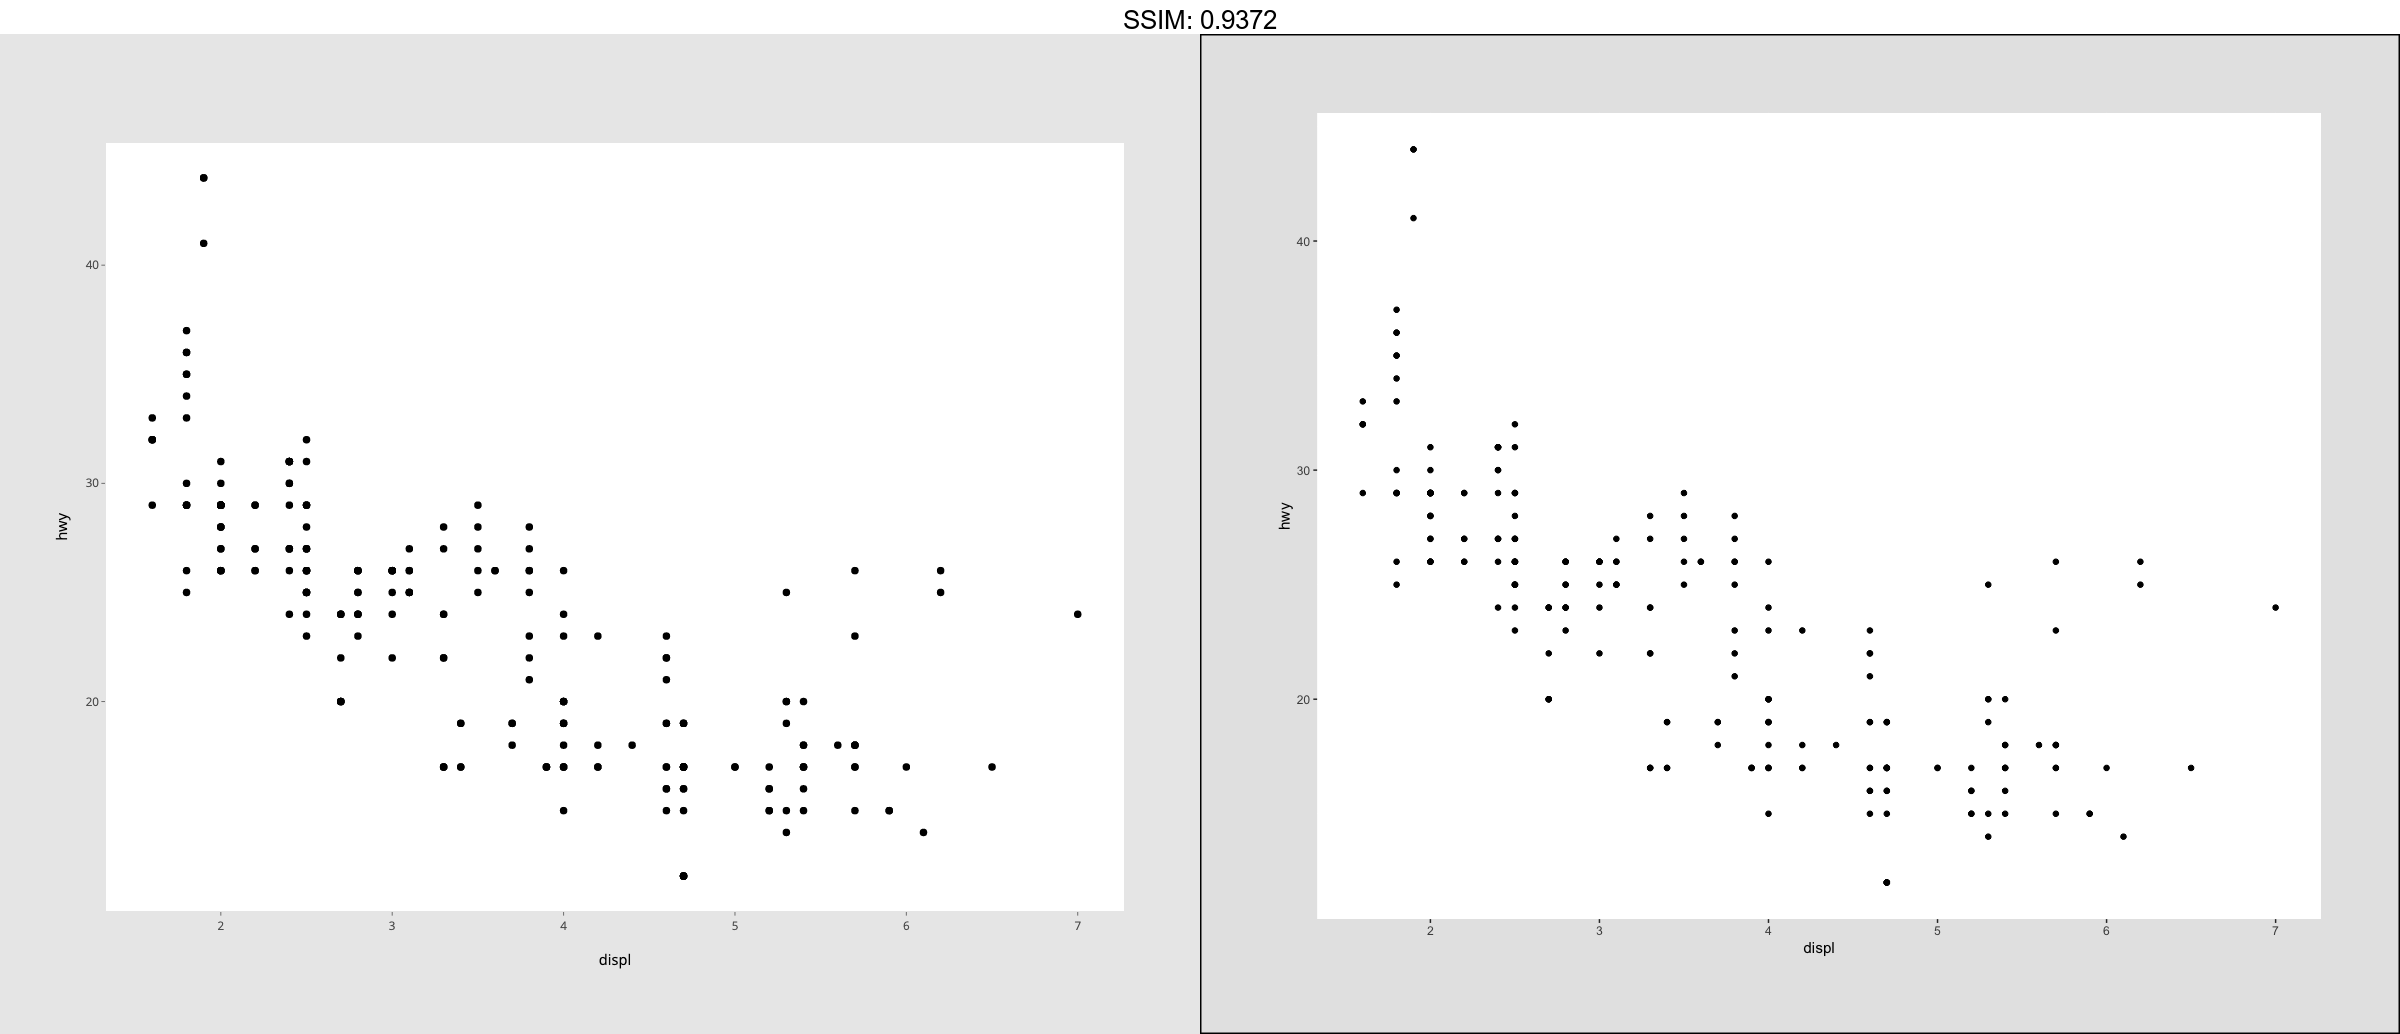
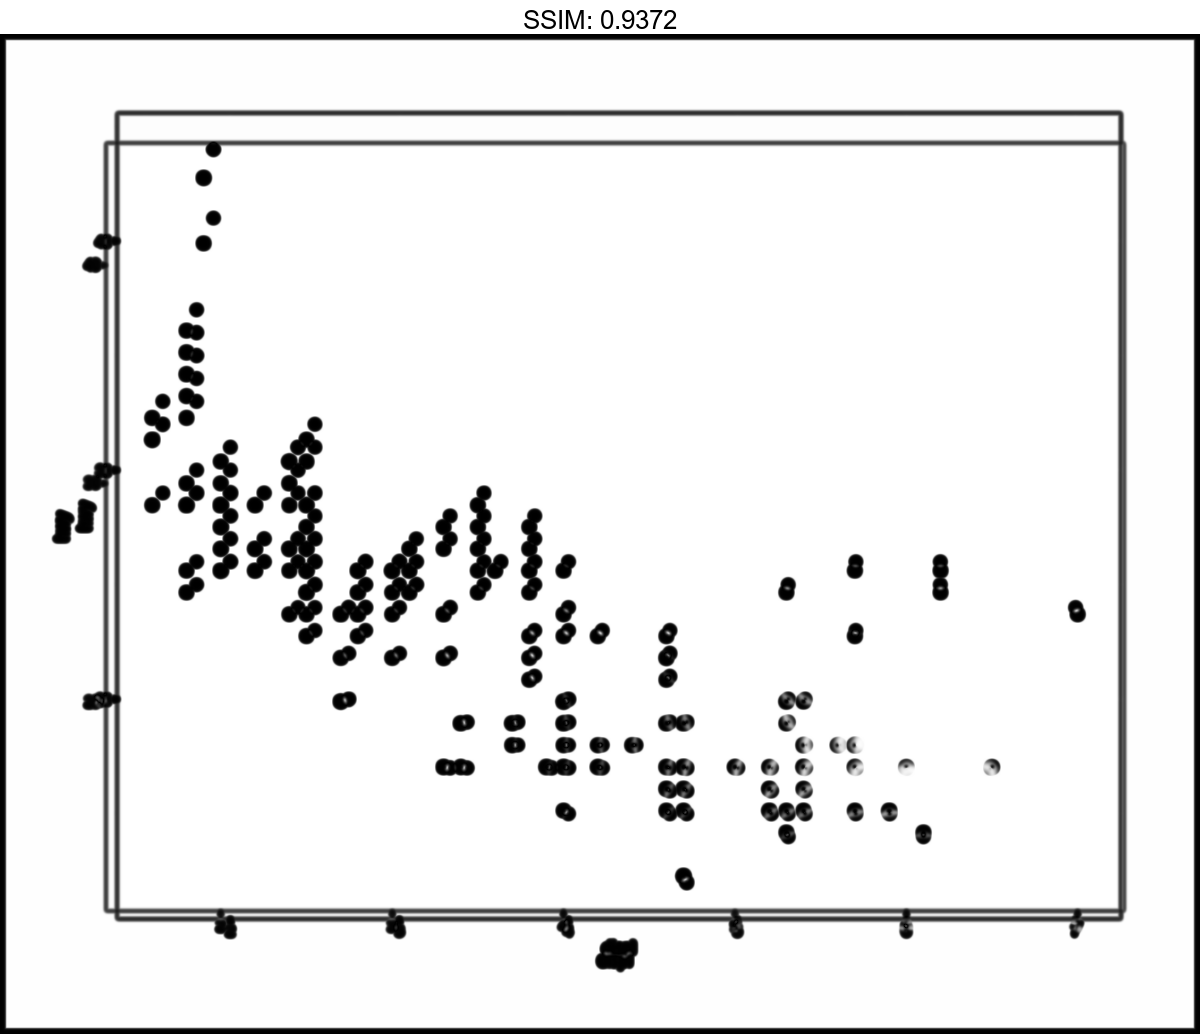
plot <- ggplot(mpg, aes(displ, hwy)) + geom_point()
p <-
 plot + theme(
  panel.background = element_rect(fill = "white"),
  plot.margin = margin(2, 2, 2, 2, "cm"),
  plot.background = element_rect(
    fill = "grey90",
    colour = "black",
    size = 1
  )
)
plotly::ggplotly(p)