Plotly R Open Source Graphing Library
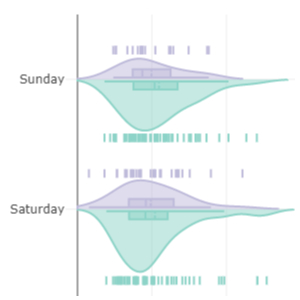
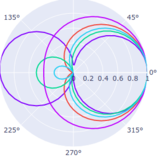
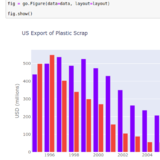
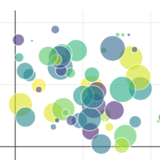
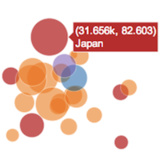
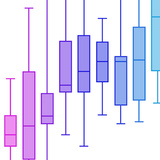
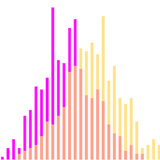
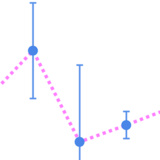
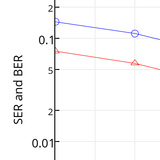
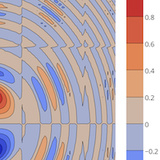
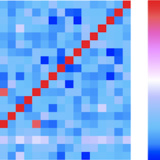
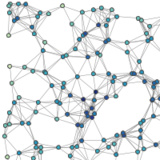
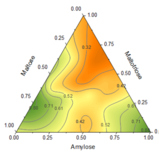
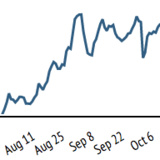
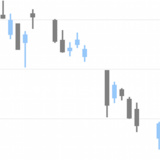
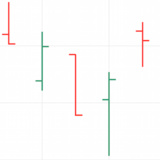
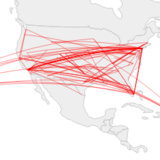
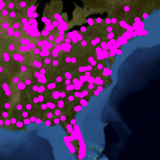
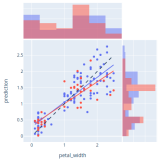
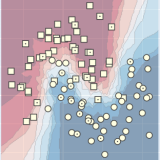
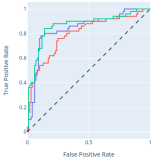
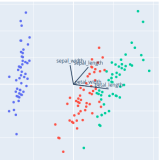
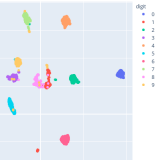
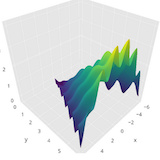
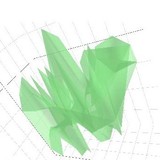
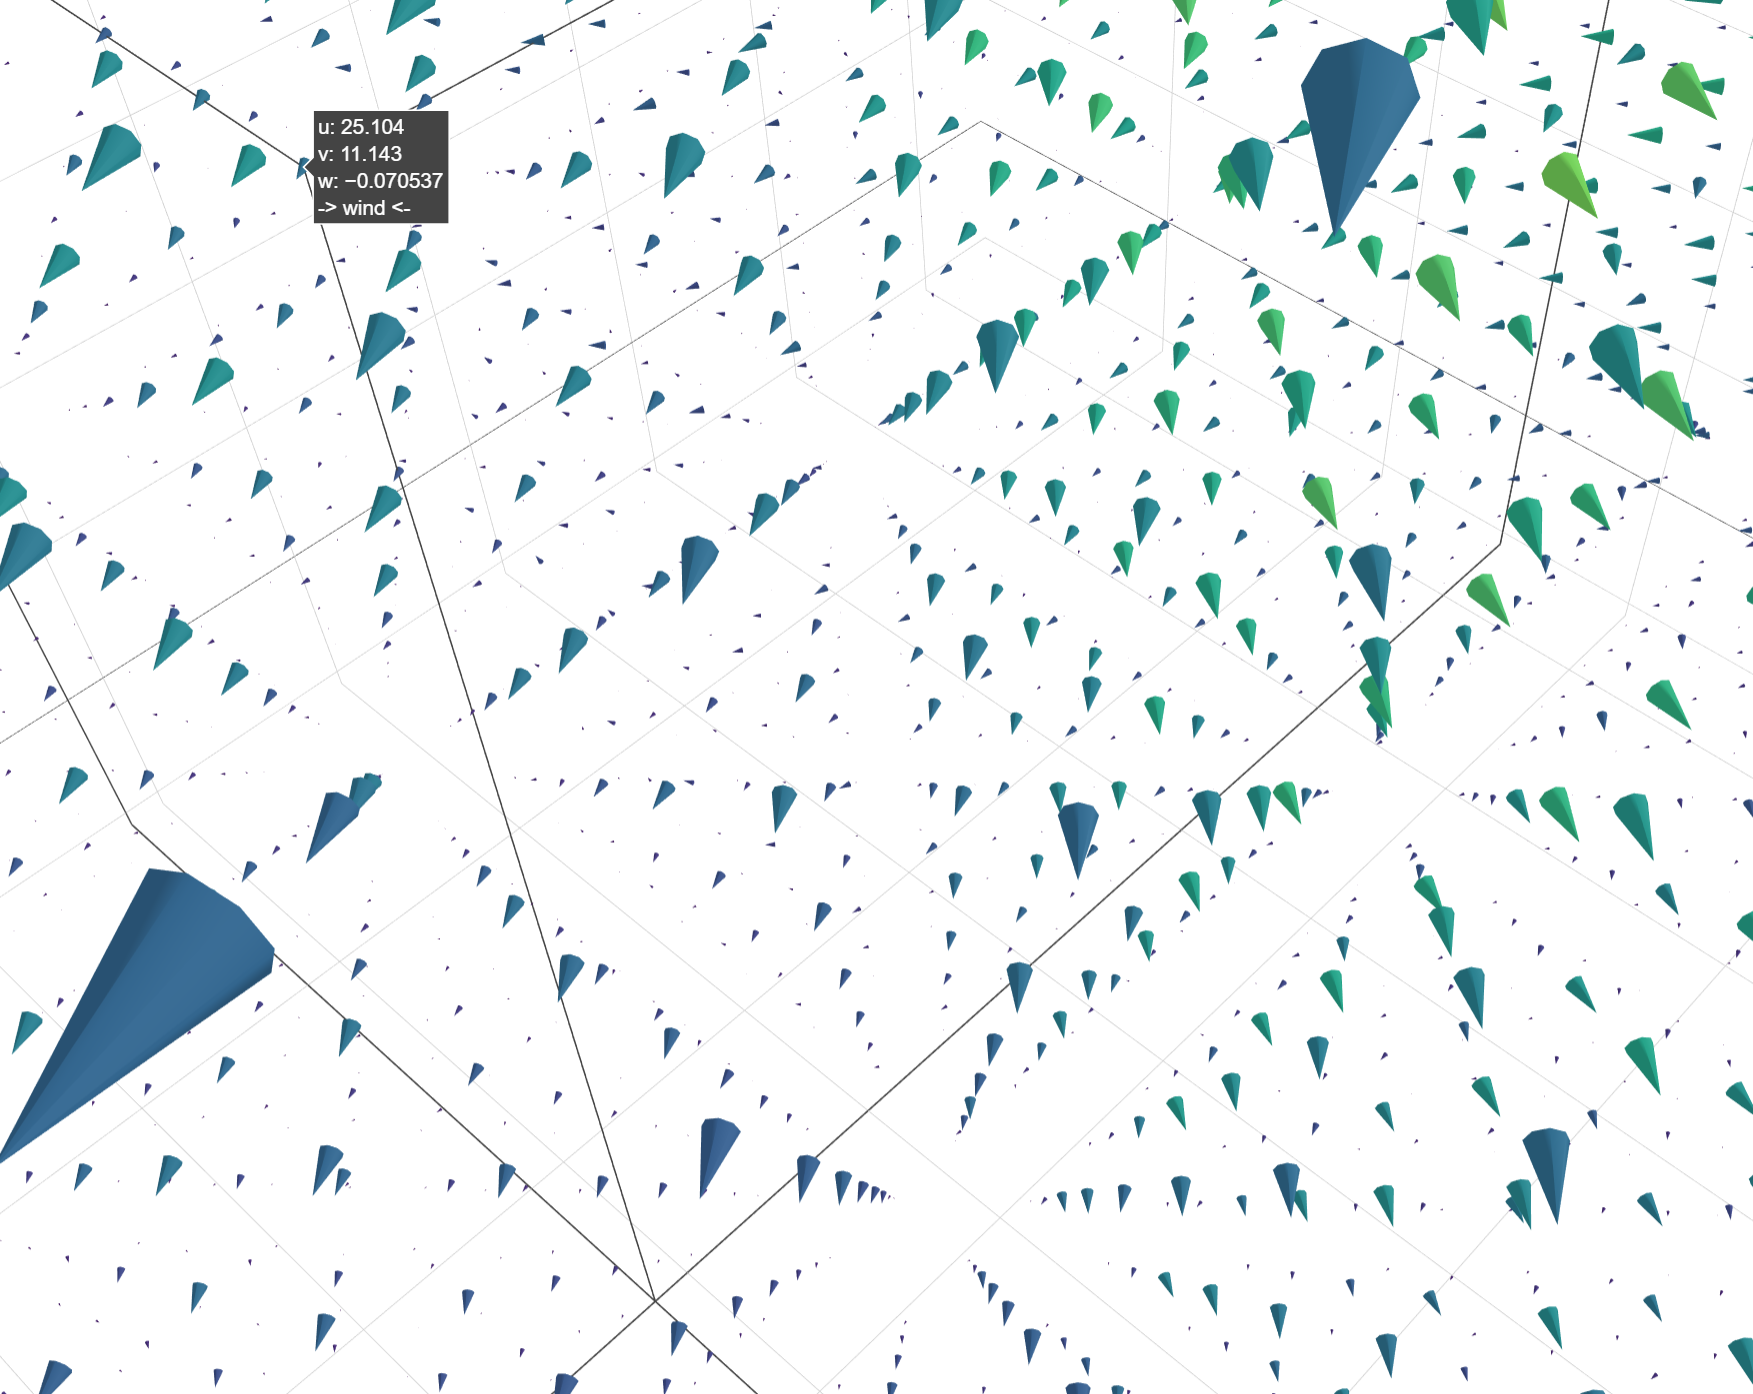
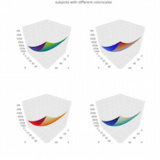
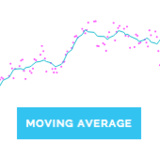
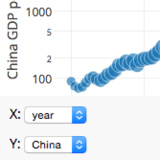
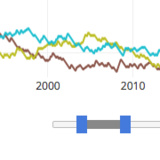
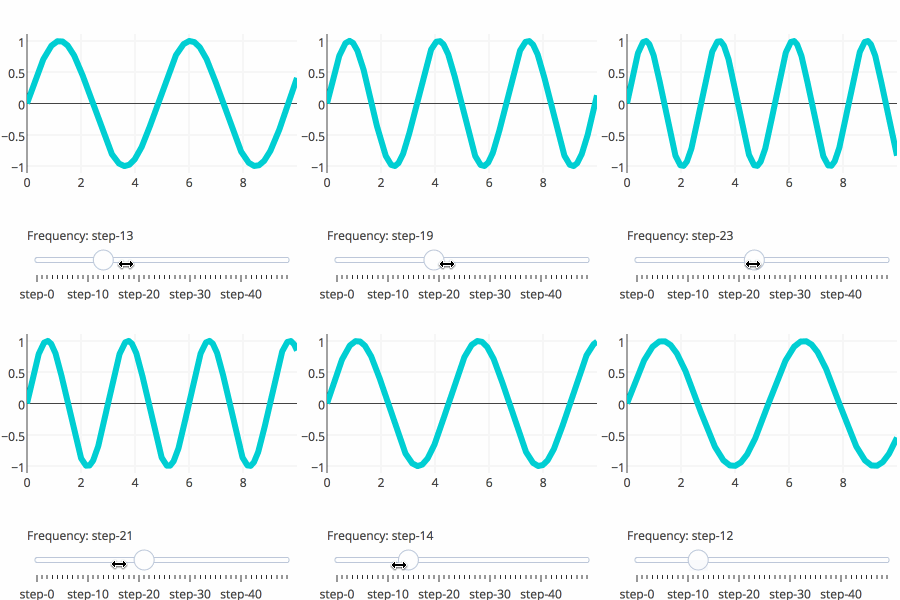
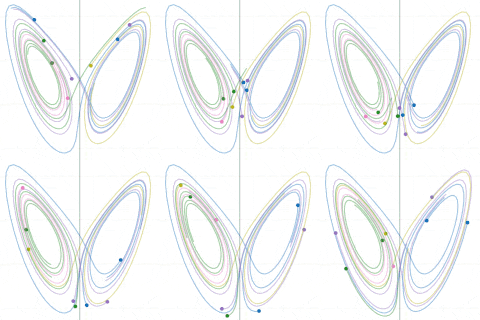
Plotly's R graphing library makes interactive, publication-quality graphs. Examples of how to make line plots, scatter plots, area charts, bar charts, error bars, box plots, histograms, heatmaps, subplots, multiple-axes, and 3D (WebGL based) charts.
Plotly.R is free and open source
and you can view the source, report issues or contribute on GitHub.
Plotly is known for its graphing libraries, but it's also a broader ecosystem for building interactive data apps, AI data analysis tools, and deploying and hosting Dash apps. Explore the full set of tools and platforms designed to help turn data into action. Discover Plotly.