MATLAB streamtube in MATLAB®
Learn how to make 2 streamtube charts in MATLAB, then publish them to the Web with Plotly.
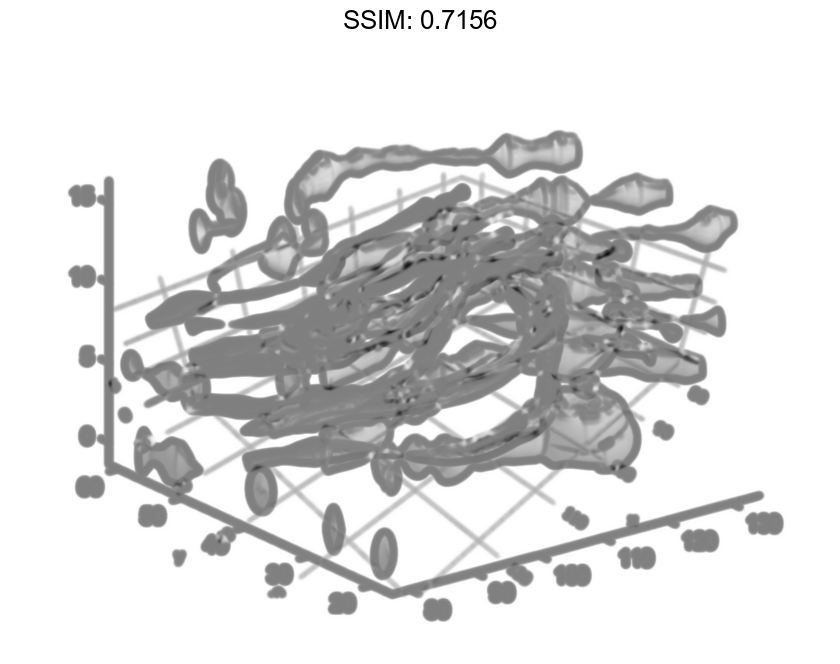
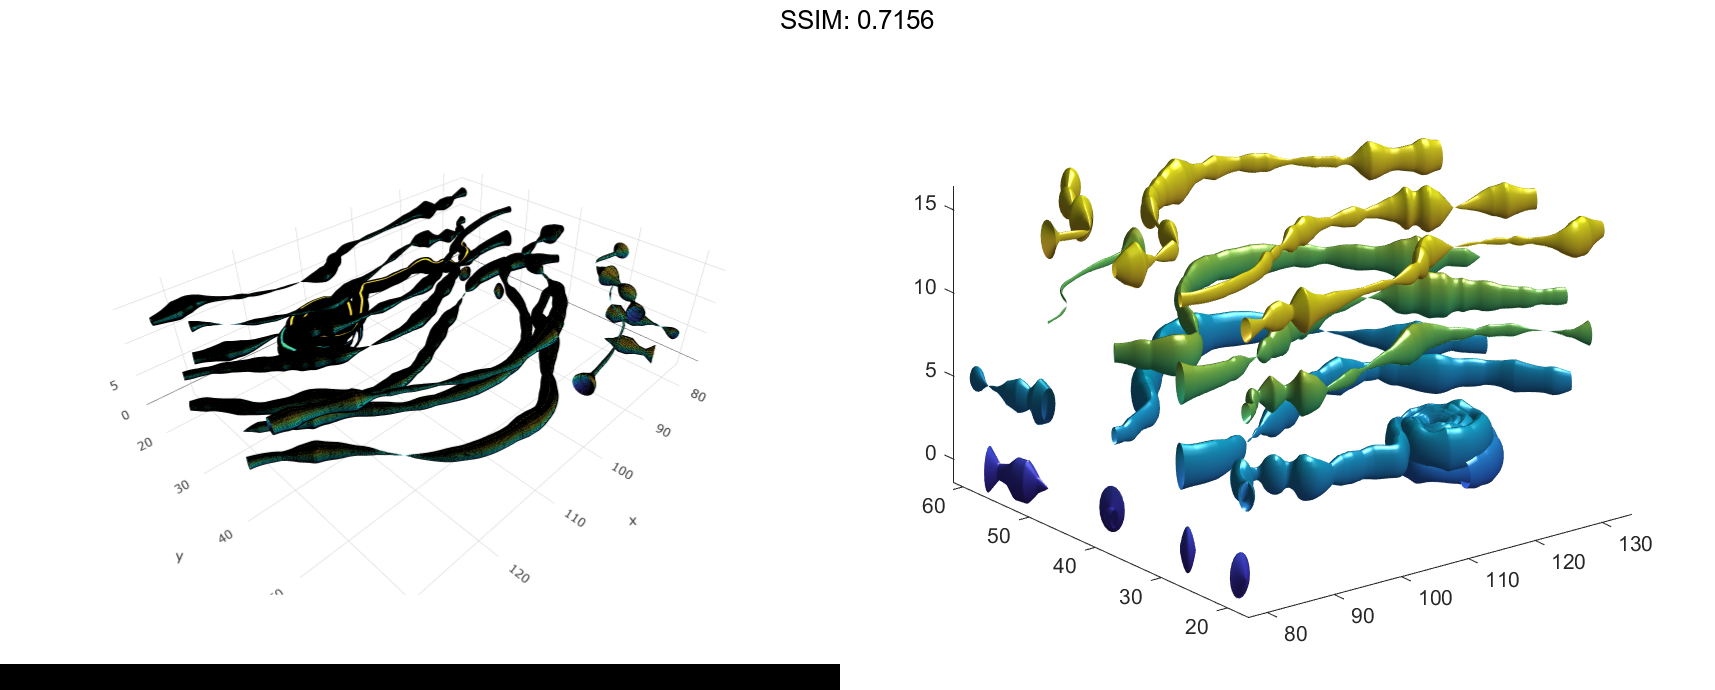
Visualize flow
Use the streamtube function to indicate flow in the wind data set. The inputs include the coordinates, vector field components, and starting location for the stream tubes.
load wind [sx,sy,sz] = meshgrid(80,20:10:50,0:5:15); streamtube(x,y,z,u,v,w,sx,sy,sz); view(3); axis tight shading interp; camlight; lighting gouraud fig2plotly()
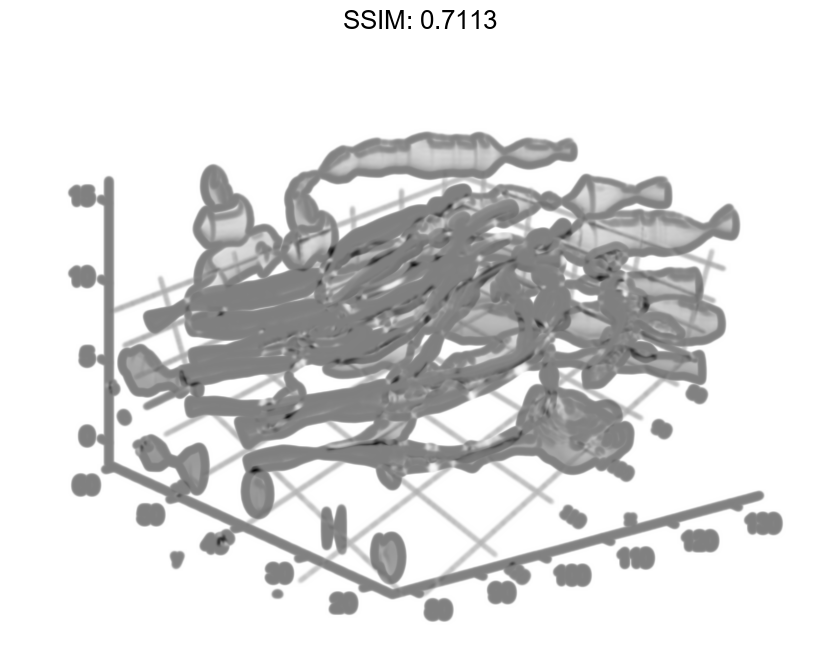
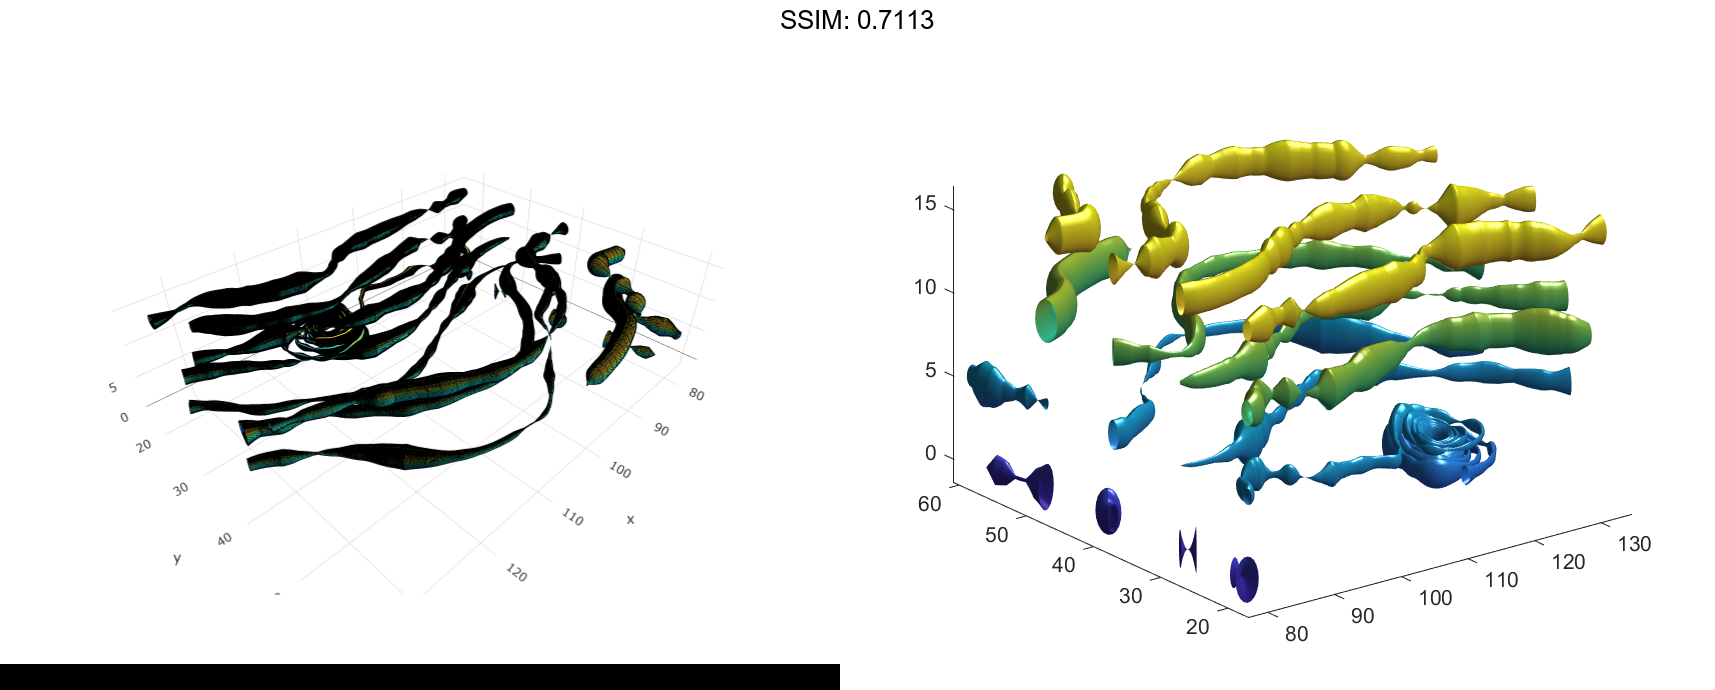
Visualize Flow Using Vertex Data and Divergence
Use vertex data returned by the stream3 function and divergence data to visualize flow.
load wind [sx,sy,sz] = meshgrid(80,20:10:50,0:5:15); verts = stream3(x,y,z,u,v,w,sx,sy,sz); div = divergence(x,y,z,u,v,w); streamtube(verts,x,y,z,-div); view(3); axis tight shading interp camlight lighting gouraud fig2plotly()