MATLAB streamribbon in MATLAB®
Learn how to make 4 streamribbon charts in MATLAB, then publish them to the Web with Plotly.
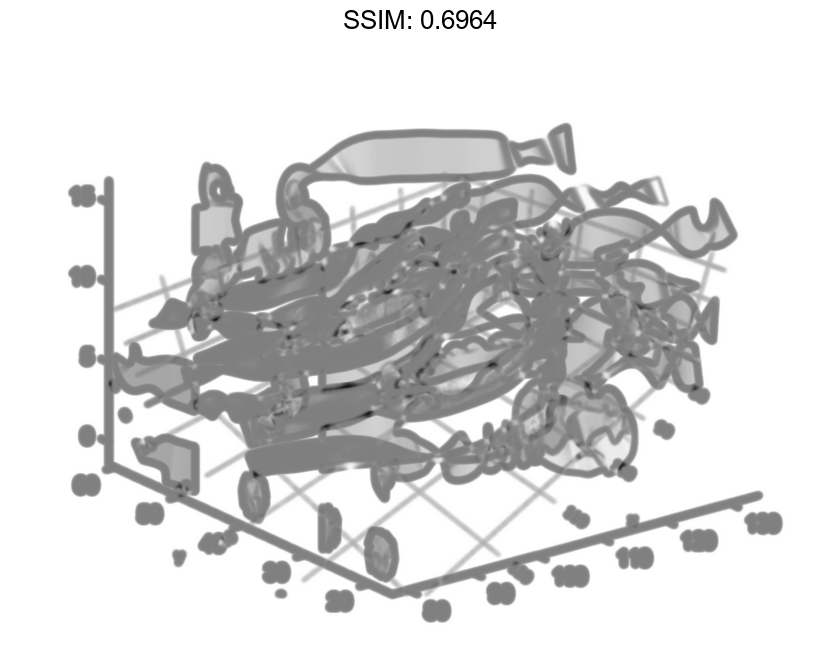
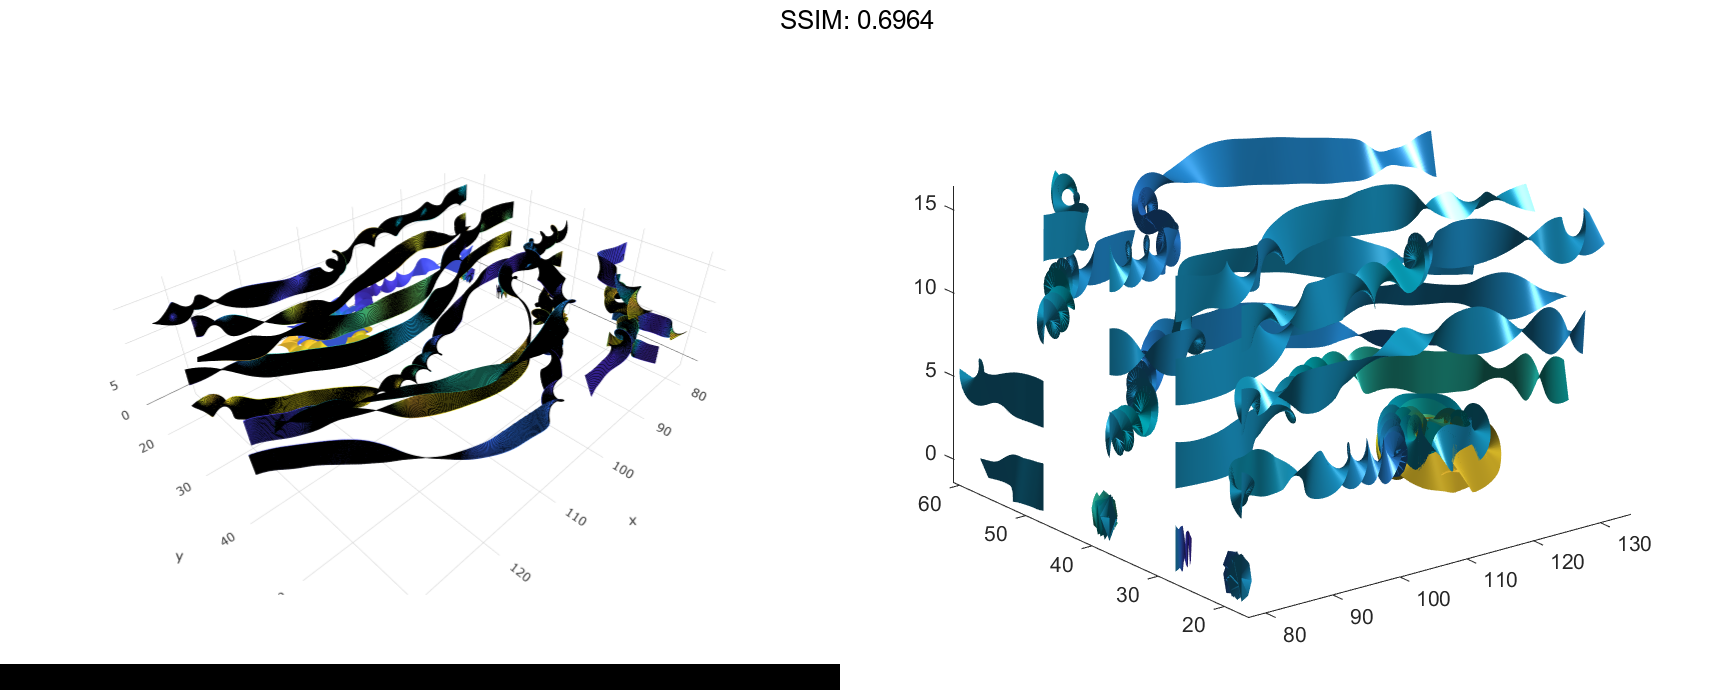
Use Stream Ribbons to Indicate Flow
Use stream ribbons to indicate the flow in a data set.
load wind
[sx,sy,sz] = meshgrid(80,20:10:50,0:5:15);
streamribbon(x,y,z,u,v,w,sx,sy,sz);
axis tight
shading interp
view(3);
camlight
lighting gouraud

fig2plotly()


Indicate Flow Using Precalculated Data
Use precalculated vertex data, curl average velocity, and speed to indicate flow.
load wind
[sx,sy,sz] = meshgrid(80,20:10:50,0:5:15);
verts = stream3(x,y,z,u,v,w,sx,sy,sz);
cav = curl(x,y,z,u,v,w);
spd = sqrt(u.^2 + v.^2 + w.^2).*.1;
streamribbon(verts,x,y,z,cav,spd);
axis tight
shading interp
view(3);
camlight;
lighting gouraud

fig2plotly()
Using precalculated data enables you to use values other than those calculated from the single data source. In this case, the speed is reduced by a factor of 10 compared to the previous example.
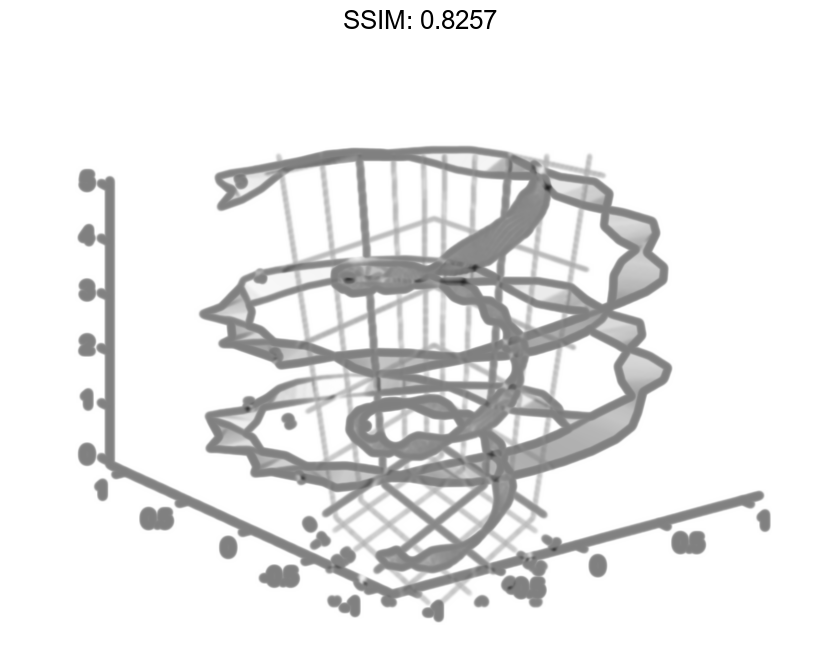
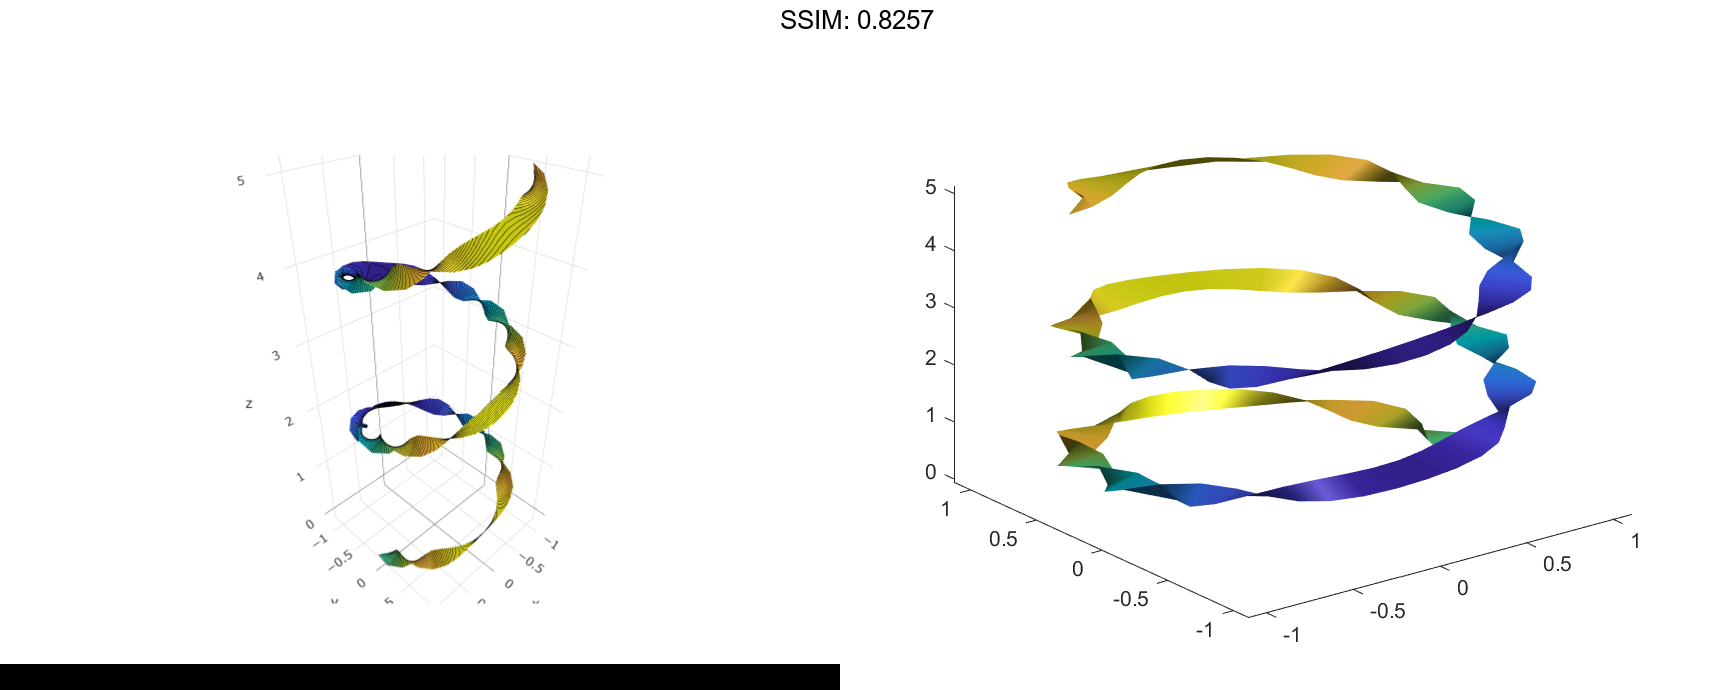
Stream Ribbon With Twist Angle
Specify a twist angle for the stream ribbon
t = 0:.15:15;
verts = {[cos(t)' sin(t)' (t/3)']};
twistangle = {cos(t)'};
streamribbon(verts,twistangle);
axis tight
shading interp
view(3)
camlight
lighting gouraud

fig2plotly()
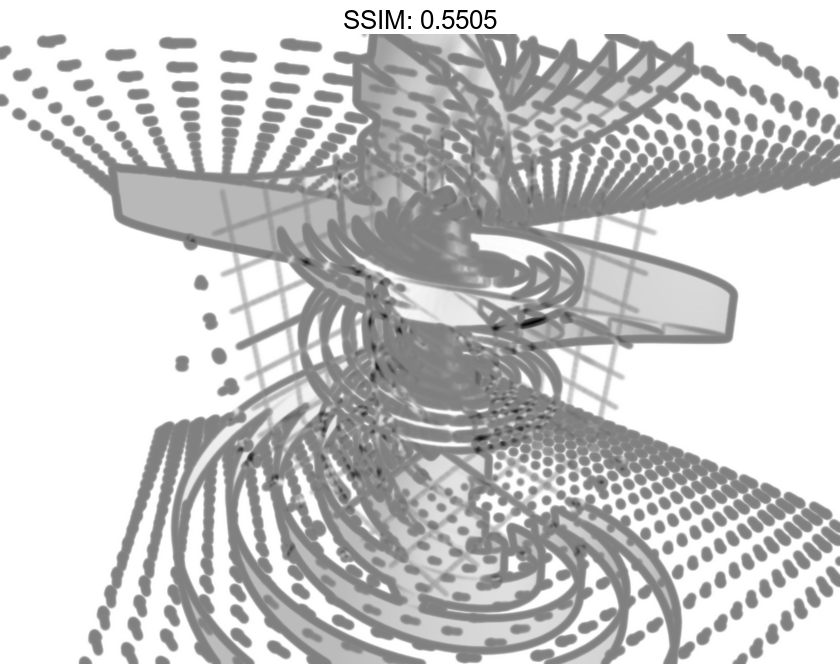
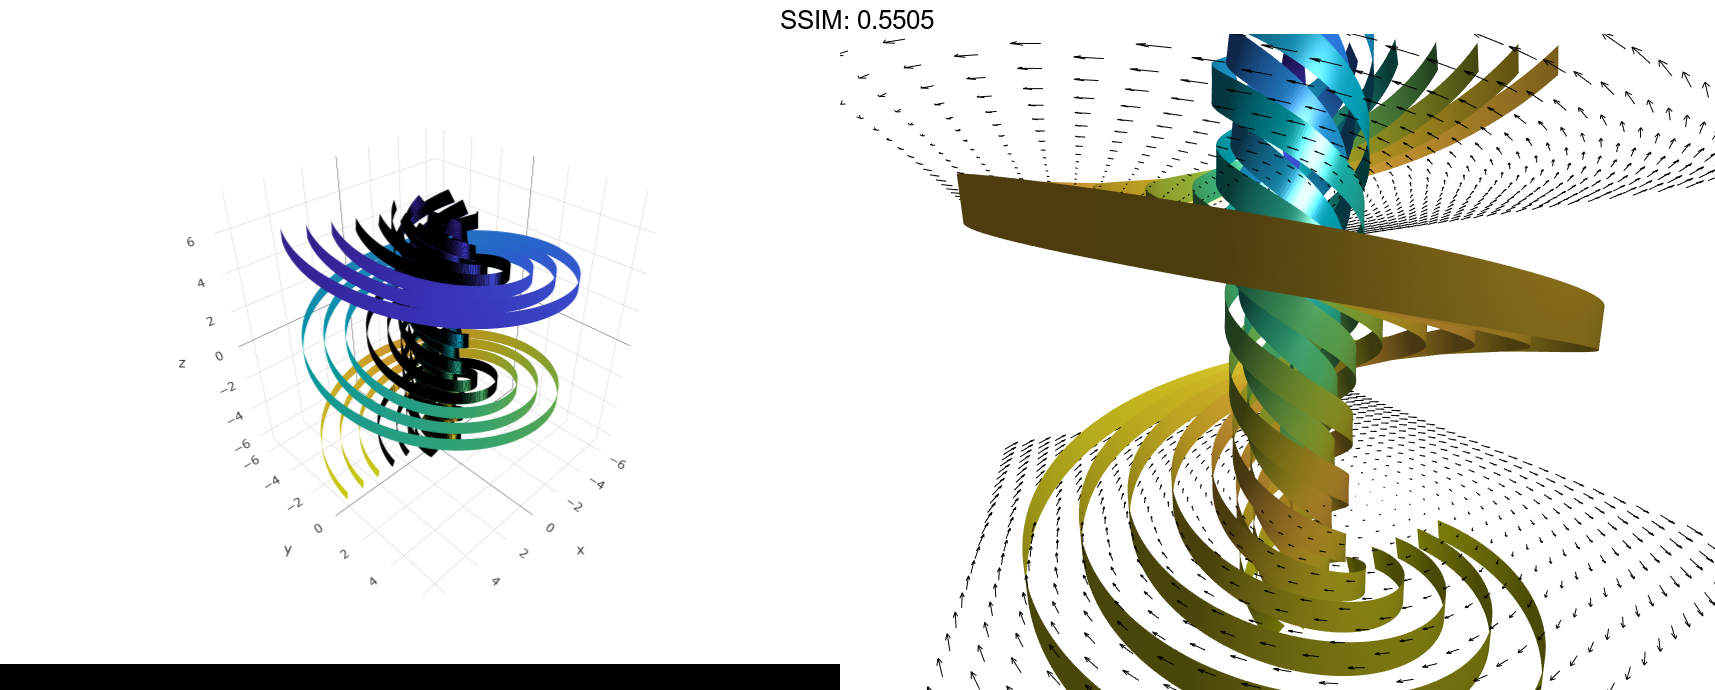
Combination of Cone and Stream Ribbon Plots
Create 3-D arrays and a cone plot.
xmin = -7; xmax = 7;
ymin = -7; ymax = 7;
zmin = -7; zmax = 7;
x = linspace(xmin,xmax,30);
y = linspace(ymin,ymax,20);
z = linspace(zmin,zmax,20);
[x,y,z] = meshgrid(x,y,z);
u = y;
v = -x;
w = 0*x+1;
[cx,cy,cz] = meshgrid(linspace(xmin,xmax,30),...
   linspace(ymin,ymax,30),[-3 4]);
h = coneplot(x,y,z,u,v,w,cx,cy,cz,'quiver');
set(h,'Color','k');

fig2plotly()
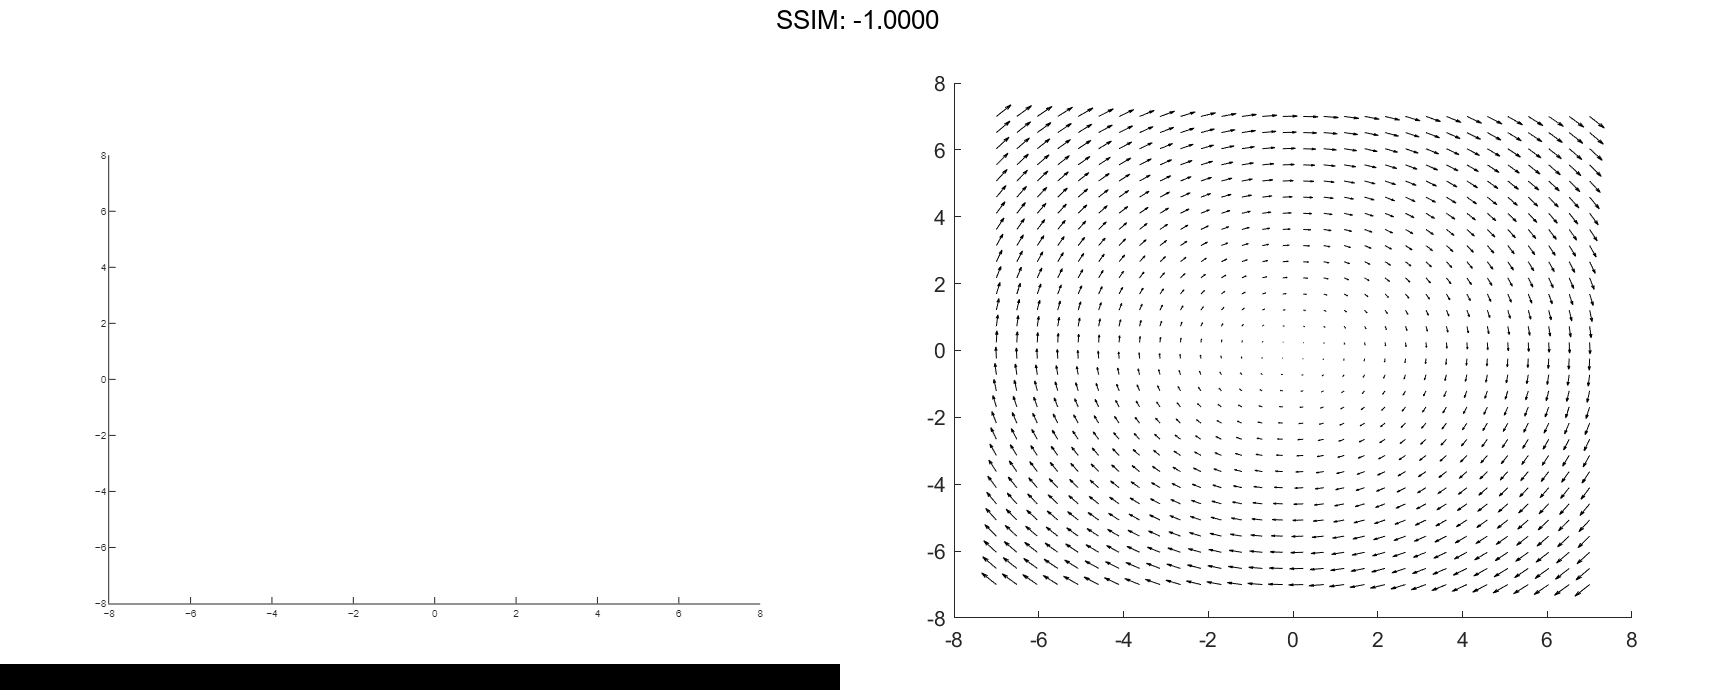

Plot two sets of stream ribbons. Then define the view and lighting.
[sx,sy,sz] = meshgrid([-1 0 1],[-1 0 1],-6);
streamribbon(x,y,z,u,v,w,sx,sy,sz);
[sx,sy,sz] = meshgrid([1:6],[0],-6);
streamribbon(x,y,z,u,v,w,sx,sy,sz);
shading interp
view(-30,10)
axis off tight
camproj perspective
camva(66)
camlookat
camdolly(0,0,.5,'fixtarget')
camlight

fig2plotly()