

MATLAB waterfall in MATLAB®
Learn how to make 4 waterfall charts in MATLAB, then publish them to the Web with Plotly.
Create Waterfall Plot
Create three matrices of the same size. Then plot them as a waterfall plot. The mesh plot uses Z for both height and color.
[X,Y] = meshgrid(-3:.125:3);
Z = peaks(X,Y);
waterfall(X,Y,Z)

fig2plotly()


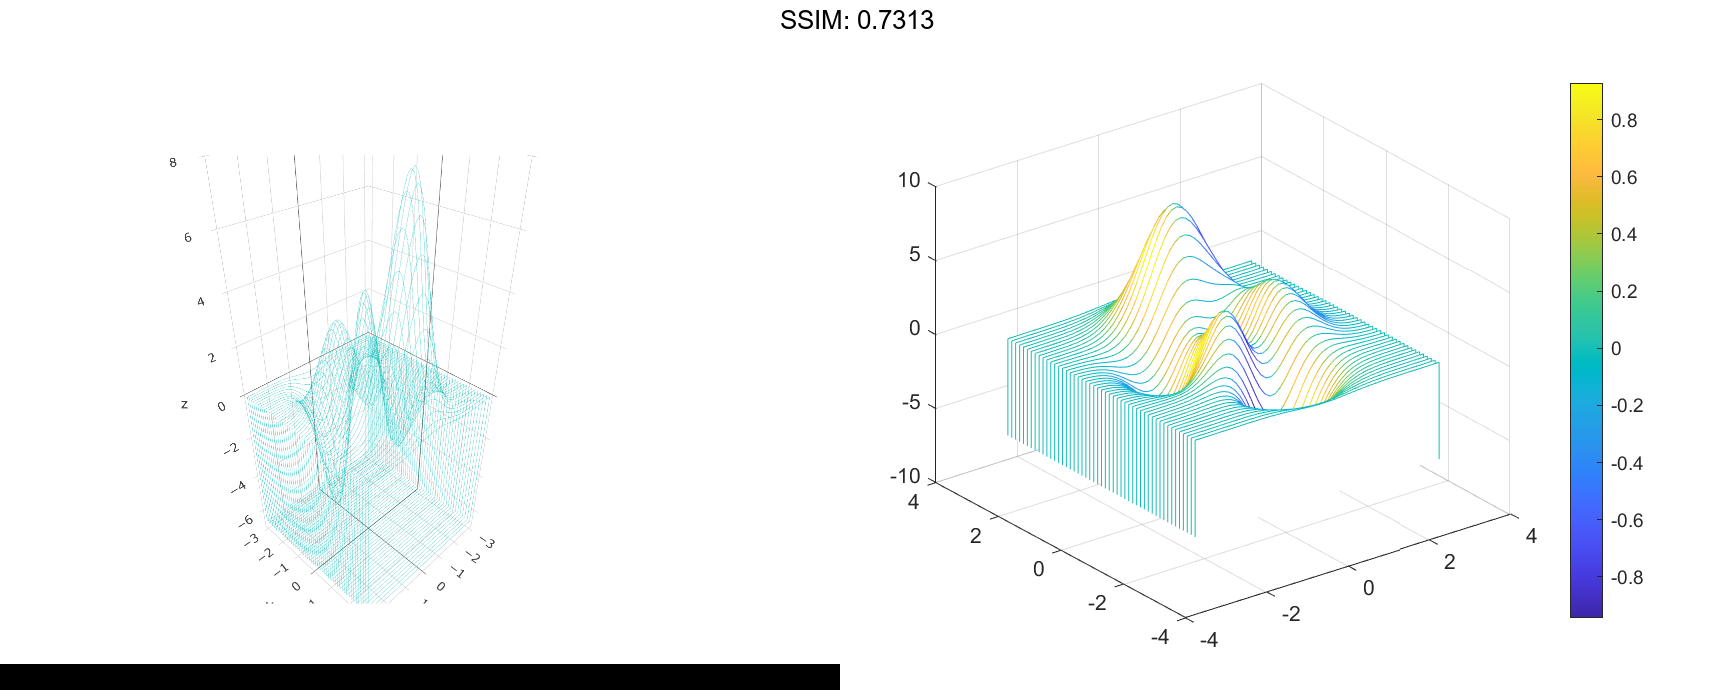
Specify Colormap Colors
Specify the colors for a waterfall plot by including a fourth matrix input, C. The waterfall plot uses Z for height and C for color. Add a color bar to the graph to show how the data values in C correspond to the colors in the colormap.
[X,Y] = meshgrid(-3:.125:3);
Z = peaks(X,Y);
C = gradient(Z);
waterfall(X,Y,Z,C)
colorbar

fig2plotly()

Modify Plot Appearance
Create a waterfall plot. To allow further modifications, assign the patch object to the variable p.
[X,Y] = meshgrid(-5:.5:5); Z = Y.sin(X) - X.cos(Y); p = waterfall(X,Y,Z)


p =
  Patch with properties:

    FaceColor: [1 1 1]
    FaceAlpha: 1
    EdgeColor: 'flat'
    LineStyle: '-'
        Faces: [21x26 double]
     Vertices: [546x3 double]

  Show all properties
p.EdgeColor = 'b';

fig2plotly()


Change Curtain Location
Display a partial curtain along the x-dimension (instead of the y-dimension) by transposing the input arguments.
[X,Y] = meshgrid(-3:.125:3);
Z = peaks(X,Y);
waterfall(X',Y',Z')

fig2plotly()

