MATLAB surfl in MATLAB®
Learn how to make 3 surfl charts in MATLAB, then publish them to the Web with Plotly.
Create Surface Plot With Colormap-Based Lighting
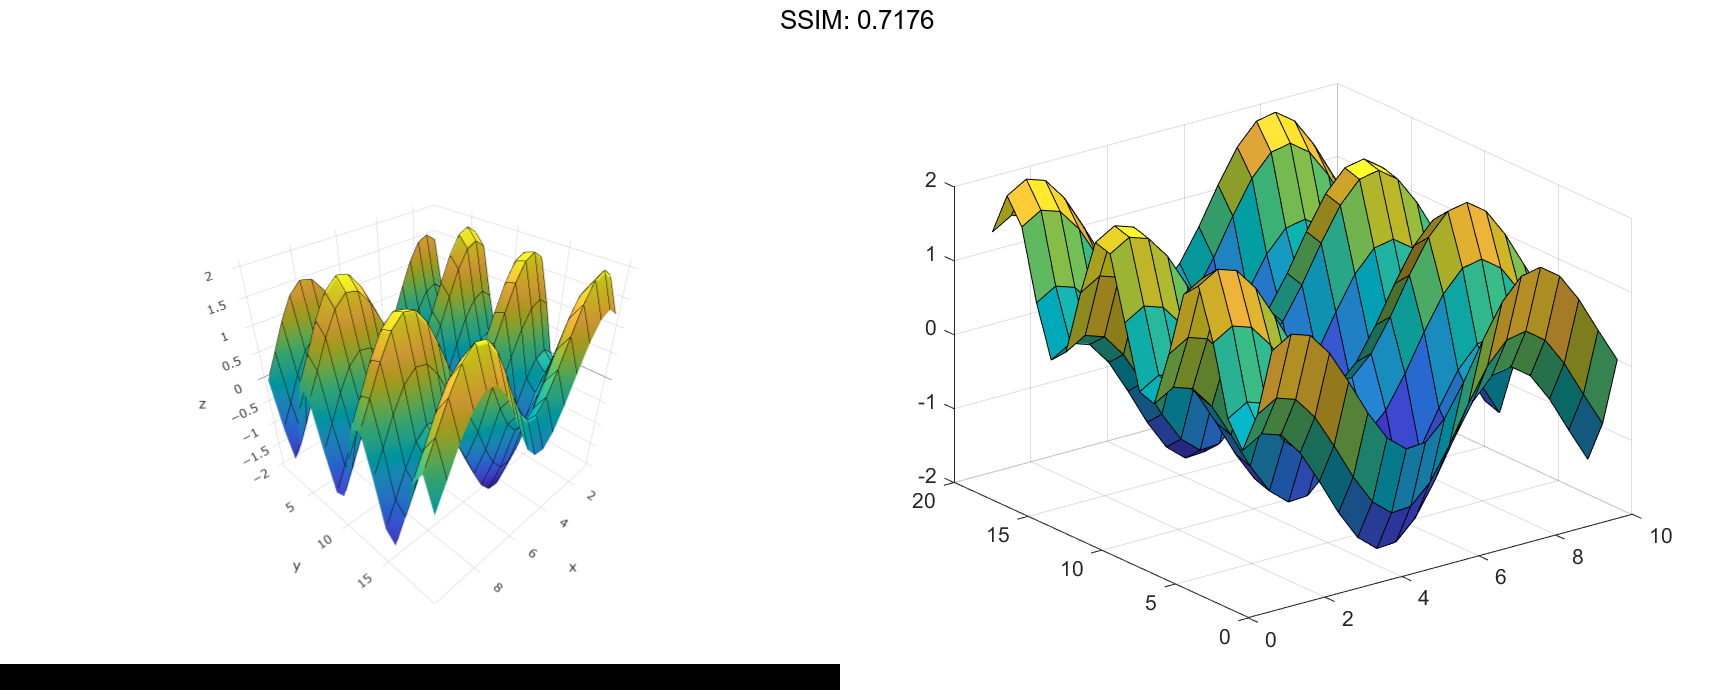
Create three matrices of the same size. Then plot them as a surface using colormap-based lighting. The surface uses Z for height and both Z and the light source for color.
[X,Y] = meshgrid(1:0.5:10,1:20);
Z = sin(X) + cos(Y);
surfl(X,Y,Z)

fig2plotly()


Create Surface Plot With Light Object
Create three matrices of the same size. Then plot them as a surface with highlights from a MATLAB® light object. The surface uses Z for height and both Z and the light object for color. The function returns an array containing a surface object and a lighting object. Assign it to the variable sl.
[X,Y] = meshgrid(1:0.5:10,1:20); Z = sin(X) + cos(Y); sl = surfl(X,Y,Z,'light');


Index into sl to access and modify properties of the surface object and the light object after they are created. The surface plot is accessible as sl(1) and the light object as sl(2). For example, change the color of the light by setting the Color property of the light object.
sl(2).Color = 'r';

fig2plotly()


Specify Light Direction and Reflectance for Surface Plot
Create three matrices of the same size to plot as a surface. Specify the direction of the light source to have an azimuth of 45 degrees and an elevation of 20 degrees. Increase the reflectance of the surface by increasing the contribution of ambient light and decreasing the contibutions of diffused and specular reflection. Assign the surface object to the variable sl.
[X,Y] = meshgrid(1:0.5:10,1:20); Z = sin(X) + cos(Y); s = [-45 20]; k = [.65 .4 .3 10];
Plot the data using the source and reflectance vectors.
sl = surfl(X,Y,Z,s,k);


Use sl to access and modify properties of the surface object after it is created. For example, hide the edges by setting the EdgeColor property.
sl.EdgeColor = 'none';

fig2plotly()


