MATLAB surfc in MATLAB®
Learn how to make 4 surfc charts in MATLAB, then publish them to the Web with Plotly.
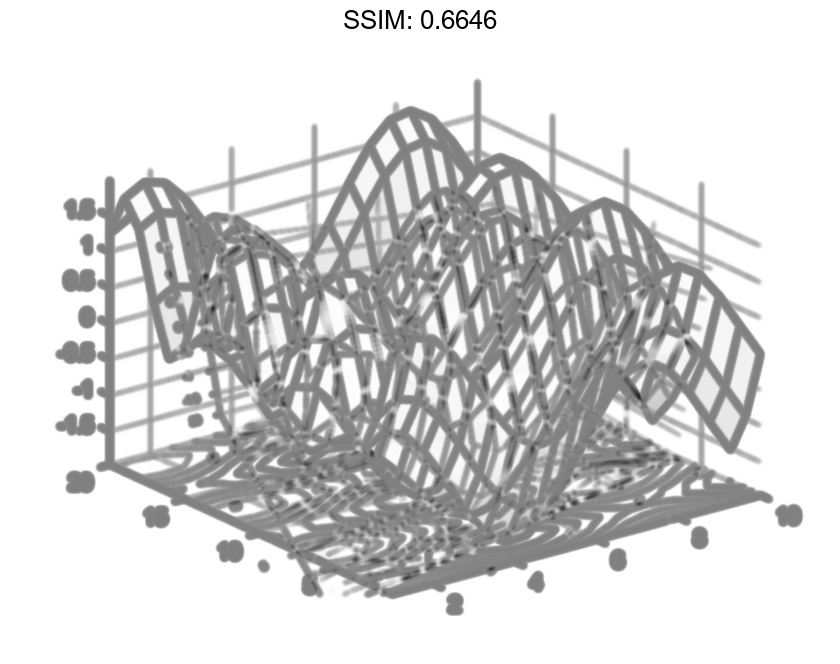
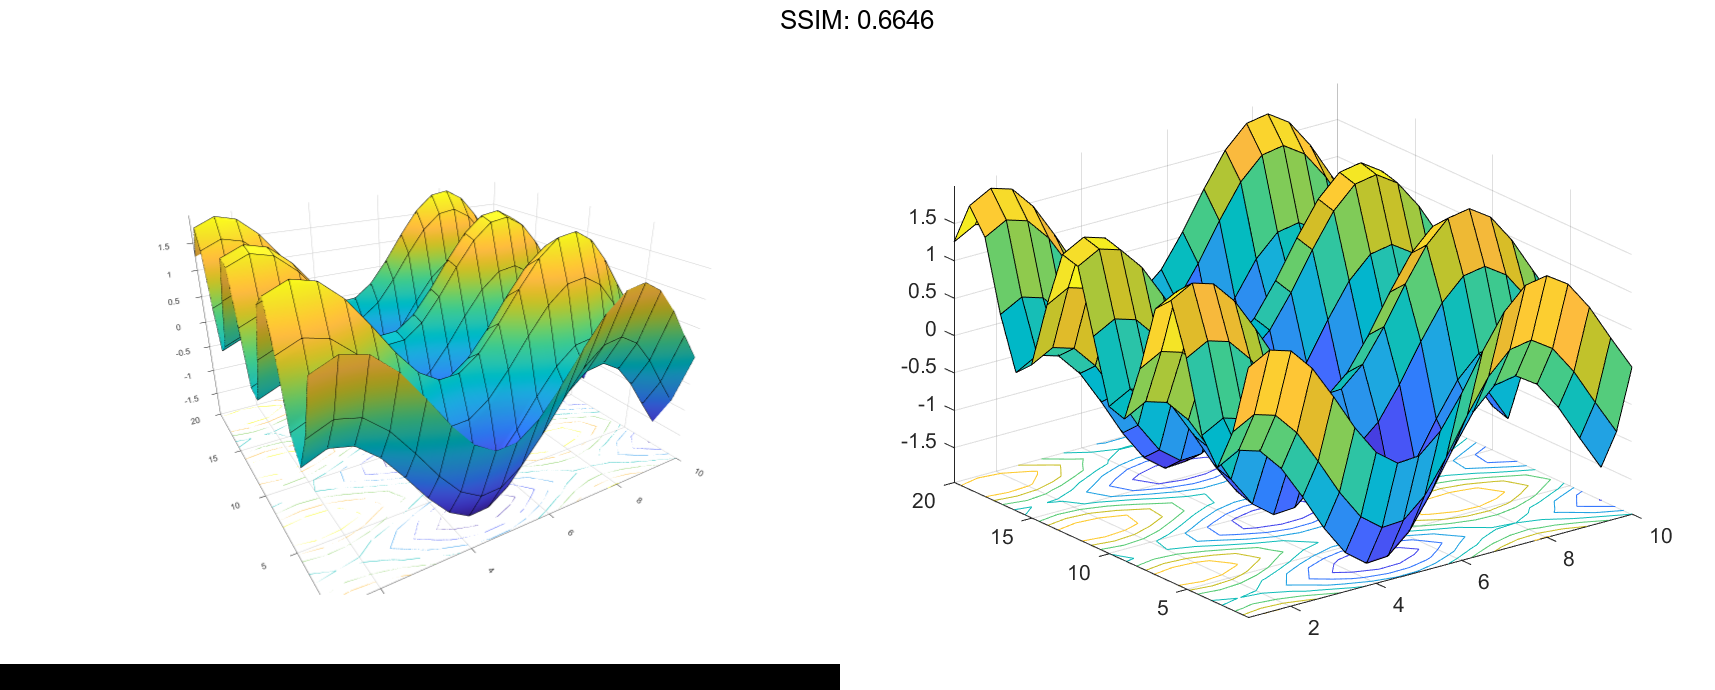
Display Contour Plot Under Surface Plot
Create three matrices of the same size. Then plot them as a surface and display a contour plot under the surface plot. The surface uses Z for both height and color.
[X,Y] = meshgrid(1:0.5:10,1:20);
Z = sin(X) + cos(Y);
surfc(X,Y,Z)

fig2plotly('TreatAs', 'surfc')
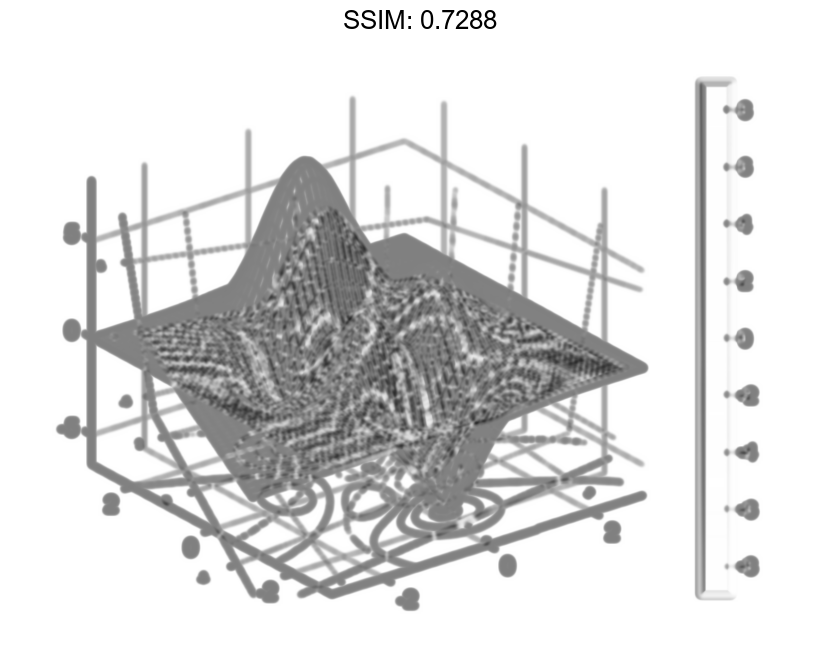
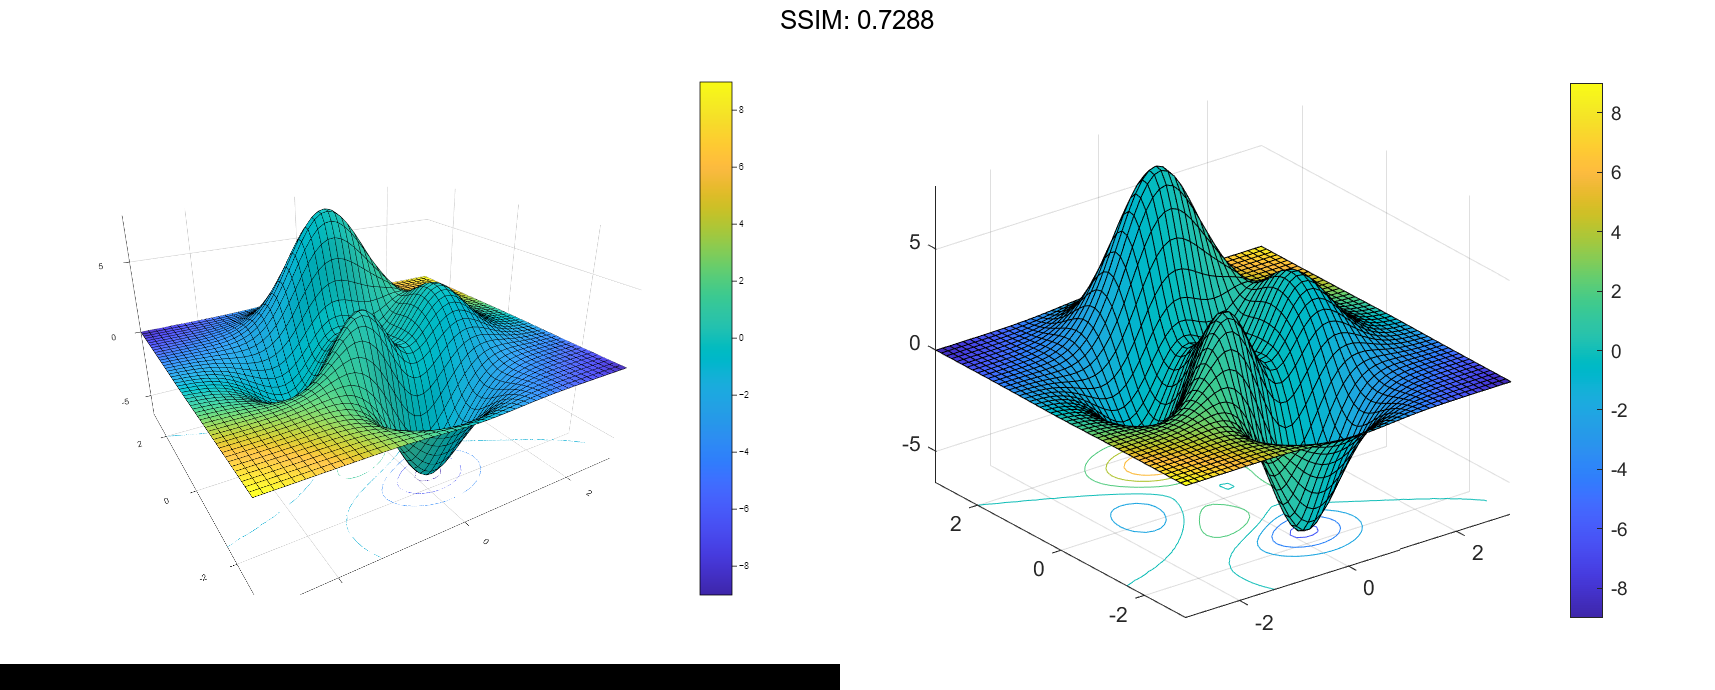
Specify Colormap Colors for Surface and Contour Plot
Specify the colors for a surface and a contour plot by including a fourth matrix input, C. The surface plot uses Z for height and C for color. Specify the colors using a colormap, which uses single numbers to stand for colors on a spectrum. When you use a colormap, C is the same size as Z. Add a color bar to the graph to show how the data values in C correspond to the colors in the colormap.
[X,Y] = meshgrid(-3:.125:3);
Z = peaks(X,Y);
C = X.*Y;
surfc(X,Y,Z,C)
colorbar

fig2plotly('TreatAs', 'surfc')
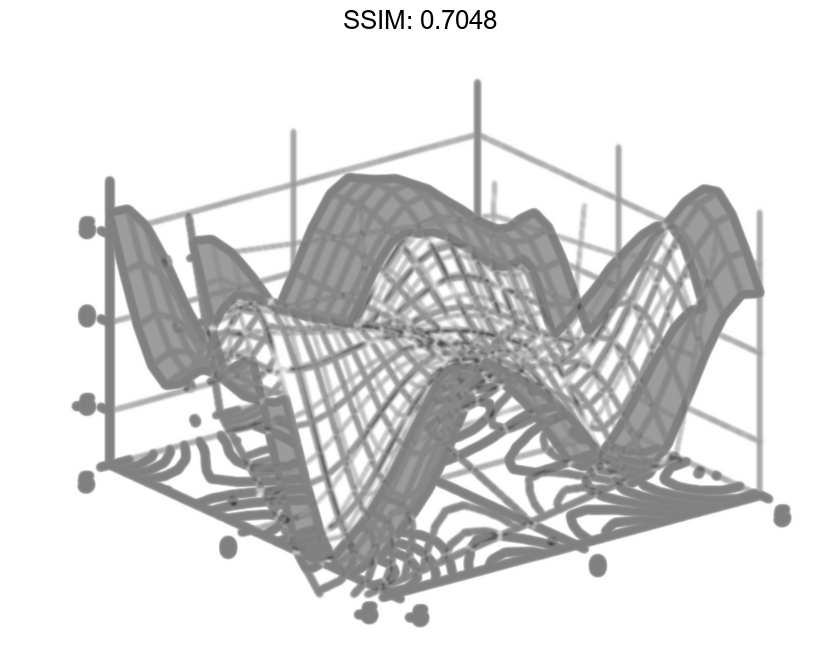
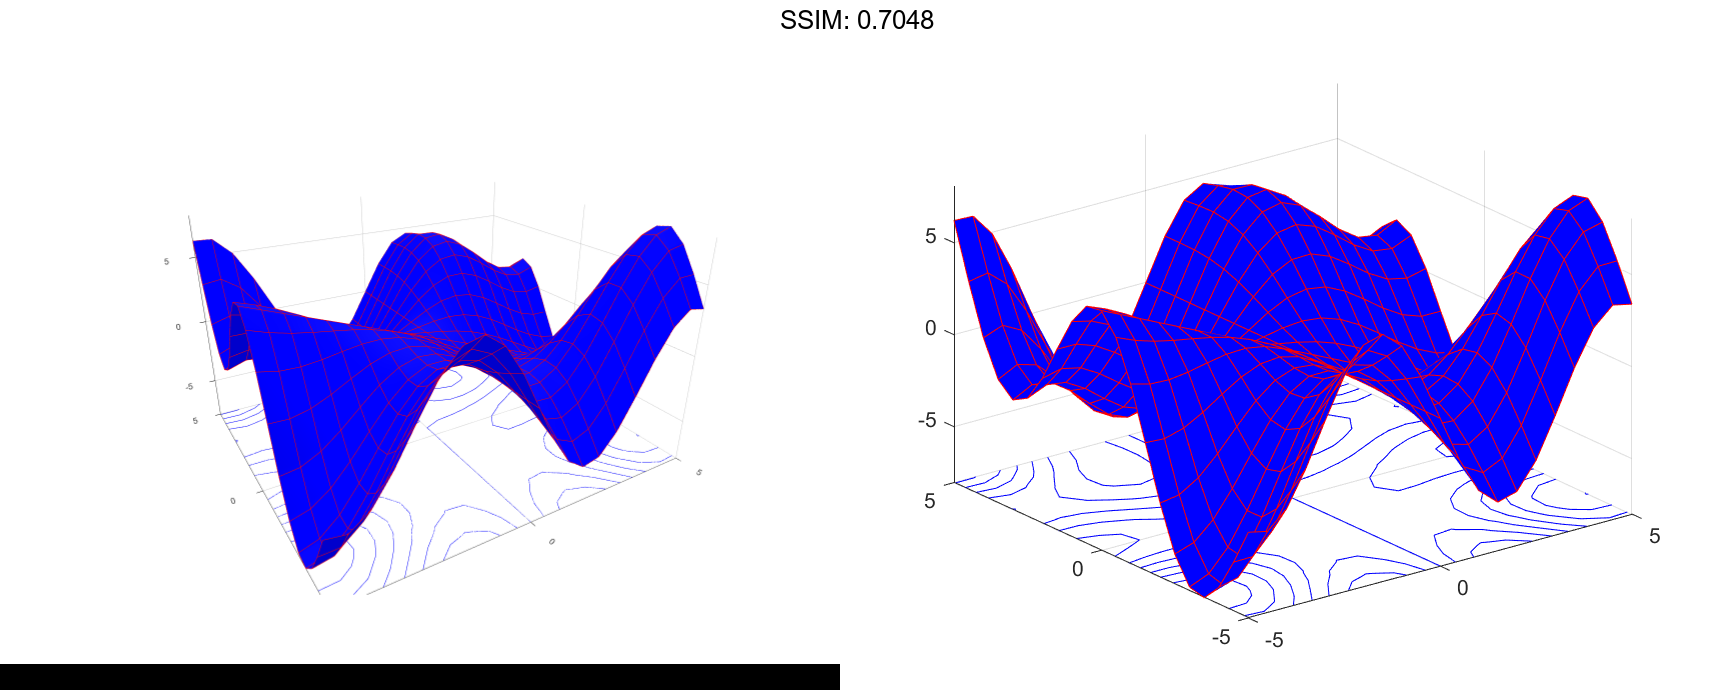
Modify Appearance of Surface and Contour Plots
Create a blue surface plot with a contour plot underneath it by specifying the FaceColor name-value pair with 'b' as the value. To allow further modifications, assign the graphics array containing the surface and contour objects to the variable sc.
[X,Y] = meshgrid(-5:.5:5); Z = Y.sin(X) - X.cos(Y); sc = surfc(X,Y,Z,'FaceColor','b');
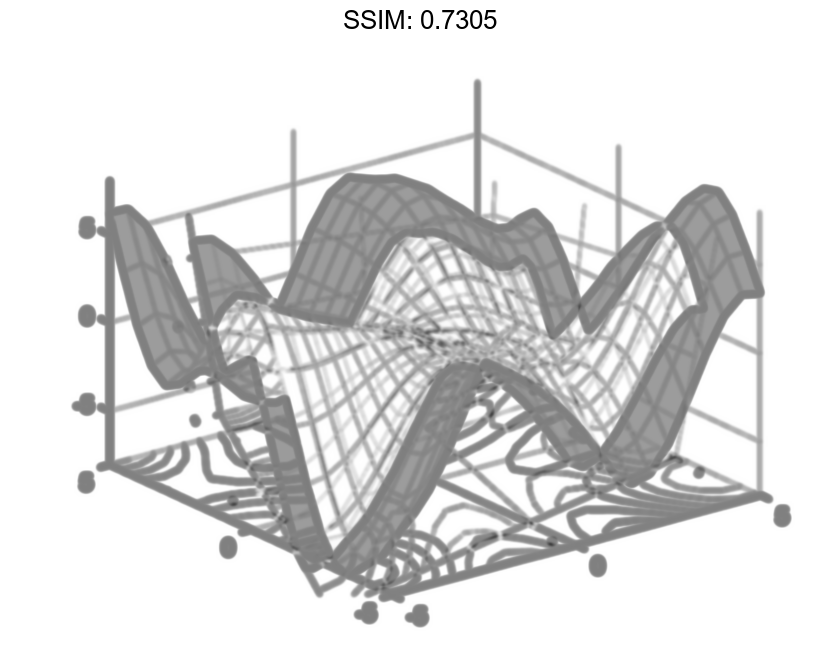
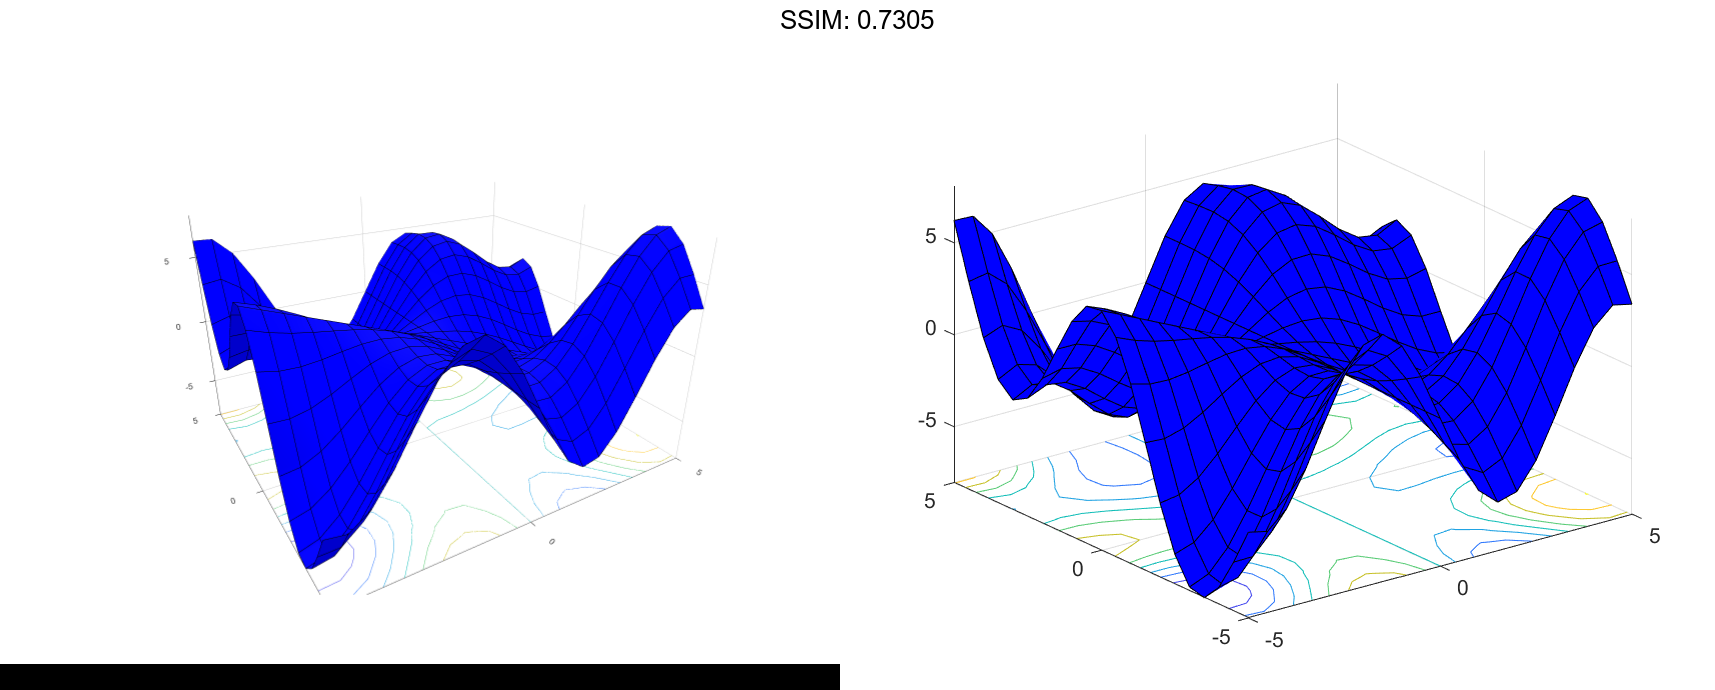
Index into sc to access and modify properties of the surface and contour plots after they are created. The surface plot is accessible as sc(1) and the contour plot as sc(2). For example, change the edge colors of the two plots by setting the EdgeColor properties.
sc(1).EdgeColor = 'r';
sc(2).EdgeColor = 'b';

fig2plotly('TreatAs', 'surfc')
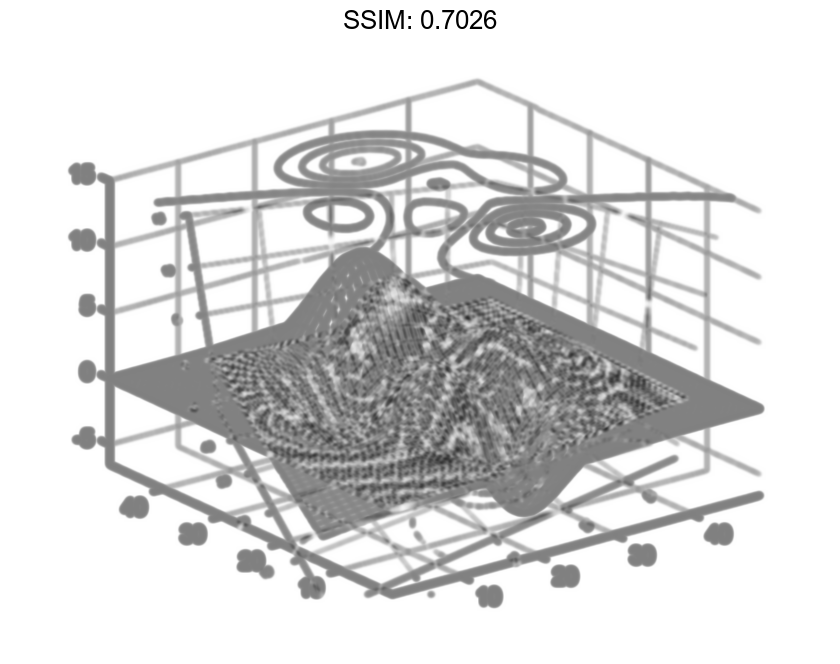
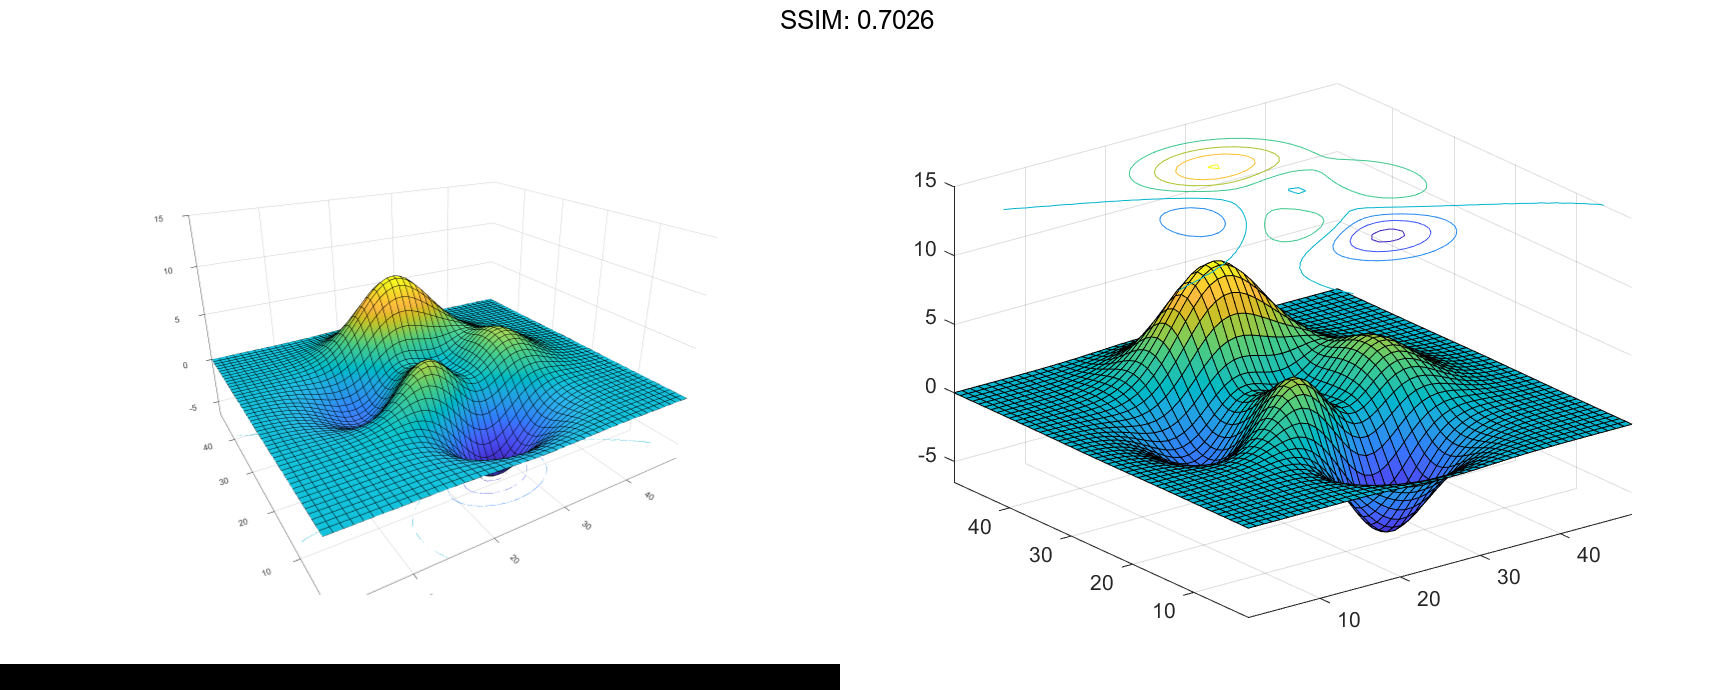
Change Location of Contour Lines
The contour lines appear at the minimum z-level by default, but you can change the location by setting the ZLocation property.
Display the peaks data set as a surface plot with the contours at the minimum z-level. Specify a return argument when you call the surfc function so that you can access the Contour object.
Z = peaks; sc = surfc(Z);
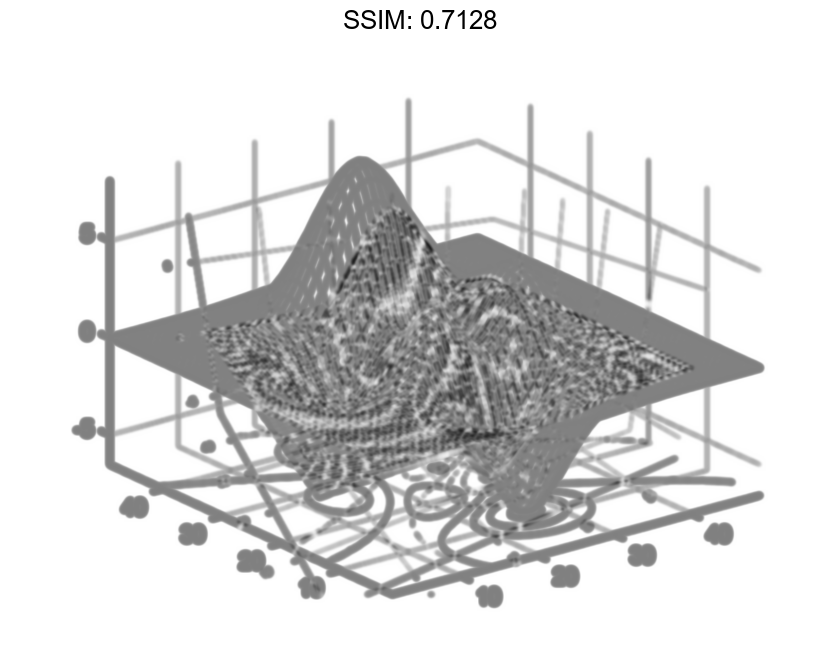
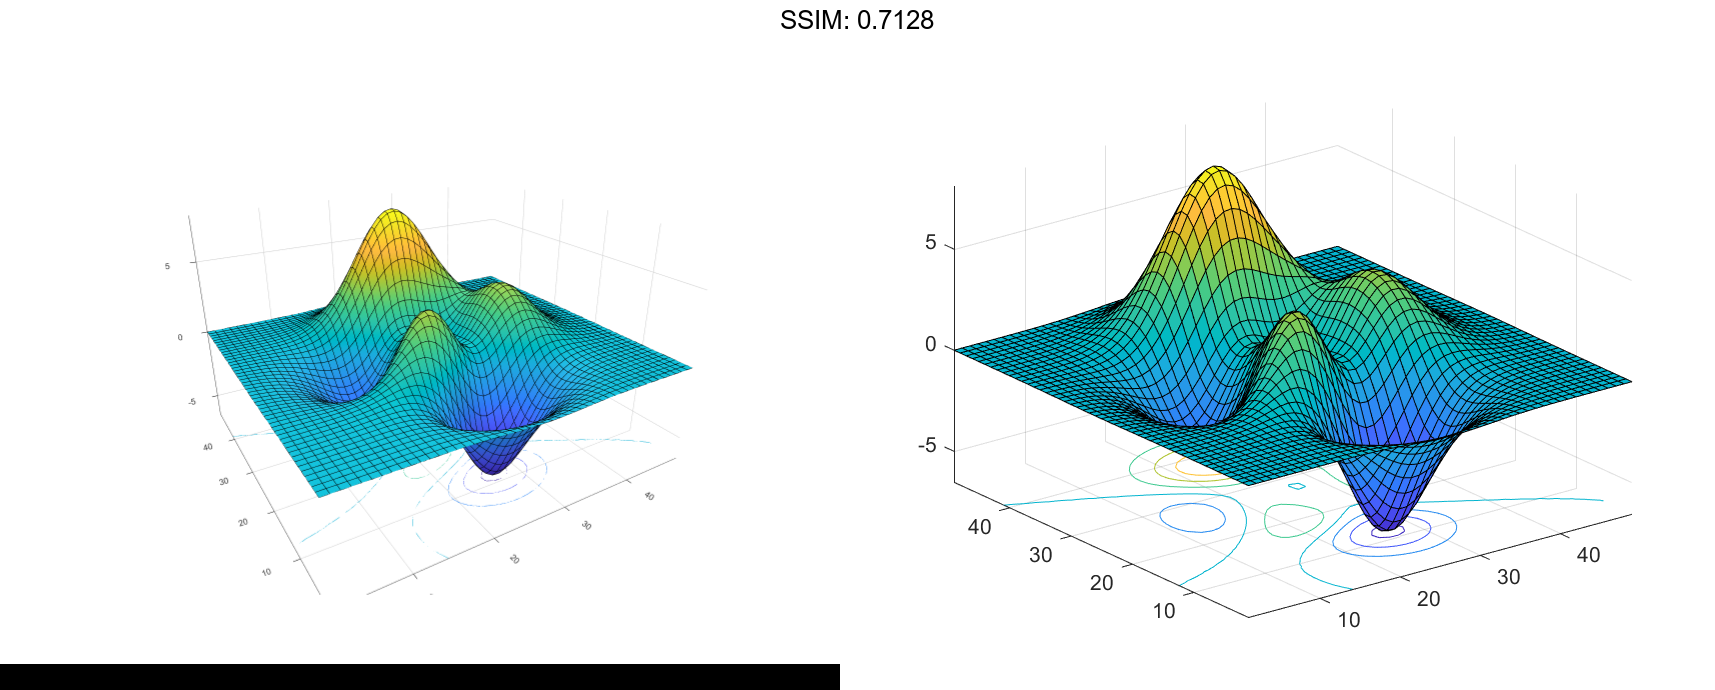
Get the current axes and extend the upper limit of the z-axis to 15. Then move the contours to the maximum z-level.
ax = gca;
ax.ZLim(2) = 15;
sc(2).ZLocation = 'zmax';

fig2plotly('TreatAs', 'surfc')