

MATLAB surf in MATLAB®
Learn how to make 4 surf charts in MATLAB, then publish them to the Web with Plotly.
Create Surface Plot
Create three matrices of the same size. Then plot them as a surface. The surface plot uses Z for both height and color.
[X,Y] = meshgrid(1:0.5:10,1:20);
Z = sin(X) + cos(Y);
surf(X,Y,Z)

fig2plotly('TreatAs', 'surf')


Specify Colormap Colors for Surface Plot
Specify the colors for a surface plot by including a fourth matrix input, C. The surface plot uses Z for height and C for color. Specify the colors using a colormap, which uses single numbers to stand for colors on a spectrum. When you use a colormap, C is the same size as Z. Add a color bar to the graph to show how the data values in C correspond to the colors in the colormap.
[X,Y] = meshgrid(1:0.5:10,1:20);
Z = sin(X) + cos(Y);
C = X.*Y;
surf(X,Y,Z,C)
colorbar

fig2plotly('TreatAs', 'surf')


Specify True Colors for Surface Plot
Specify the colors for a surface plot by including a fourth matrix input, CO. The surface plot uses Z for height and CO for color. Specify the colors using truecolor, which uses triplets of numbers to stand for all possible colors. When you use truecolor, if Z is m-by-n, then CO is m-by-n-by-3. The first page of the array indicates the red component for each color, the second page indicates the green component, and the third page indicates the blue component.
[X,Y,Z] = peaks(25);
CO(:,:,1) = zeros(25); % red
CO(:,:,2) = ones(25).*linspace(0.5,0.6,25); % green
CO(:,:,3) = ones(25).*linspace(0,1,25); % blue
surf(X,Y,Z,CO)

fig2plotly('TreatAs', 'surf')


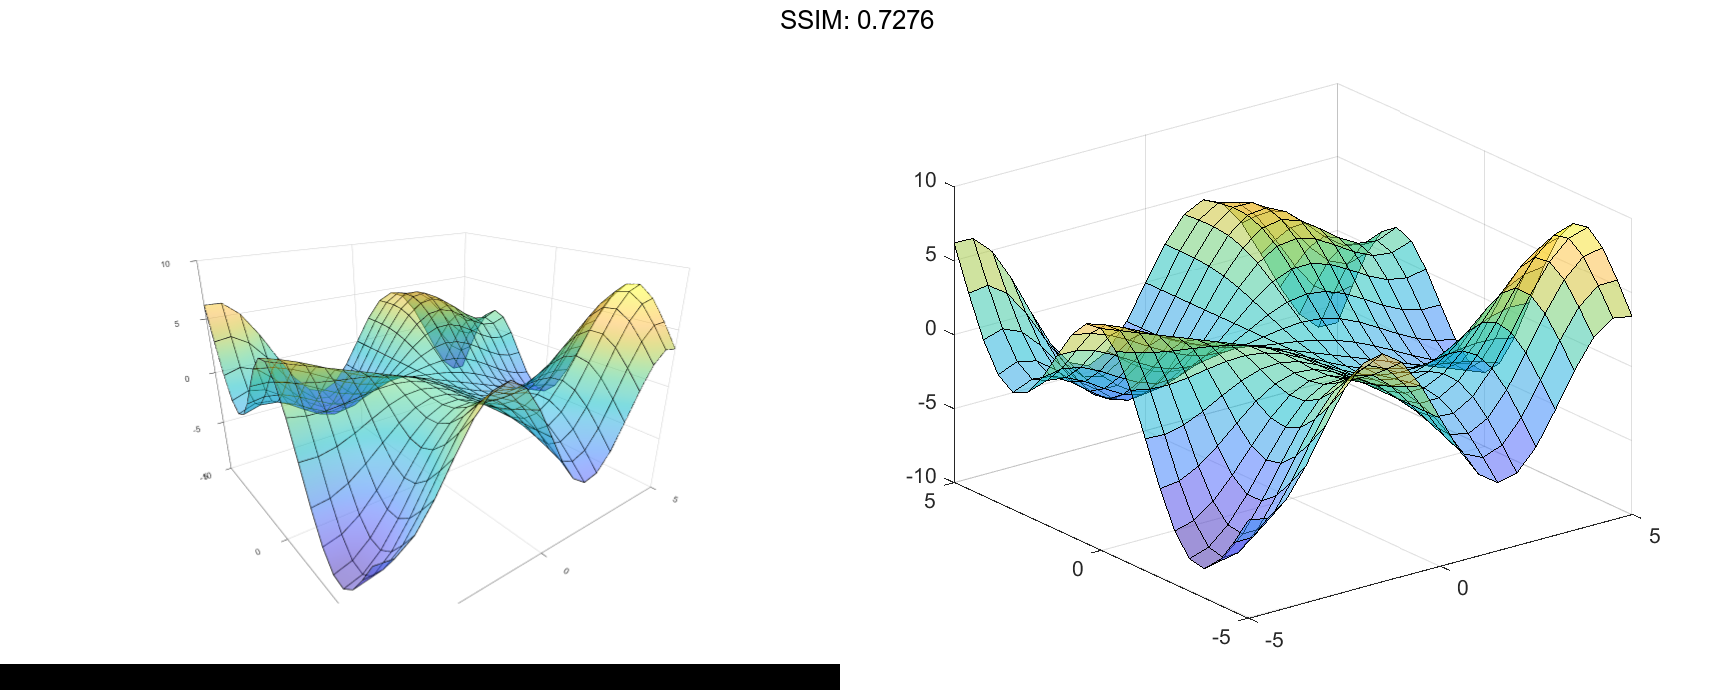
Modify Surface Plot Appearance
Create a semitransparent surface by specifying the FaceAlpha name-value pair with 0.5 as the value. To allow further modifications, assign the surface object to the variable s.
[X,Y] = meshgrid(-5:.5:5); Z = Y.sin(X) - X.cos(Y); s = surf(X,Y,Z,'FaceAlpha',0.5)

s =
  Surface with properties:

       EdgeColor: [0 0 0]
       LineStyle: '-'
       FaceColor: 'flat'
    FaceLighting: 'flat'
       FaceAlpha: 0.5000
           XData: [21x21 double]
           YData: [21x21 double]
           ZData: [21x21 double]
           CData: [21x21 double]

  Show all properties
s.EdgeColor = 'none';

fig2plotly('TreatAs', 'surf')

