MATLAB ribbon in MATLAB®
Learn how to make 1 ribbon charts in MATLAB, then publish them to the Web with Plotly.
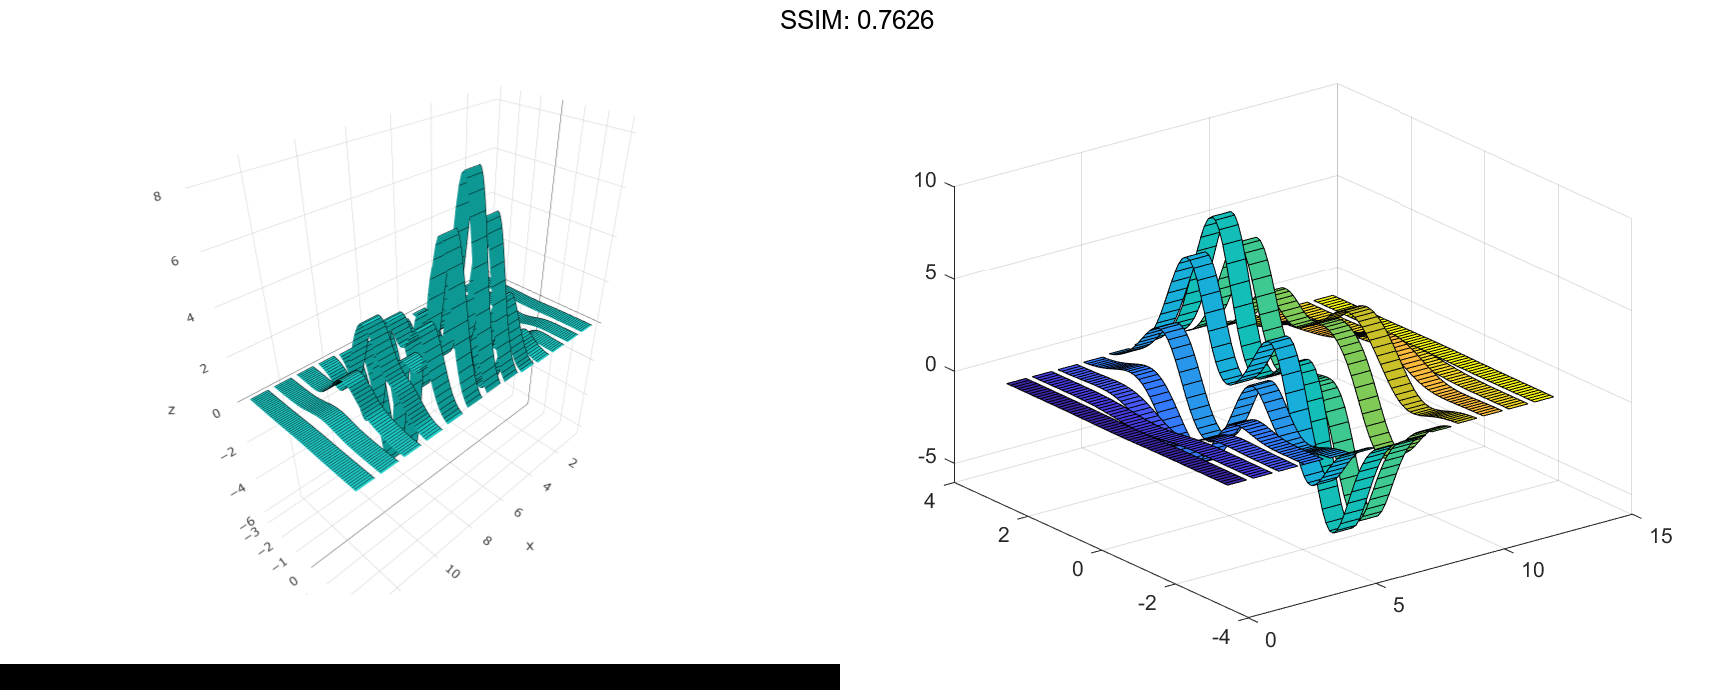
Ribbon Plot
Create a ribbon plot of the peaks function.
[x,y] = meshgrid(-3:.5:3,-3:.1:3);
z = peaks(x,y);

figure
ribbon(y,z)

fig2plotly()