MATLAB pcolor in MATLAB®
Learn how to make 7 pcolor charts in MATLAB, then publish them to the Web with Plotly.
Plot Four Faces with Four Colors
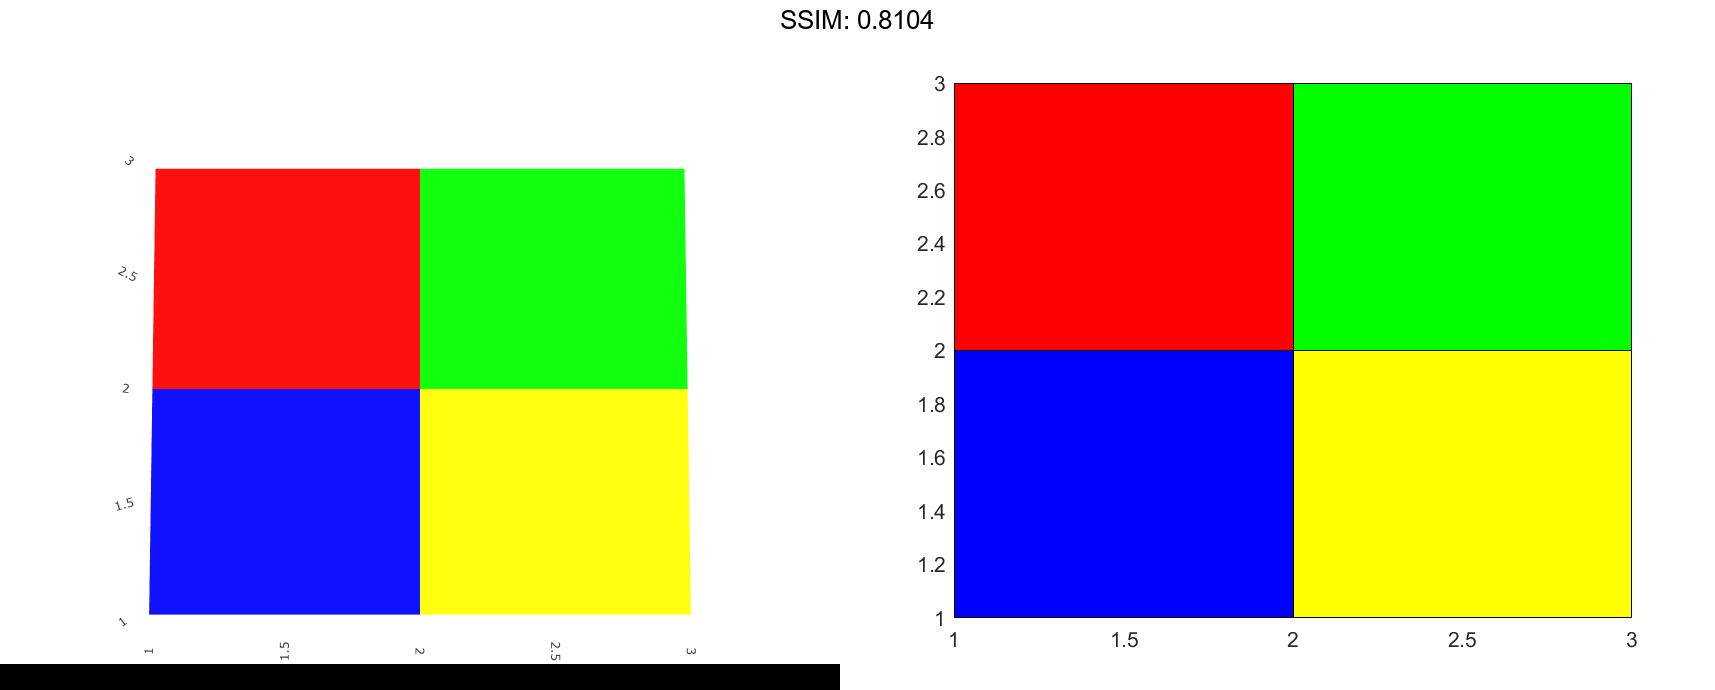
Create coordinate vectors X and Y and a colormap called mymap containing five colors: red, green, blue, yellow, and black.
X = [1 2 3; 1 2 3; 1 2 3]; Y = X'; mymap = [1 0 0; 0 1 0; 0 0 1; 1 1 0; 0 0 0];
Create matrix C that maps the colormap colors to the nine vertices. Four of the nine vertices determine the colors of the faces. Specify the colors at those vertices to make the faces red (1), green (2), blue (3), and yellow (4), respectively. Set the colors at the other vertices to black (5).
C = [3 4 5; 1 2 5; 5 5 5];
Plot the faces, and call the colormap function to replace the default colormap with mymap.
pcolor(X,Y,C)
colormap(mymap)

fig2plotly('TreatAs', 'pcolor')


Plot Hadamard Matrix
A Hadamard matrix has elements that are either 1 or -1`. A good way to visualize this matrix is with a two-color colormap.
Create a 20-by-20 Hadamard matrix. Then plot the matrix using a black and white colormap. Use the axis function to reverse the direction of the y-axis and set the axis lines to equal lengths.
C = hadamard(20);
pcolor(C)
colormap(gray(2))
axis ij
axis square

fig2plotly('TreatAs', 'pcolor')


Modify Borders
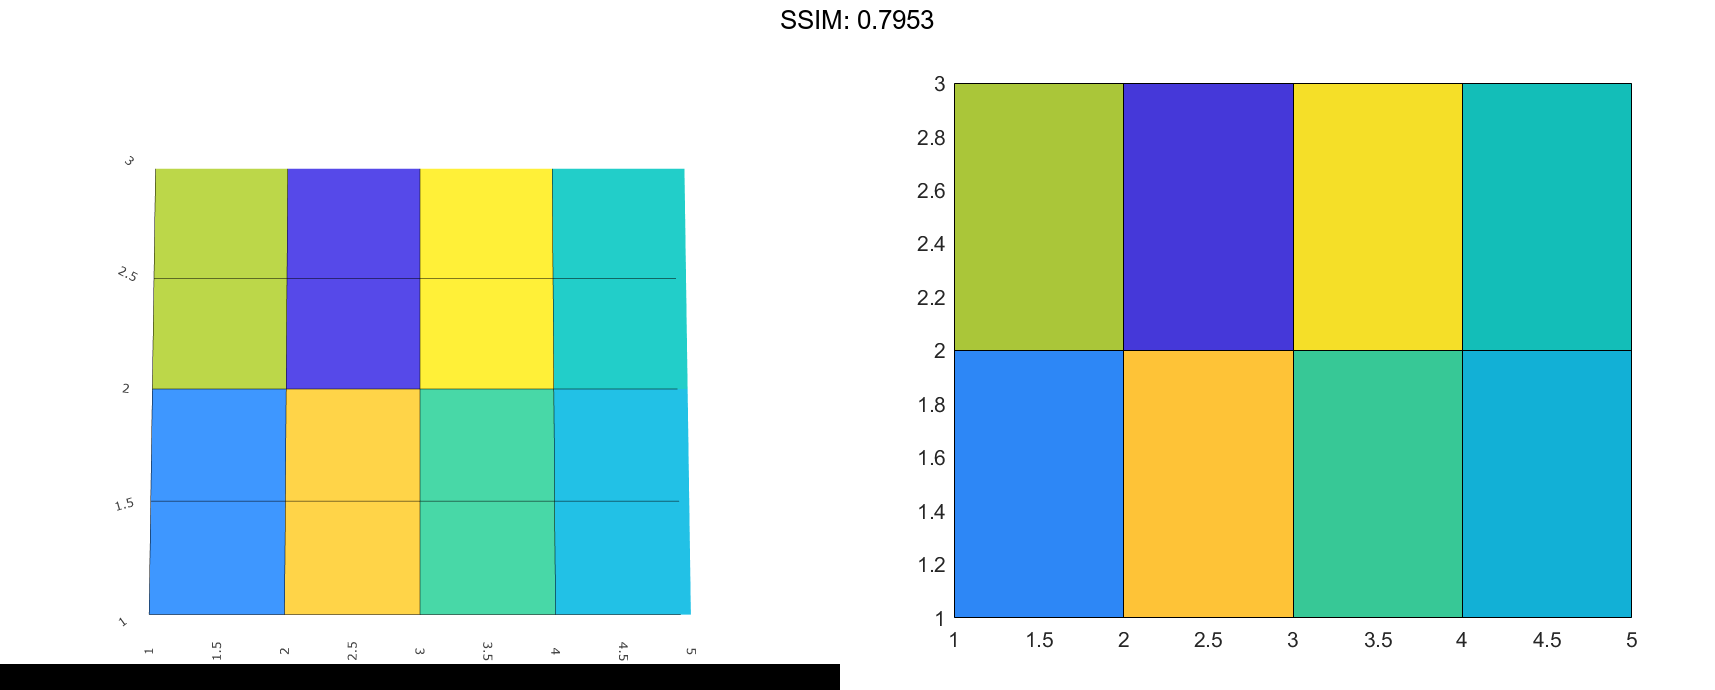
Create color matrix C. Then create a pseudocolor plot of C, and store the Surface object in the return argument s.
C = [1 2 3; 4 5 6; 7 8 9]; s = pcolor(C);


Change the border color by setting the EdgeColor property of s. Make the border thicker by setting the LineWidth property.
s.EdgeColor = [1 0.7 0.3];
s.LineWidth = 6;

fig2plotly('TreatAs', 'pcolor')


Interpolate Colors Across Faces
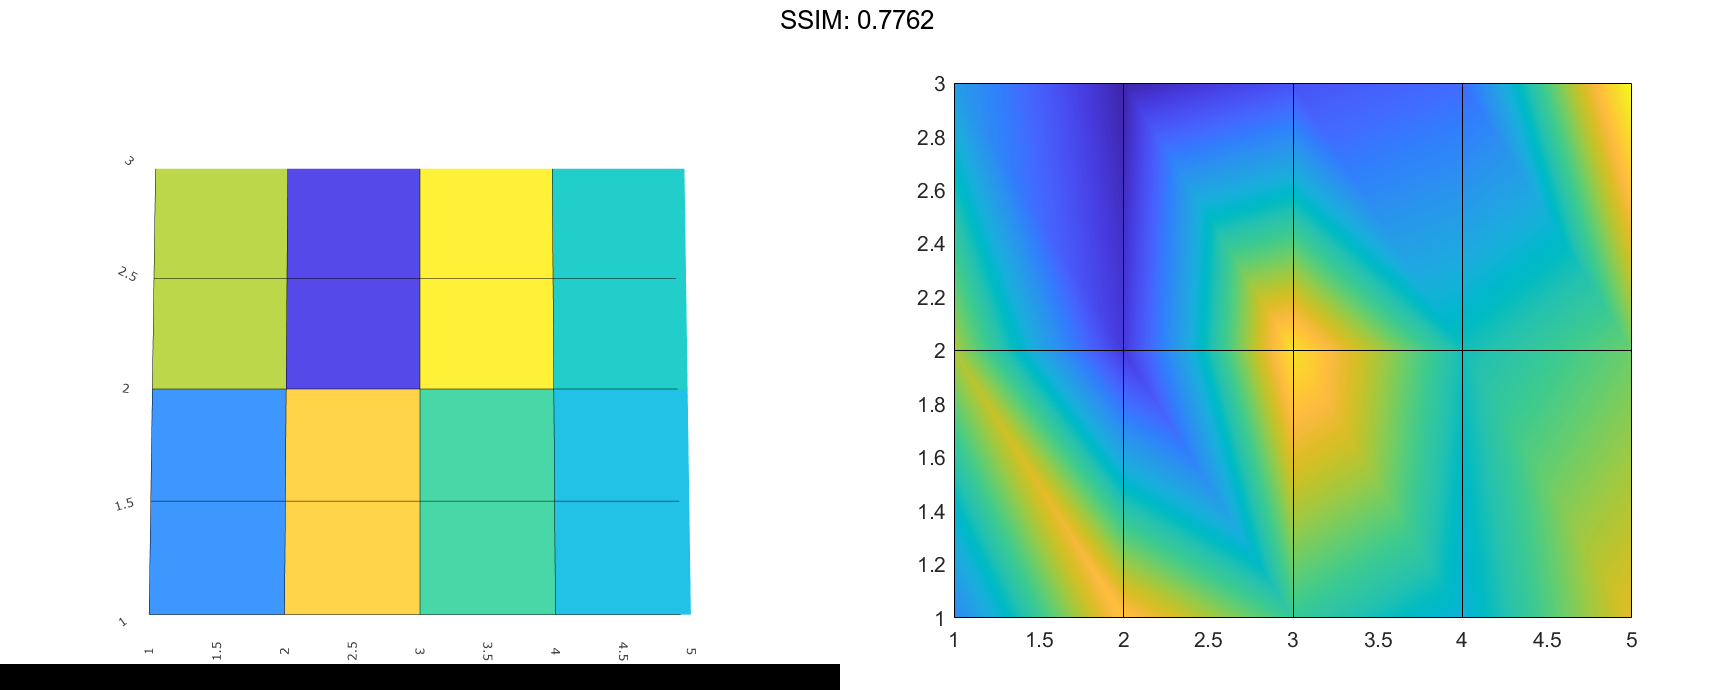
Create color matrix C. Then create a pseudocolor plot of C, and store the Surface object in the return argument s.
C = [5 13 9 7 12; 11 2 14 8 10; 6 1 3 4 15]; s = pcolor(C);


To interpolate the colors across the faces, set the FaceColor propery of s to 'interp'.
s.FaceColor = 'interp';

fig2plotly('TreatAs', 'pcolor')


Specify Semilogarithmic Grid
Create matrices X and Y, which define a regularly spaced grid of vertices. Calculate matrix LY as the log of Y. Then create matrix C containing alternating pairs of rows of color indices.
[X,Y] = meshgrid(1:20); LY = log(Y); colorscale = [1:20; 20:-1:1]; C = repmat(colorscale,10,1);
Plot X and LY, using the colors specified in C. Then adjust the tick labels on the y-axis.
s = pcolor(X,LY,C);
tickvals = LY(2:2:20,1)';
set(gca,'YTick',tickvals);

fig2plotly('TreatAs', 'pcolor')


Specify Parametric Grid
Create matrices X and Y, which define a regularly spaced grid of vertices. Calculate matrices XX and YY as functions of X and Y. Then create matrix C containing alternating pairs of rows of color indices.
[X,Y] = meshgrid(-3:6/17:3); XX = 2X.Y; YY = X.^2 - Y.^2; colorscale = [1:18; 18:-1:1]; C = repmat(colorscale,9,1);
Plot XX and YY using the colors in C.
pcolor(XX,YY,C);

fig2plotly('TreatAs', 'pcolor')


Specify Target Axes
Starting in R2019b, you can display a tiling of plots using the tiledlayout and nexttile functions. Call the tiledlayout function to create a 1-by-2 tiled chart layout. Call the nexttile function to create the axes objects ax1 and ax2. Create two pseudocolor plots by specifying the axes as the first argument to pcolor.
tiledlayout(1,2)

% Left plot
ax1 = nexttile;
C1 = rand(20,10);
pcolor(ax1,C1)

% Right plot
ax2 = nexttile;
C2 = rand(50,10);
pcolor(ax2,C2)

fig2plotly('TreatAs', 'pcolor')


