

Plotly MATLAB® Open Source Graphing Library Scientific Charts
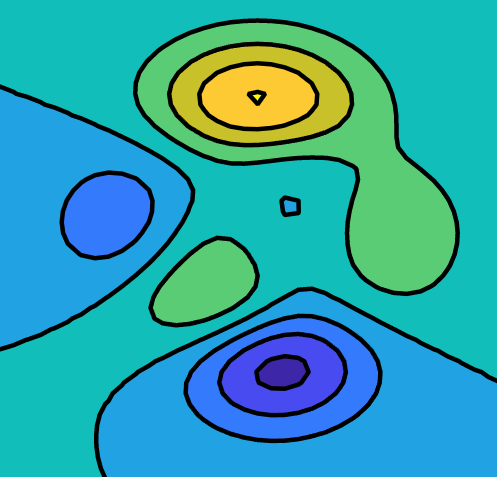
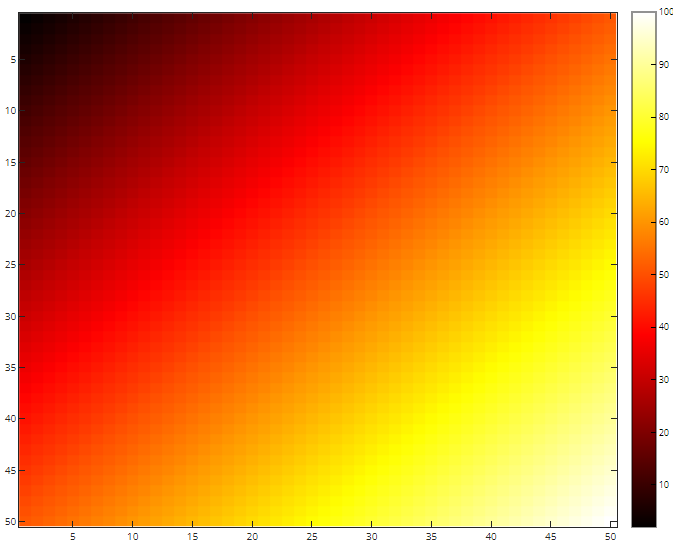
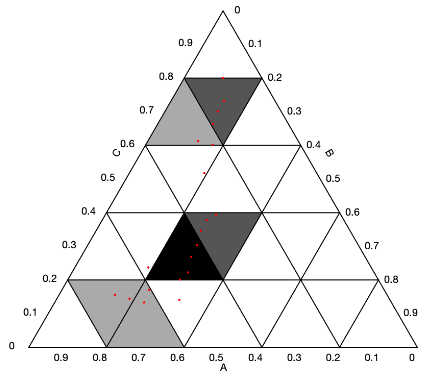
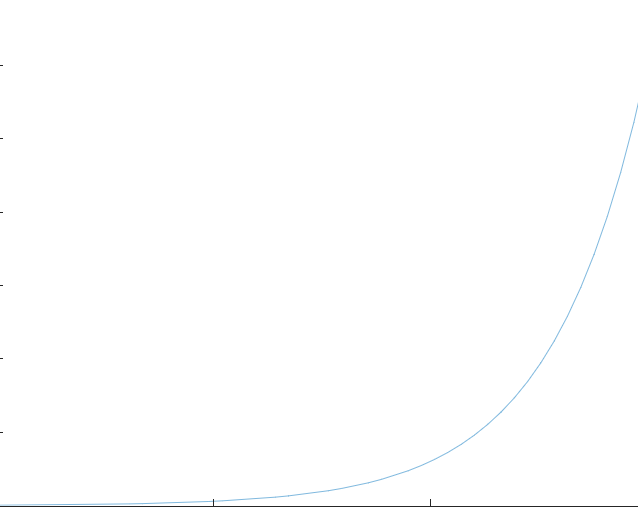
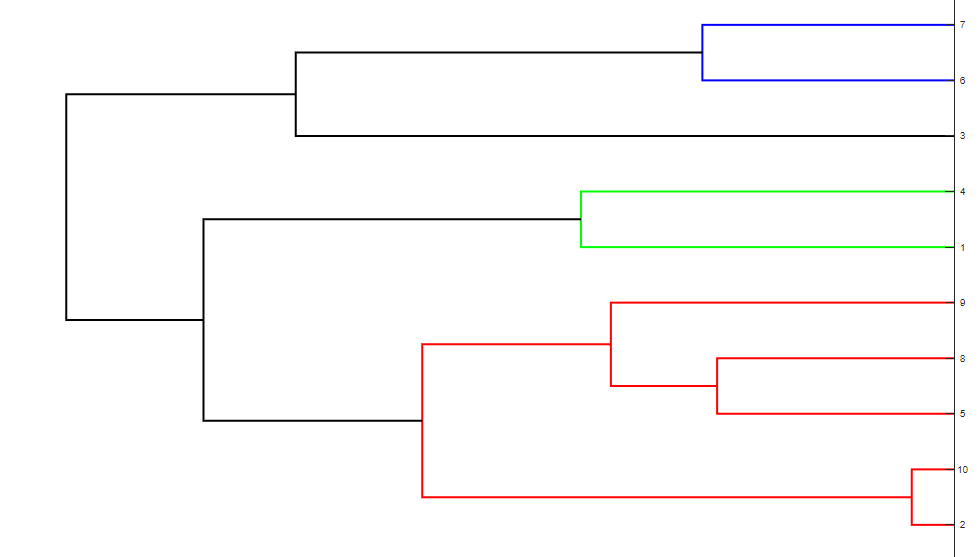
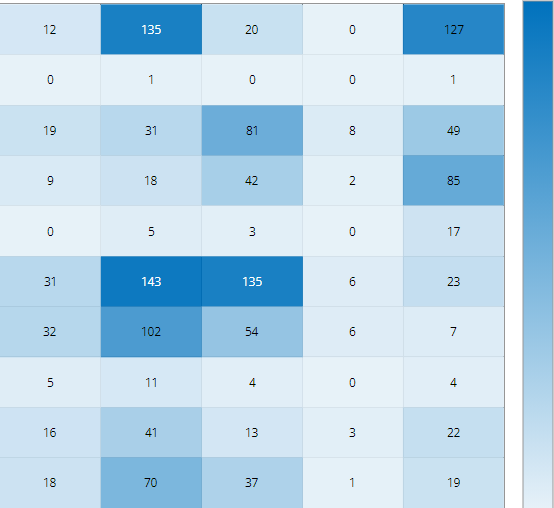
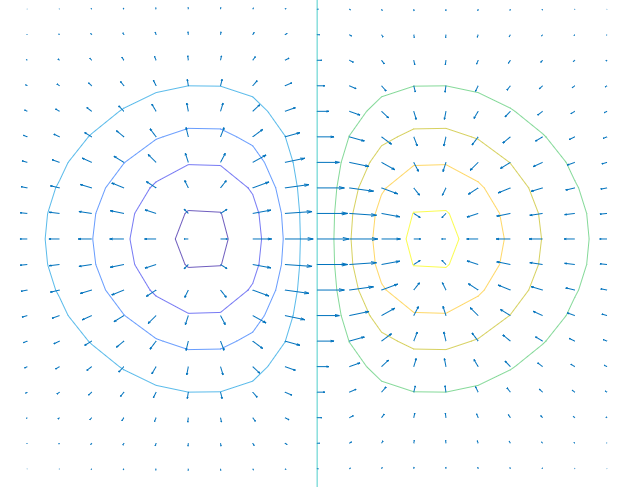
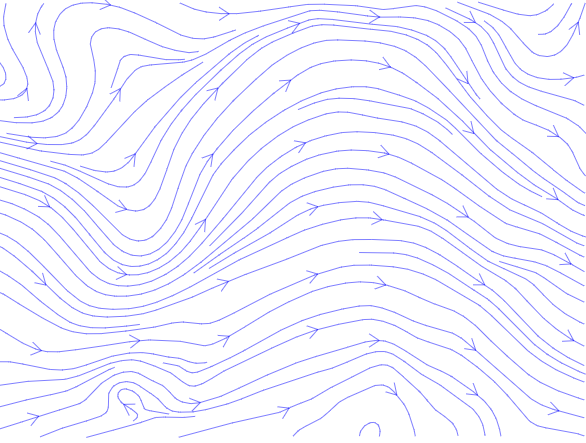
Examples of how to make scientific charts such as contour plots, heatmaps, dendrograms, polar charts, and ternary plots.
Plotly Studio: Transform any dataset into an interactive data application in minutes with AI. Try Plotly Studio now.

MATLAB® is a registered trademark of The MathWorks, Inc.