Plotly ggplot2 Open Source Graphing Library Scientific Charts
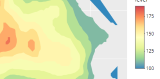
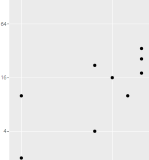
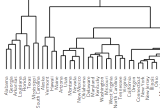
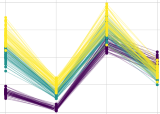
Plotly's ggplot2 graphing library makes interactive, publication-quality graphs online. Examples of how to make scientific charts such as contour plots, heatmaps, dendrograms, polar charts, and ternary plots.
Plotly Studio: Transform any dataset into an interactive data application in minutes with AI. Try Plotly Studio now.