MATLAB spy in MATLAB®
Learn how to make 1 spy charts in MATLAB, then publish them to the Web with Plotly.
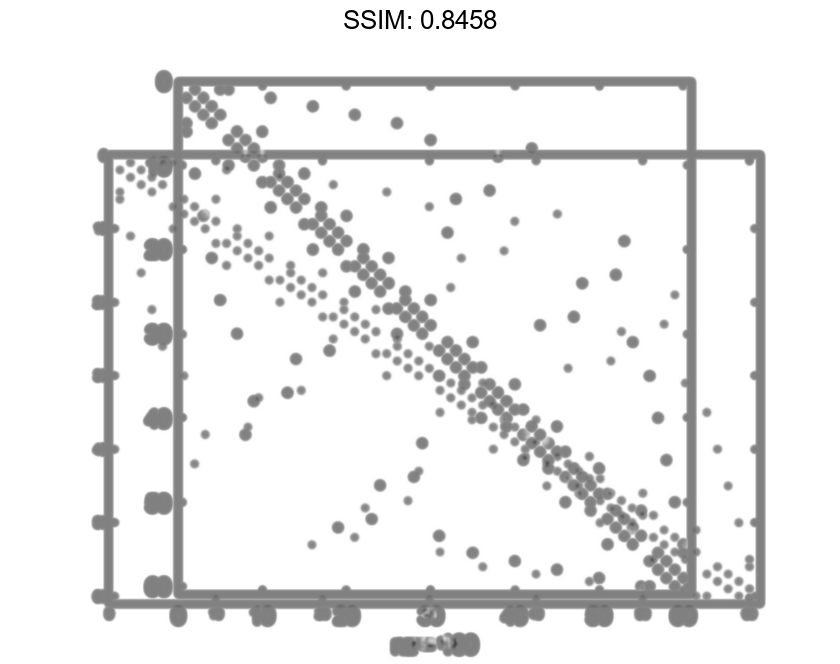
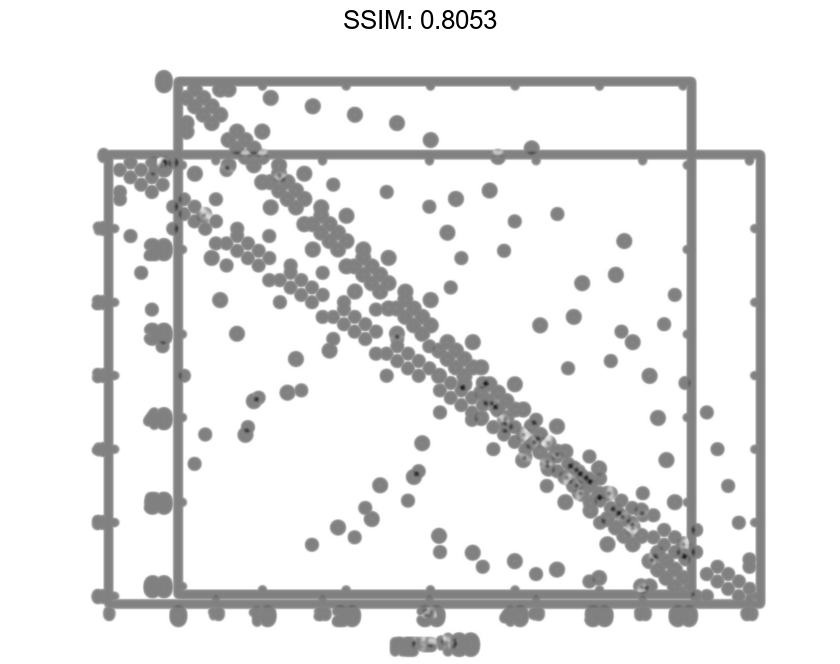
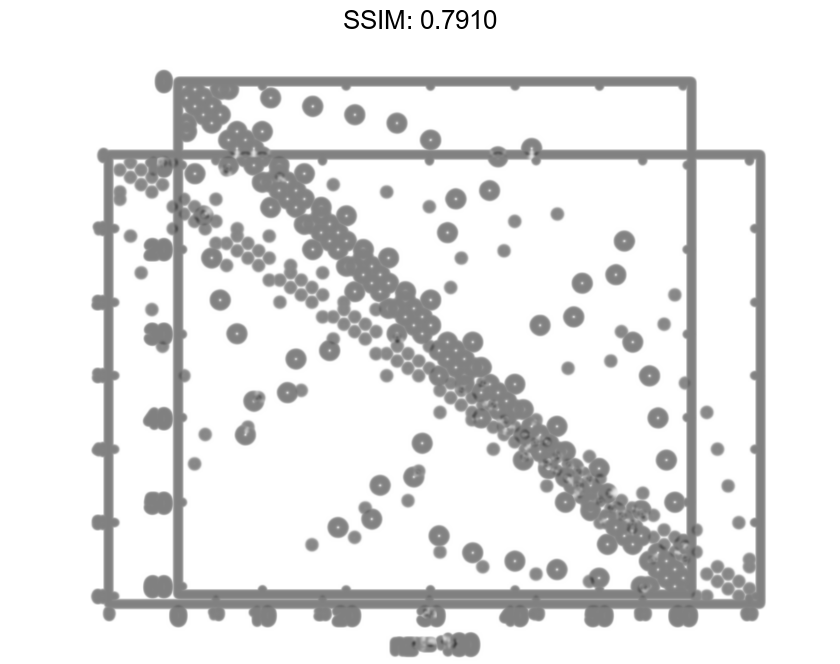
Plot Sparsity Pattern
Plot the 60-by-60 sparse adjacency matrix of the connectivity graph of the Buckminster Fuller geodesic dome. This matrix also represents the carbon-60 molecule and a soccer ball.
B = bucky;
spy(B)

fig2plotly()
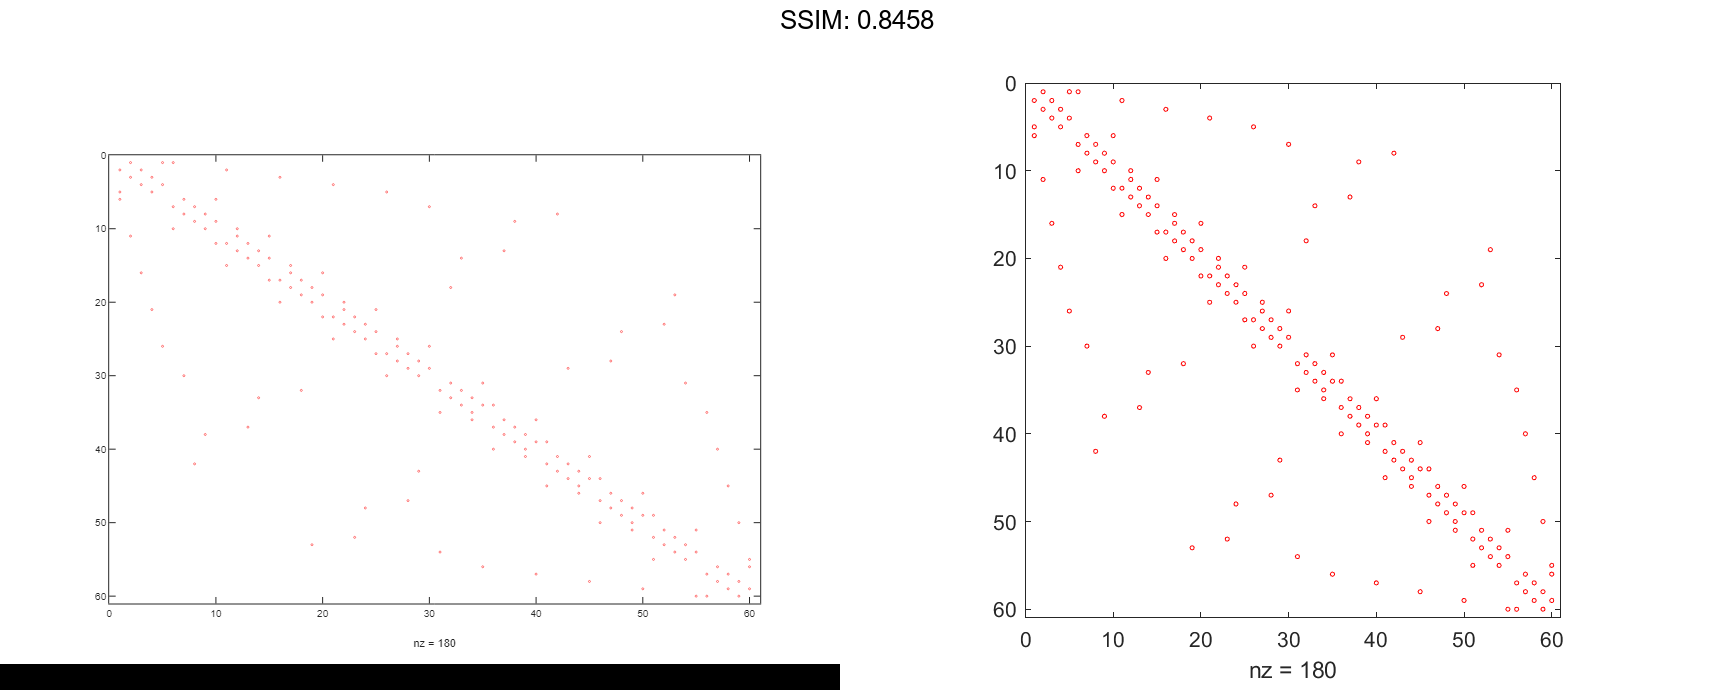
Specify the color and marker.
spy(B,'ro')

fig2plotly()
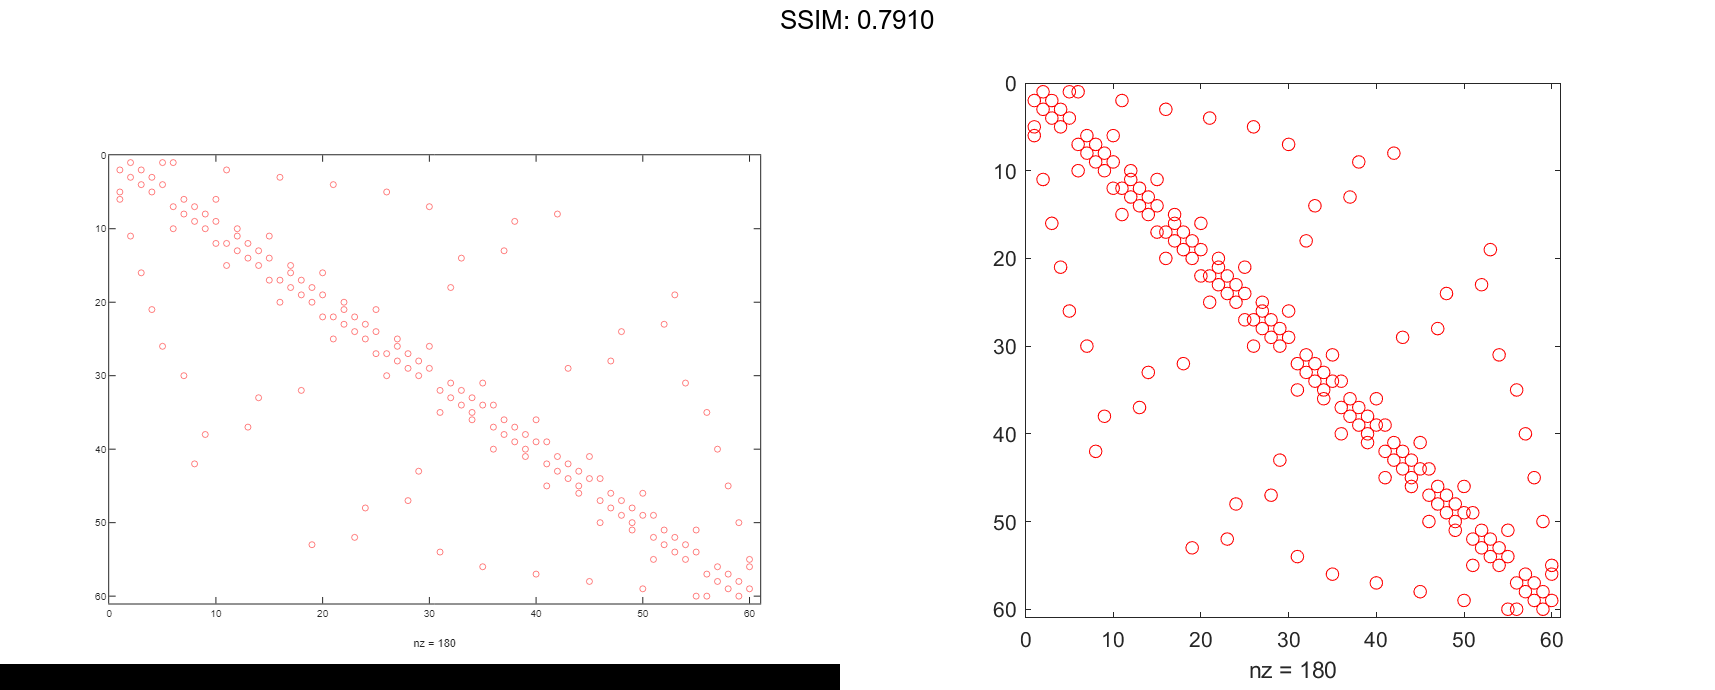
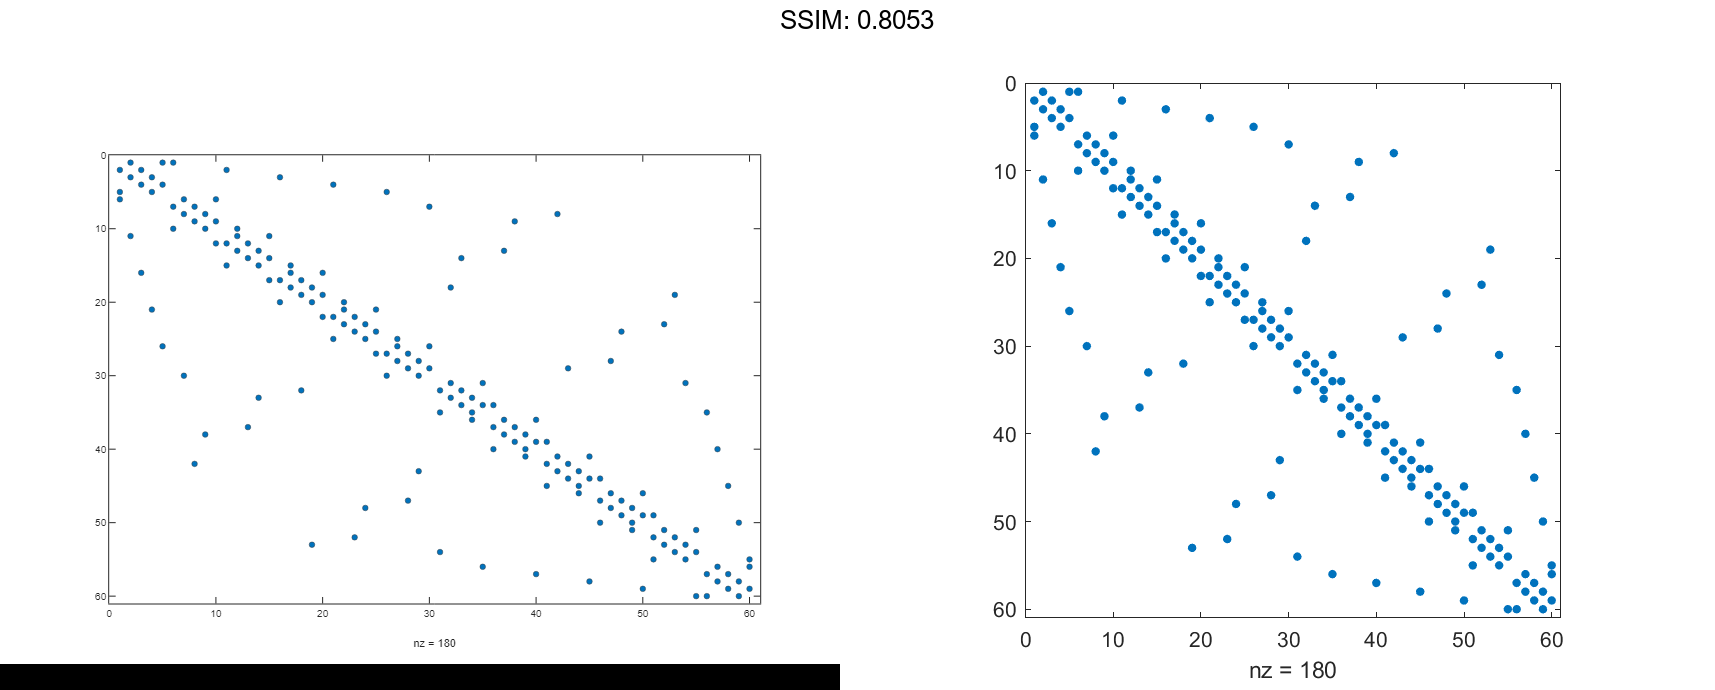
Also specify the marker size.
spy(B,'ro',2)

fig2plotly()