

MATLAB scatter3 in MATLAB®
Learn how to make 8 scatter3 charts in MATLAB, then publish them to the Web with Plotly.
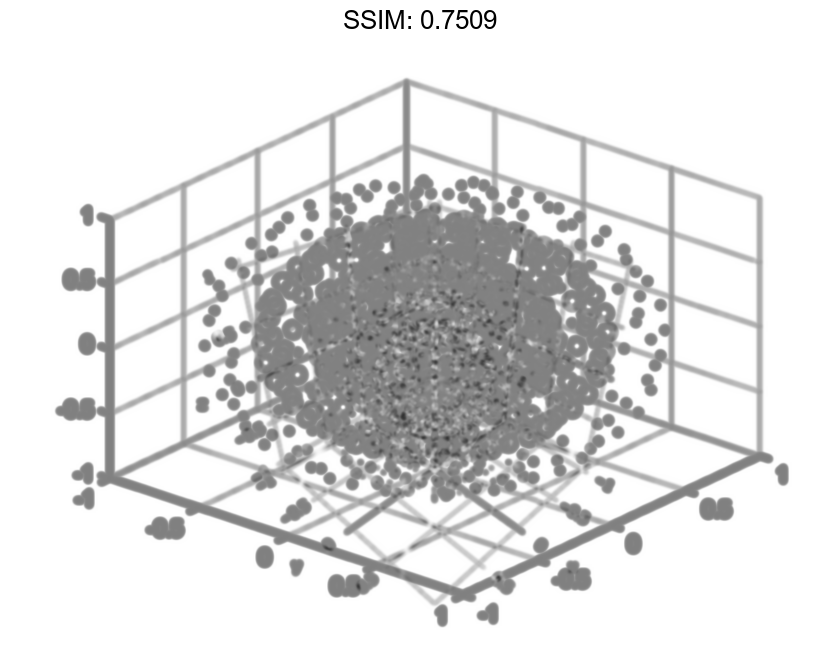
Create 3-D Scatter Plot
Create a 3-D scatter plot. Use sphere to define vectors x, y, and z.
figure
[X,Y,Z] = sphere(16);
x = [0.5*X(:); 0.75*X(:); X(:)];
y = [0.5*Y(:); 0.75*Y(:); Y(:)];
z = [0.5*Z(:); 0.75*Z(:); Z(:)];
scatter3(x,y,z)

fig2plotly()


Vary Marker Size
Use sphere to define vectors x, y, and z.
[X,Y,Z] = sphere(16); x = [0.5X(:); 0.75X(:); X(:)]; y = [0.5Y(:); 0.75Y(:); Y(:)]; z = [0.5Z(:); 0.75Z(:); Z(:)];
Define vector s to specify the marker sizes.
S = repmat([100,50,5],numel(X),1); s = S(:);
Create a 3-D scatter plot and use view to change the angle of the axes in the figure.
figure
scatter3(x,y,z,s)
view(40,35)

fig2plotly()
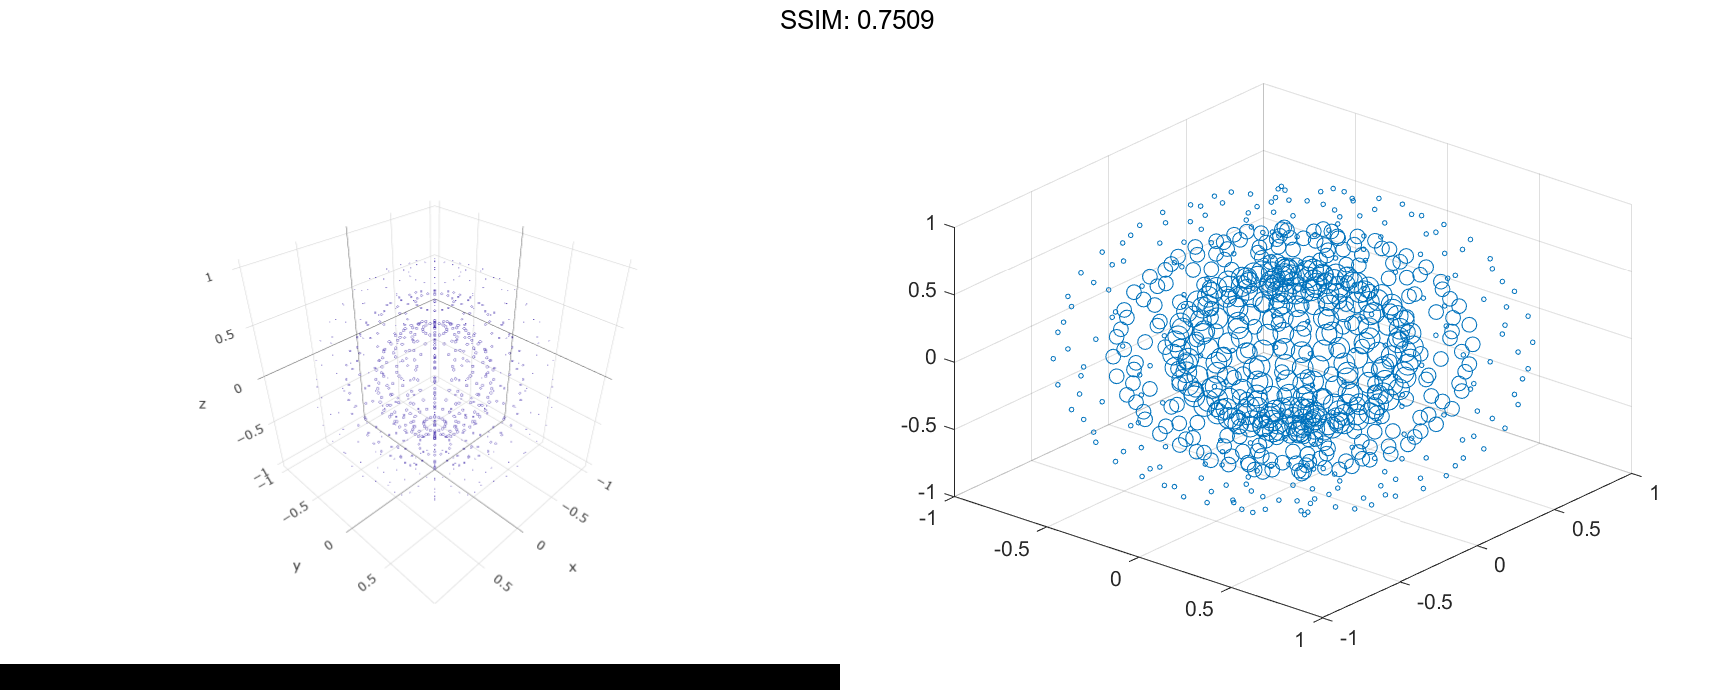
Corresponding entries in x, y, z, and s determine the location and size of each marker.
Vary Marker Color
Use sphere to define vectors x, y, and z.
[X,Y,Z] = sphere(16); x = [0.5X(:); 0.75X(:); X(:)]; y = [0.5Y(:); 0.75Y(:); Y(:)]; z = [0.5Z(:); 0.75Z(:); Z(:)];
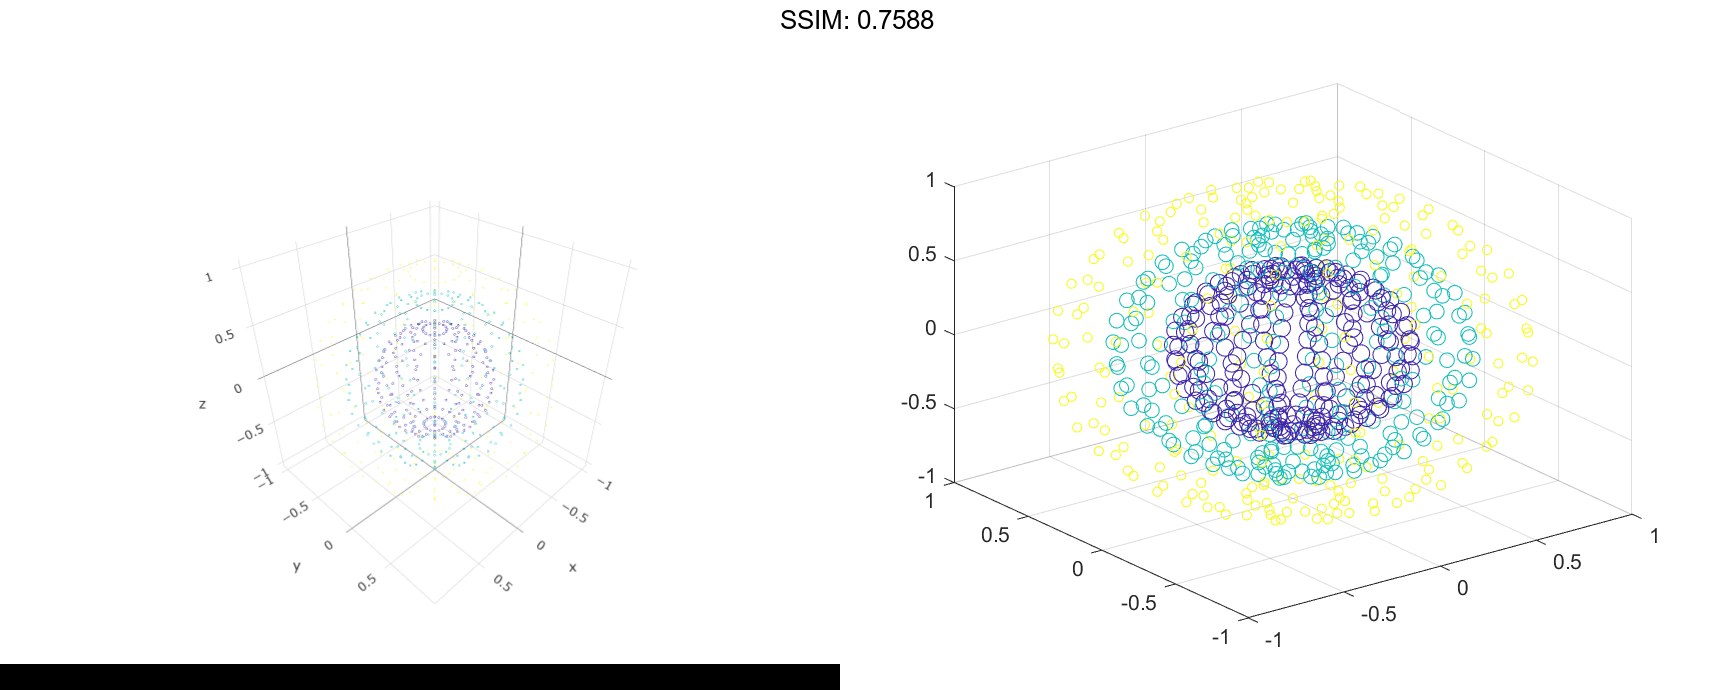
Define vectors s and c to specify the size and color of each marker.
S = repmat([50,25,10],numel(X),1); C = repmat([1,2,3],numel(X),1); s = S(:); c = C(:);
Create a 3-D scatter plot and use view to change the angle of the axes in the figure.
figure
scatter3(x,y,z,s,c)
view(40,35)

fig2plotly()

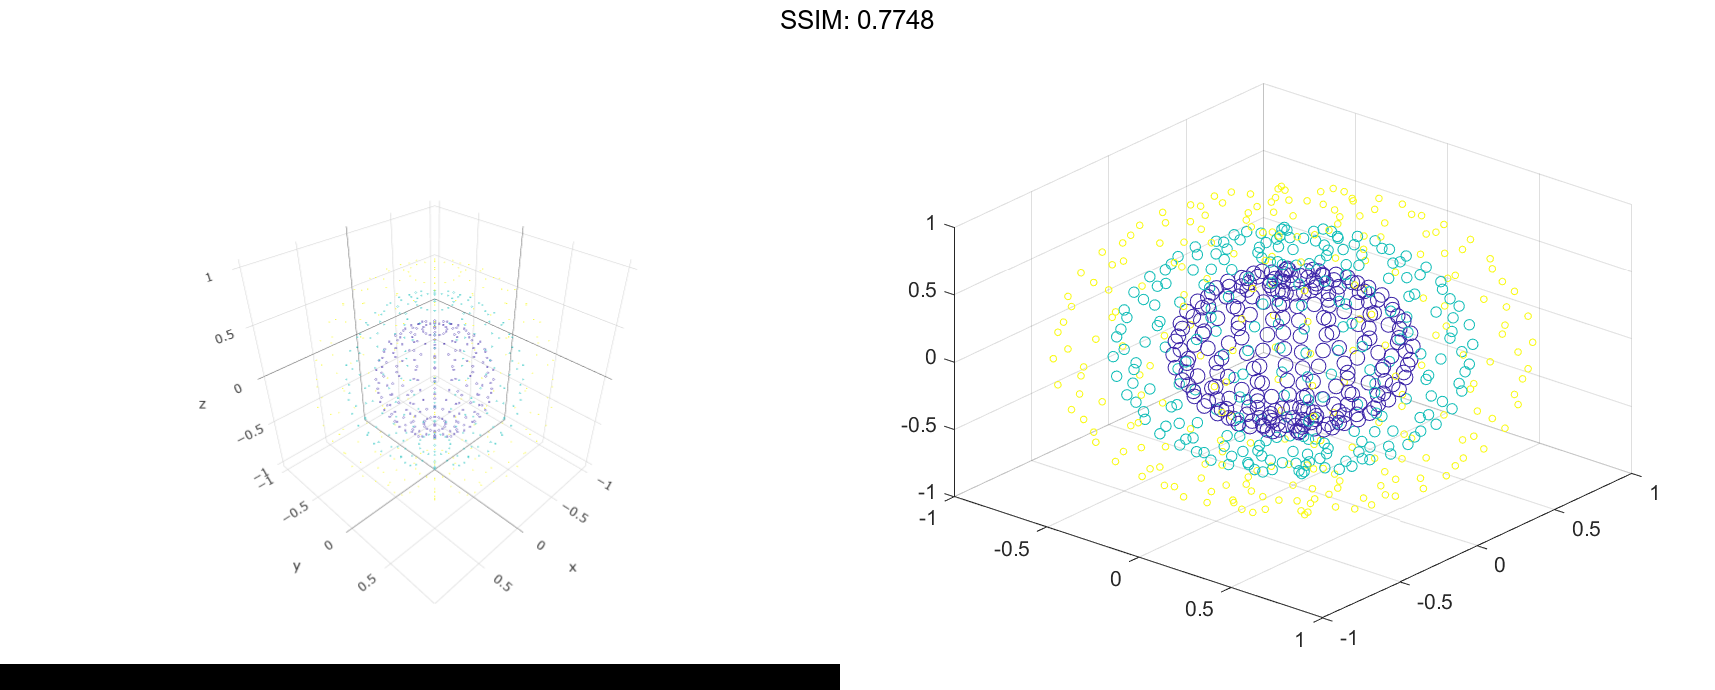
Corresponding entries in x, y, z, and c determine the location and color of each marker.
Fill in Markers
Create vectors x and y as cosine and sine values with random noise.
z = linspace(0,4pi,250); x = 2cos(z) + rand(1,250); y = 2*sin(z) + rand(1,250);
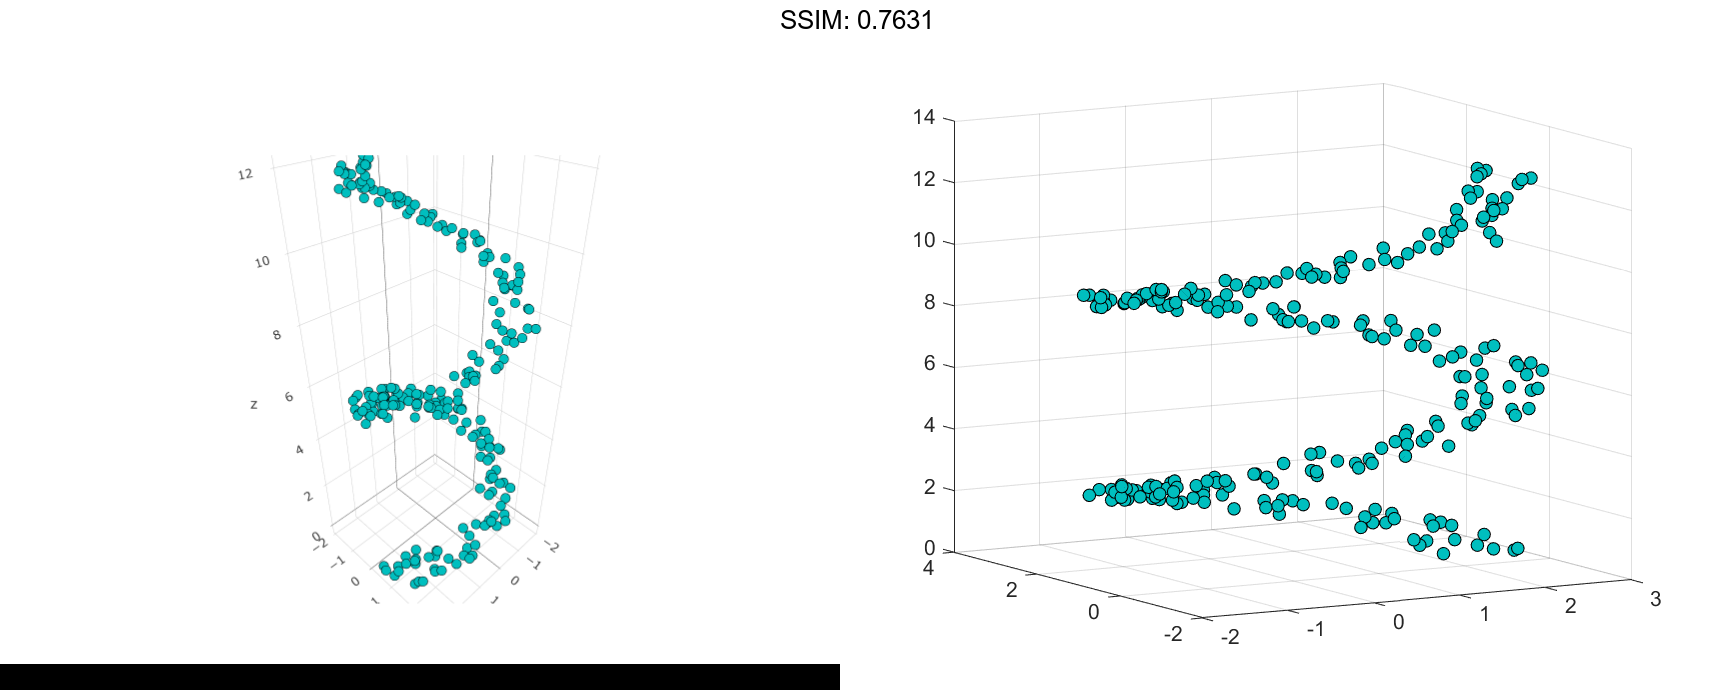
Create a 3-D scatter plot and fill in the markers. Use view to change the angle of the axes in the figure.
scatter3(x,y,z,'filled')
view(-30,10)

fig2plotly()


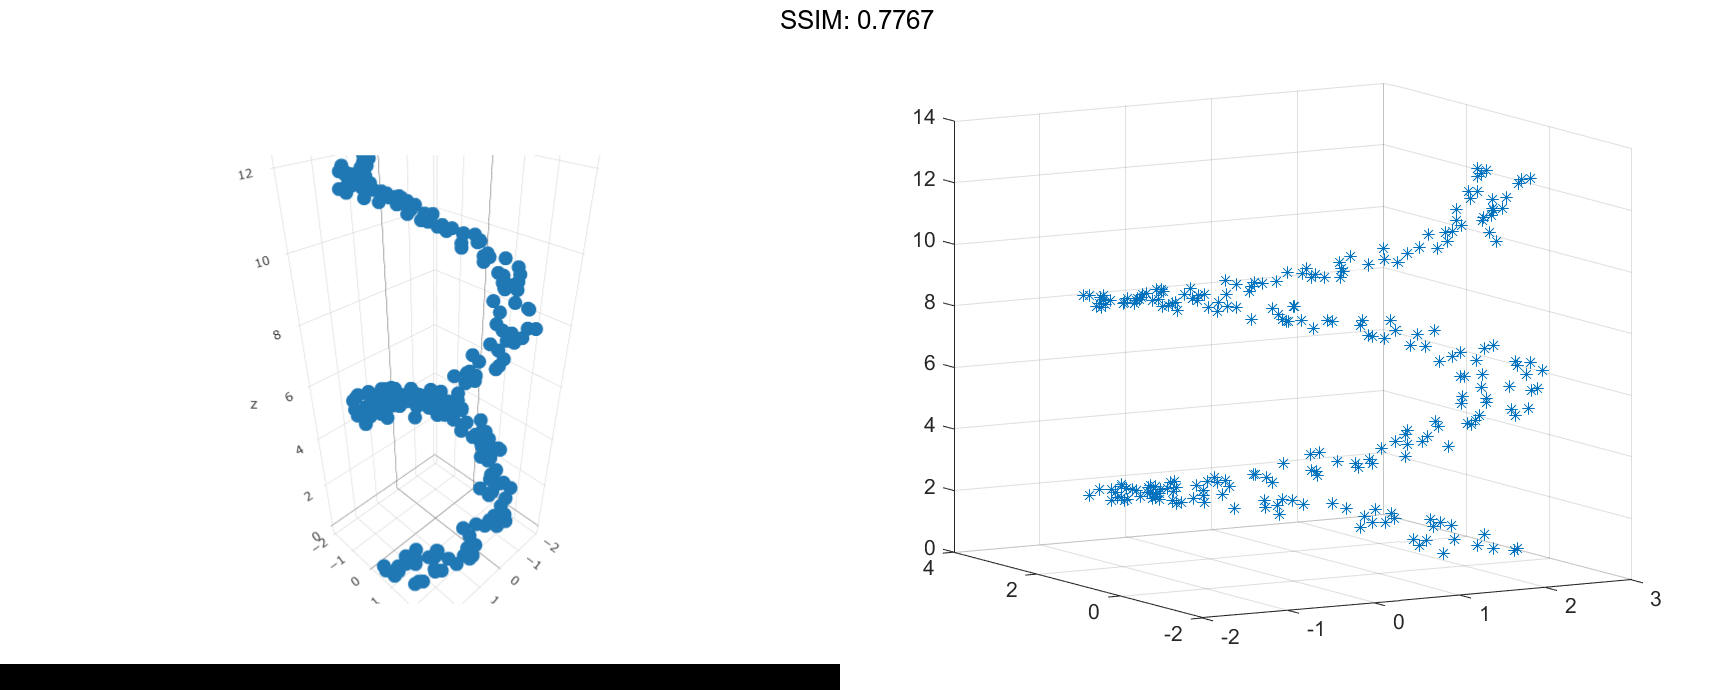
Set Marker Type
Initialize the random-number generator to make the output of rand repeatable. Define vectors x and y as cosine and sine values with random noise.
rng default z = linspace(0,4pi,250); x = 2cos(z) + rand(1,250); y = 2*sin(z) + rand(1,250);
Create a 3-D scatter plot and set the marker type. Use view to change the angle of the axes in the figure.
figure
scatter3(x,y,z,'*')
view(-30,10)

fig2plotly()

Set Marker Properties
Initialize the random-number generator to make the output of rand repeatable. Define vectors x and y as cosine and sine values with random noise.
rng default z = linspace(0,4pi,250); x = 2cos(z) + rand(1,250); y = 2*sin(z) + rand(1,250);
Create a 3-D scatter plot and set the marker edge color and the marker face color. Use view to change the angle of the axes in the figure.
figure
scatter3(x,y,z,...
        'MarkerEdgeColor','k',...
        'MarkerFaceColor',[0 .75 .75])
view(-30,10)

fig2plotly()

Specify Axes for 3-D Scatter Plot
Starting in R2019b, you can display a tiling of plots using the tiledlayout and nexttile functions.
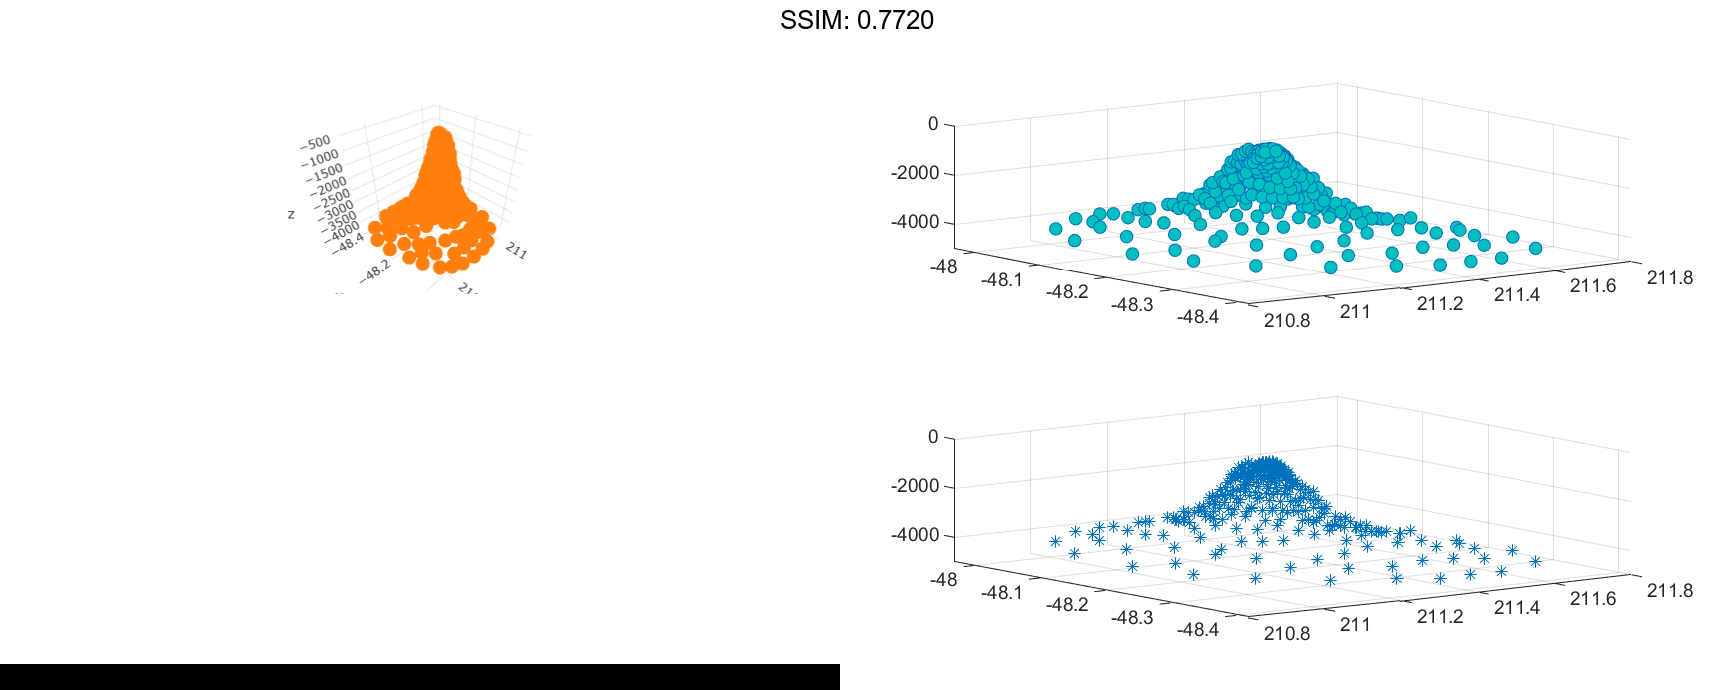
Load the seamount data set to get vectors x, y, and z. Call the tiledlayout function to create a 2-by-1 tiled chart layout. Call the nexttile function to create the axes objects ax1 and ax2. Then create separate scatter plots in the axes by specifying the axes object as the first argument to scatter3.
load seamount
tiledlayout(2,1)
ax1 = nexttile;
ax2 = nexttile;
scatter3(ax1,x,y,z,'MarkerFaceColor',[0 .75 .75])
scatter3(ax2,x,y,z,'*')

fig2plotly()

Set Scatter Series Properties Using Handle
Use the sphere function to create vectors x, y, and z.
[X,Y,Z] = sphere(16); x = [0.5X(:); 0.75X(:); X(:)]; y = [0.5Y(:); 0.75Y(:); Y(:)]; z = [0.5Z(:); 0.75Z(:); Z(:)];
Create vectors s and c to specify the size and color for each marker.
S = repmat([70,50,20],numel(X),1); C = repmat([1,2,3],numel(X),1); s = S(:); c = C(:);
Create a 3-D scatter plot and return the scatter series object.
h = scatter3(x,y,z,s,c);

Use an RGB triplet color value to set the marker face color. Use dot notation to set properties.
h.MarkerFaceColor = [0 0.5 0.5];

fig2plotly()

