MATLAB polarscatter in MATLAB®
Learn how to make 6 polarscatter charts in MATLAB, then publish them to the Web with Plotly.
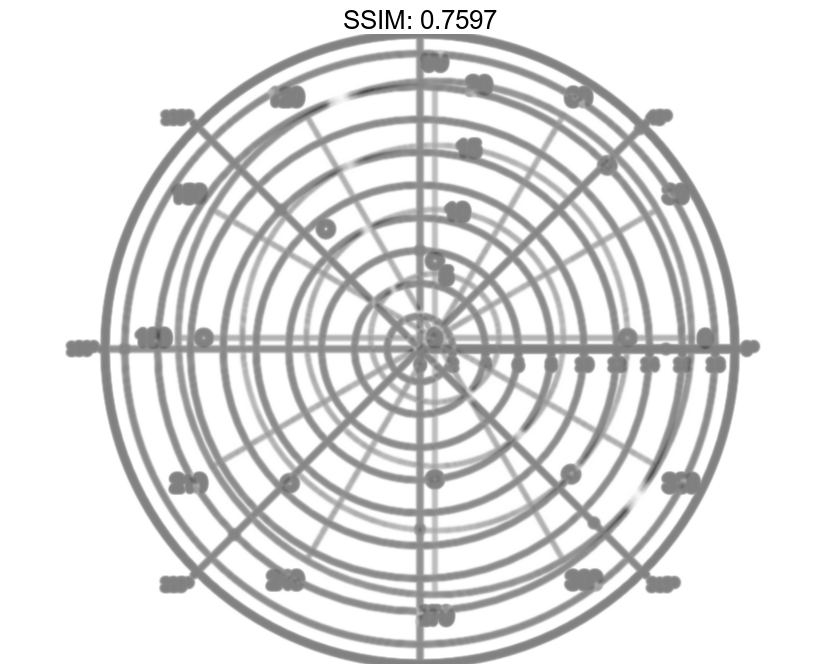
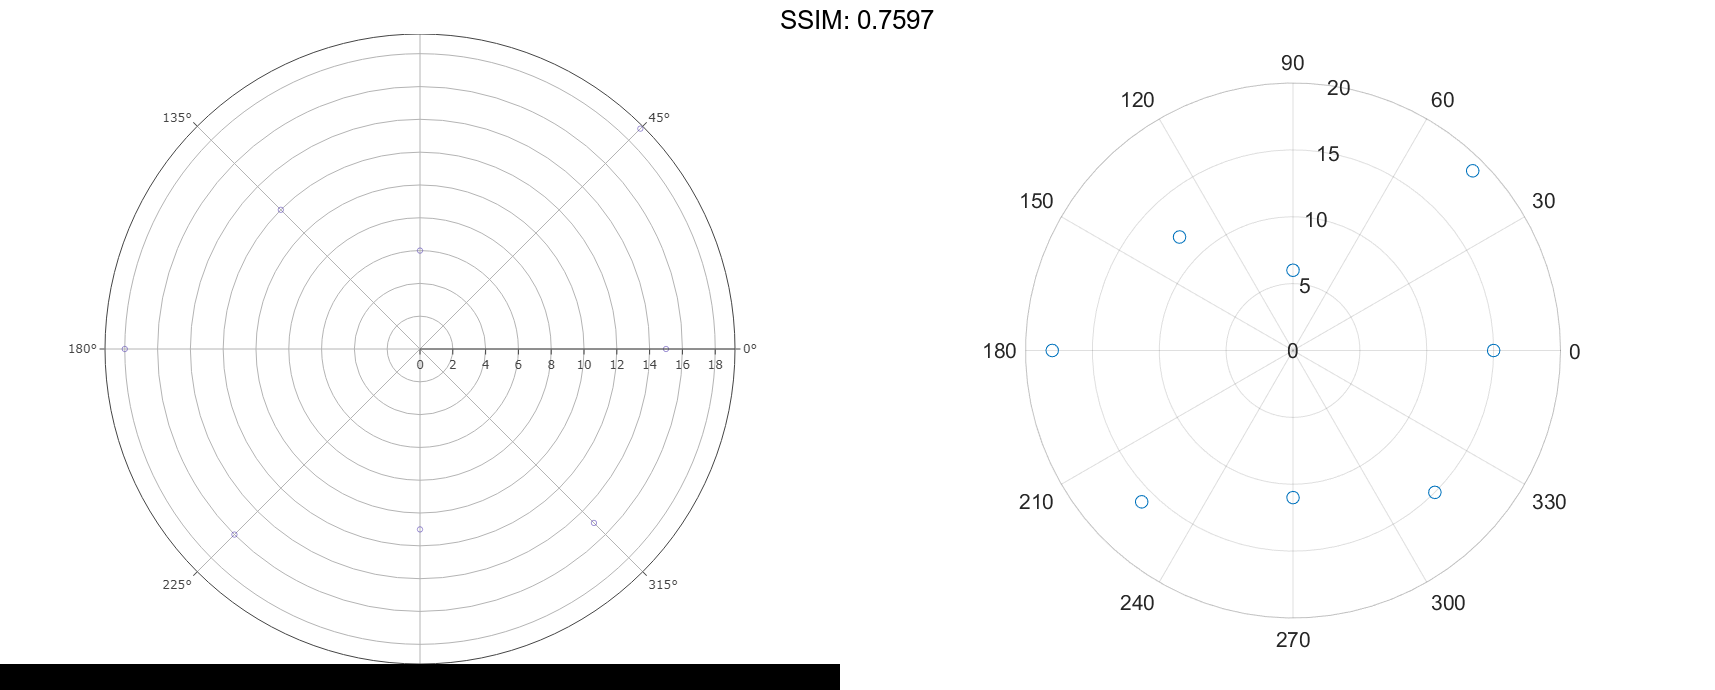
Create Scatter Chart
Create a scatter chart in polar coordinates.
th = pi/4:pi/4:2*pi;
r = [19 6 12 18 16 11 15 15];
polarscatter(th,r)

fig2plotly()
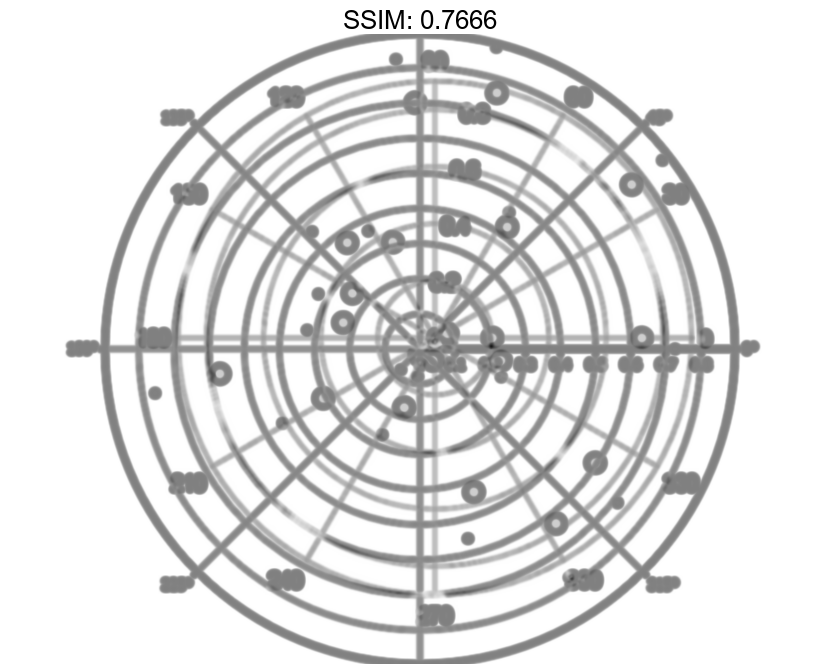
Use Filled Markers and Set Marker Size
Create a scatter chart that uses filled markers by specifying the optional input argument, 'filled'. Set the marker size to 75 points squared.
th = linspace(0,2*pi,20);
r = rand(1,20);
sz = 75;
polarscatter(th,r,sz,'filled')

fig2plotly()
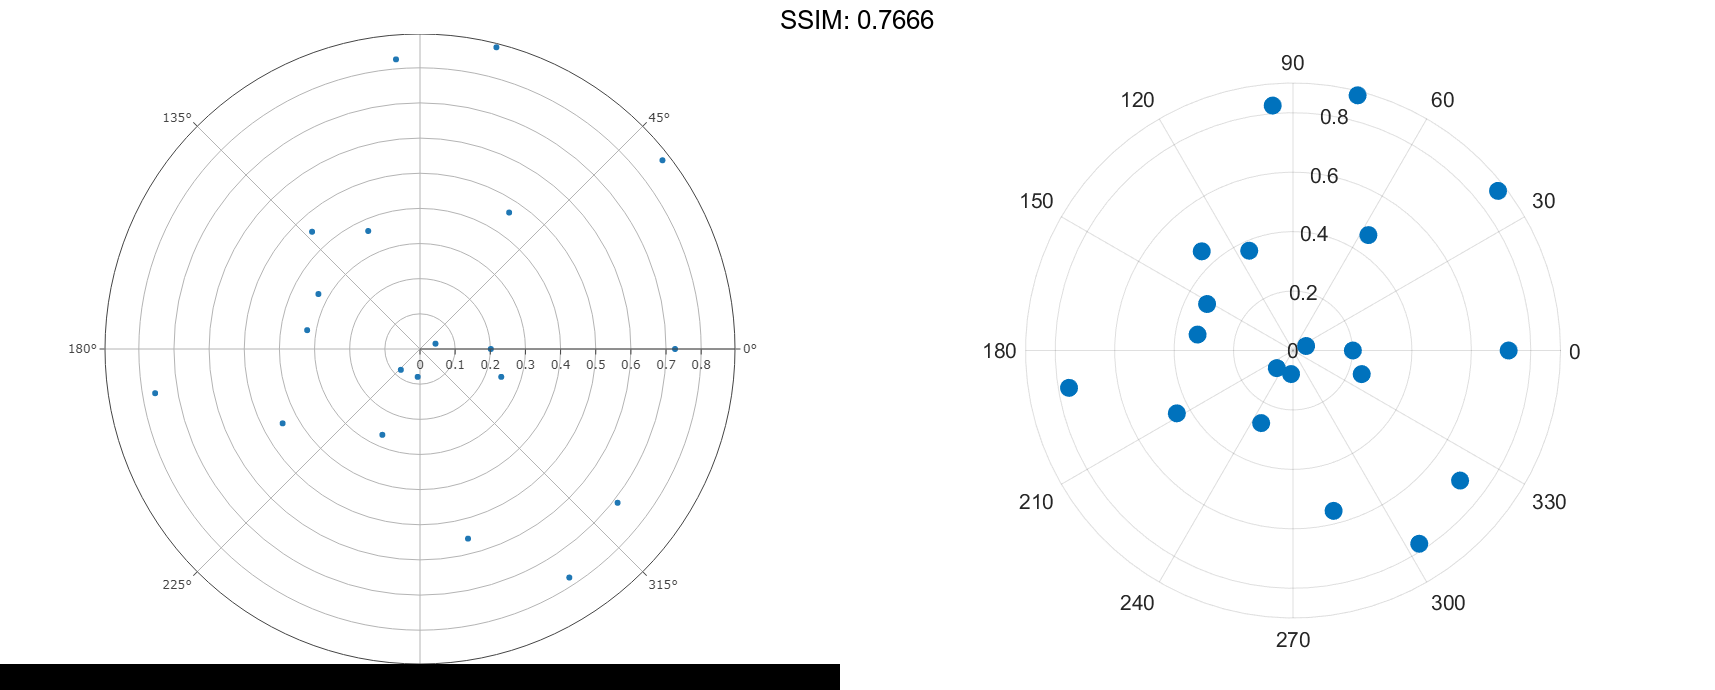
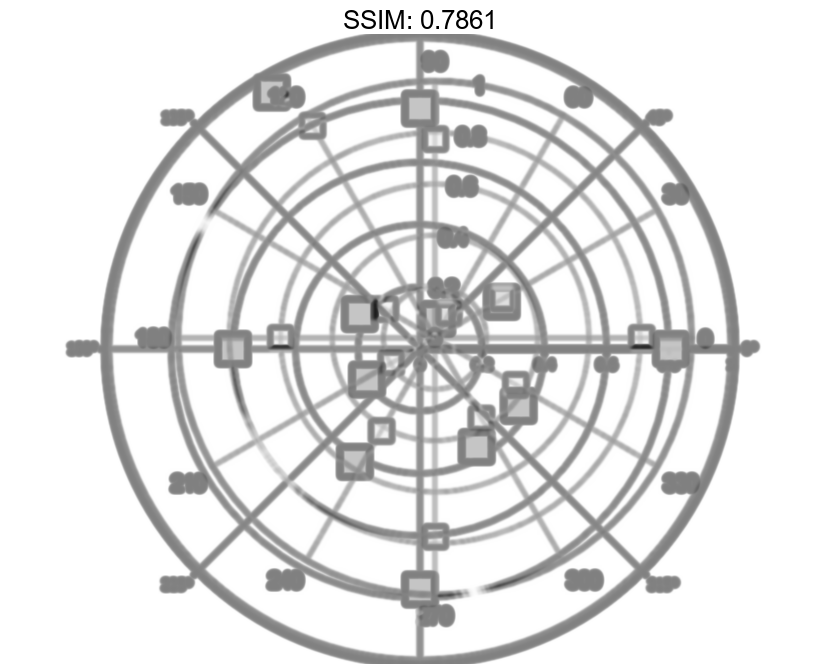
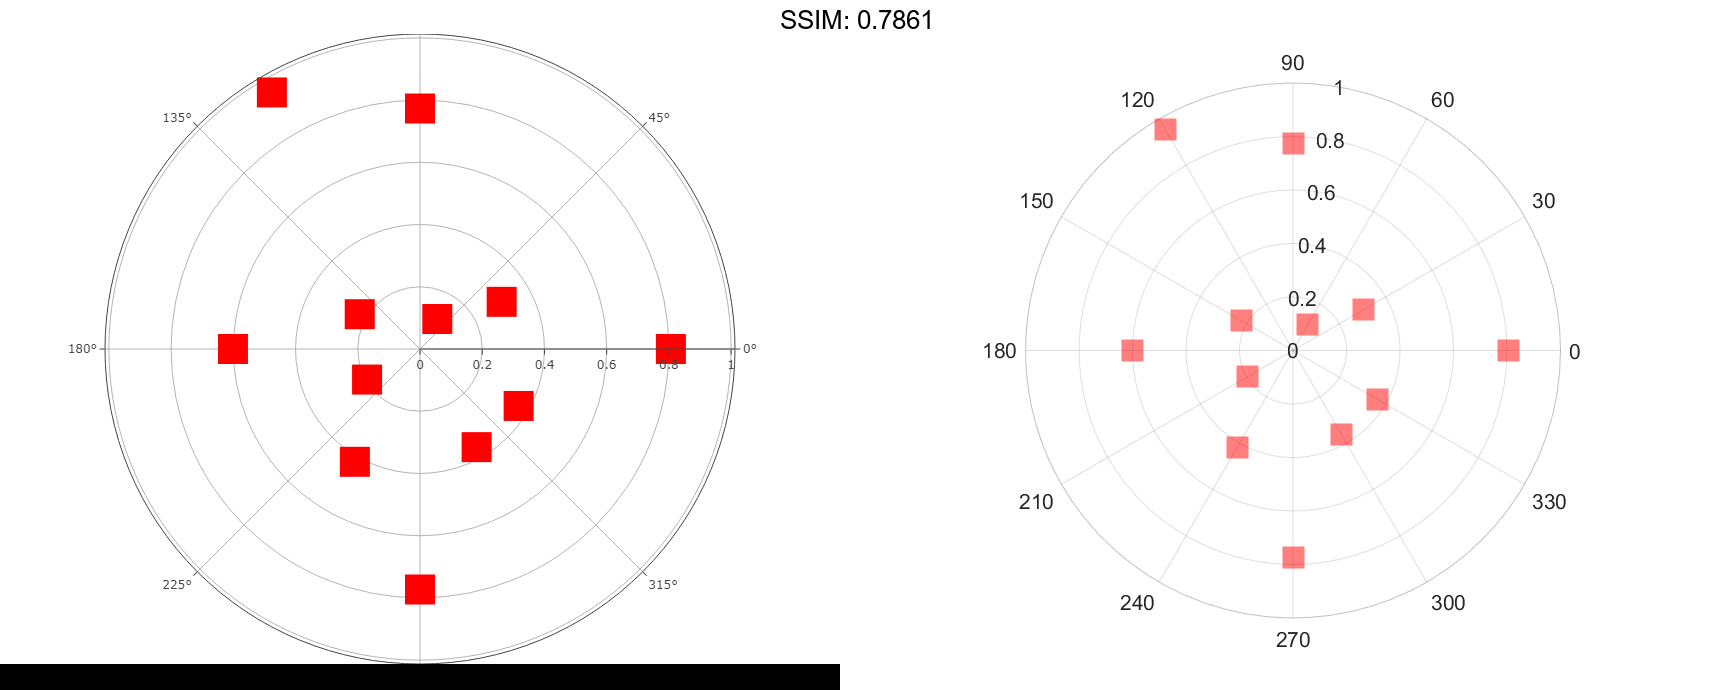
Use Markers with Varying Sizes and Colors
Create a scatter chart with markers of varying sizes and colors. Specify the optional size and color input arguments as vectors. Use unique values in the color vector to specify the different colors you want. The values map to colors in the colormap.
th = pi/4:pi/4:2*pi;
r = [19 6 12 18 16 11 15 15];
sz = 100*[6 15 20 3 15 3 6 40];
c = [1 2 2 2 1 1 2 1];
polarscatter(th,r,sz,c,'filled','MarkerFaceAlpha',.5)

fig2plotly()
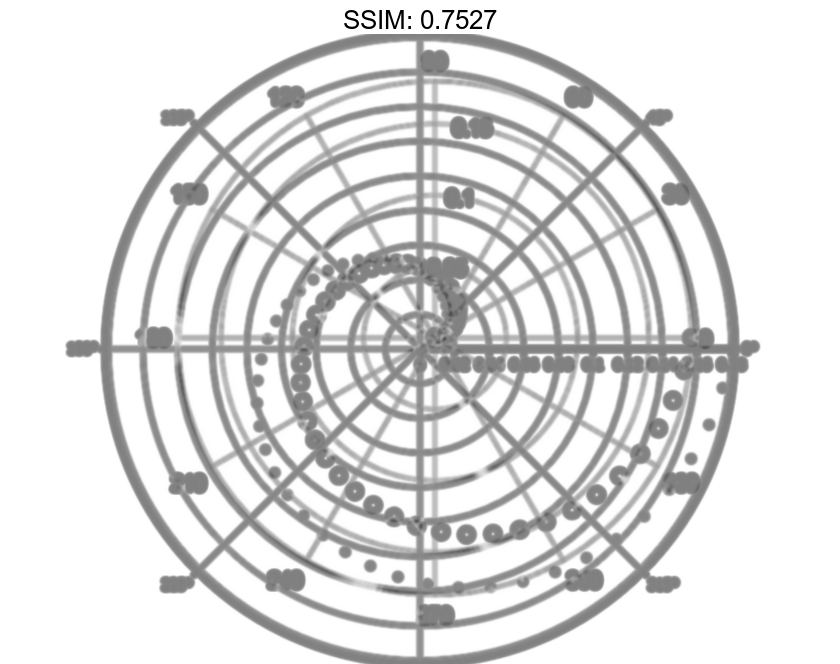
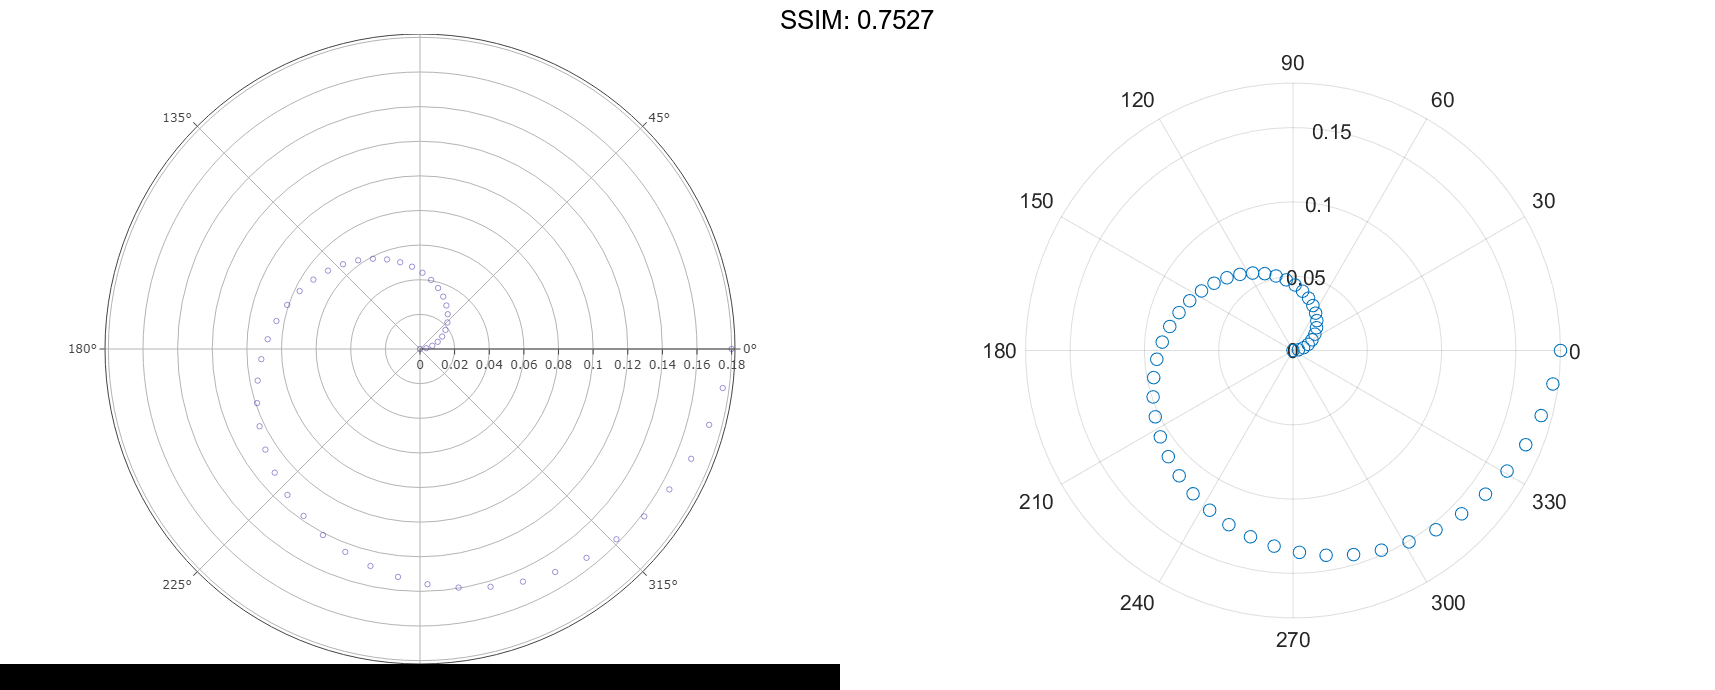
Convert from Degrees to Radians Before Plotting
Create data where the angle values are in degrees. Since polarscatter requires angle values in radians, convert the values to radians before plotting using deg2rad.
th = linspace(0,360,50);
r = 0.005*th/10;
th_radians = deg2rad(th);
polarscatter(th_radians,r)

fig2plotly()
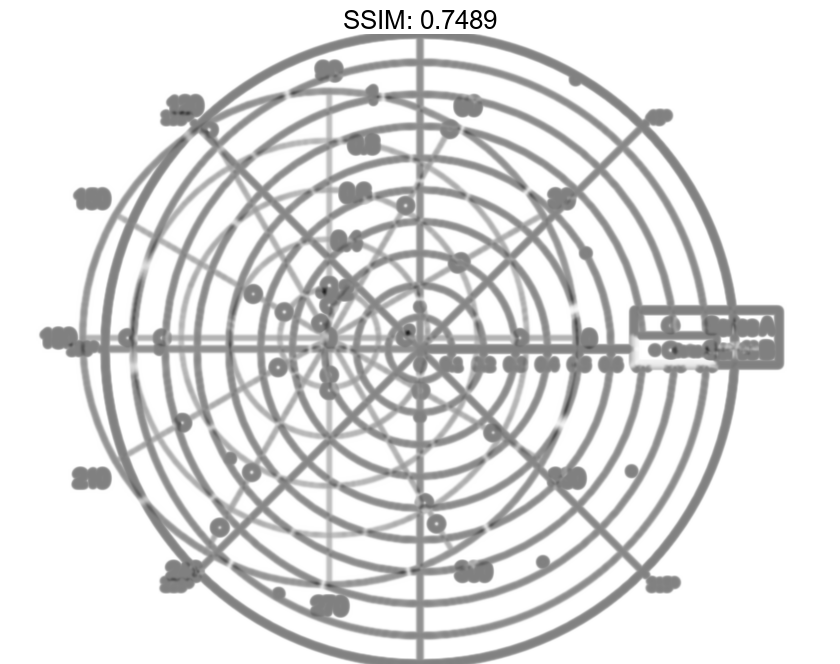
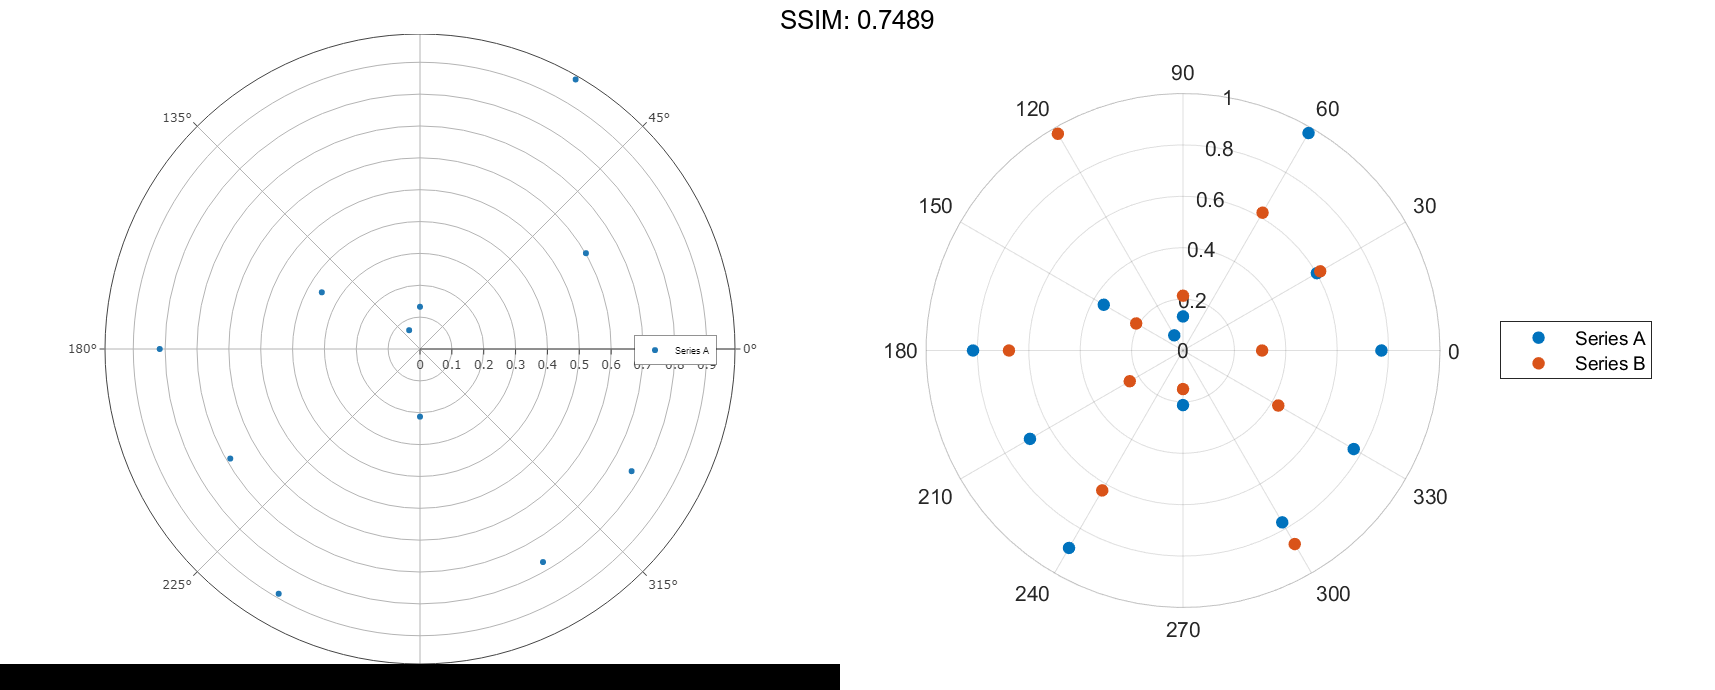
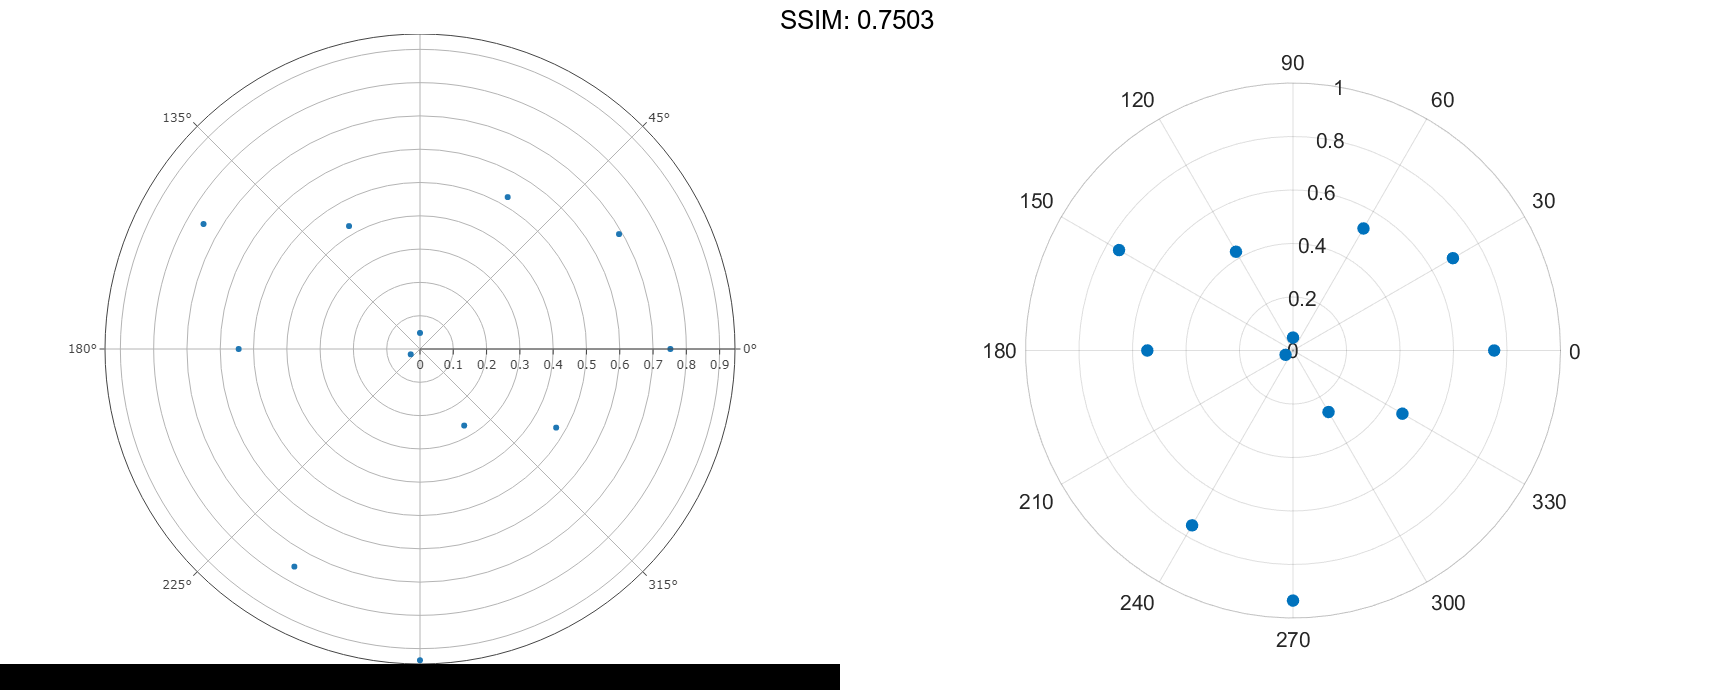
Combine Two Scatter Charts
Combine two scatter charts in the same polar axes using the hold command. Add a legend with a description of each chart.
th = pi/6:pi/6:2*pi;
r1 = rand(12,1);
polarscatter(th,r1,'filled')

hold on
r2 = rand(12,1);
polarscatter(th,r2,'filled')
hold off

legend('Series A','Series B')

fig2plotly()
Modify Scatter Chart After Creation
Create a scatter chart and assign the scatter object to the variable ps.
th = pi/6:pi/6:2*pi; r = rand(12,1); ps = polarscatter(th,r,'filled')
ps =
  Scatter with properties:

             Marker: 'o'
    MarkerEdgeColor: 'none'
    MarkerFaceColor: 'flat'
           SizeData: 36
          LineWidth: 0.5000
          ThetaData: [1x12 double]
              RData: [1x12 double]
              ZData: [1x0 double]
              CData: [0 0.4470 0.7410]

  Show all properties
ps.Marker = 'square';
ps.SizeData = 200;
ps.MarkerFaceColor = 'red';
ps.MarkerFaceAlpha = .5;

fig2plotly()