MATLAB polarplot in MATLAB®
Learn how to make 8 polarplot charts in MATLAB, then publish them to the Web with Plotly.
Create Polar Plot
Plot a line in polar coordinates.
theta = 0:0.01:2*pi;
rho = sin(2*theta).*cos(2*theta);
polarplot(theta,rho)

fig2plotly('TreatAs', 'polarplot')


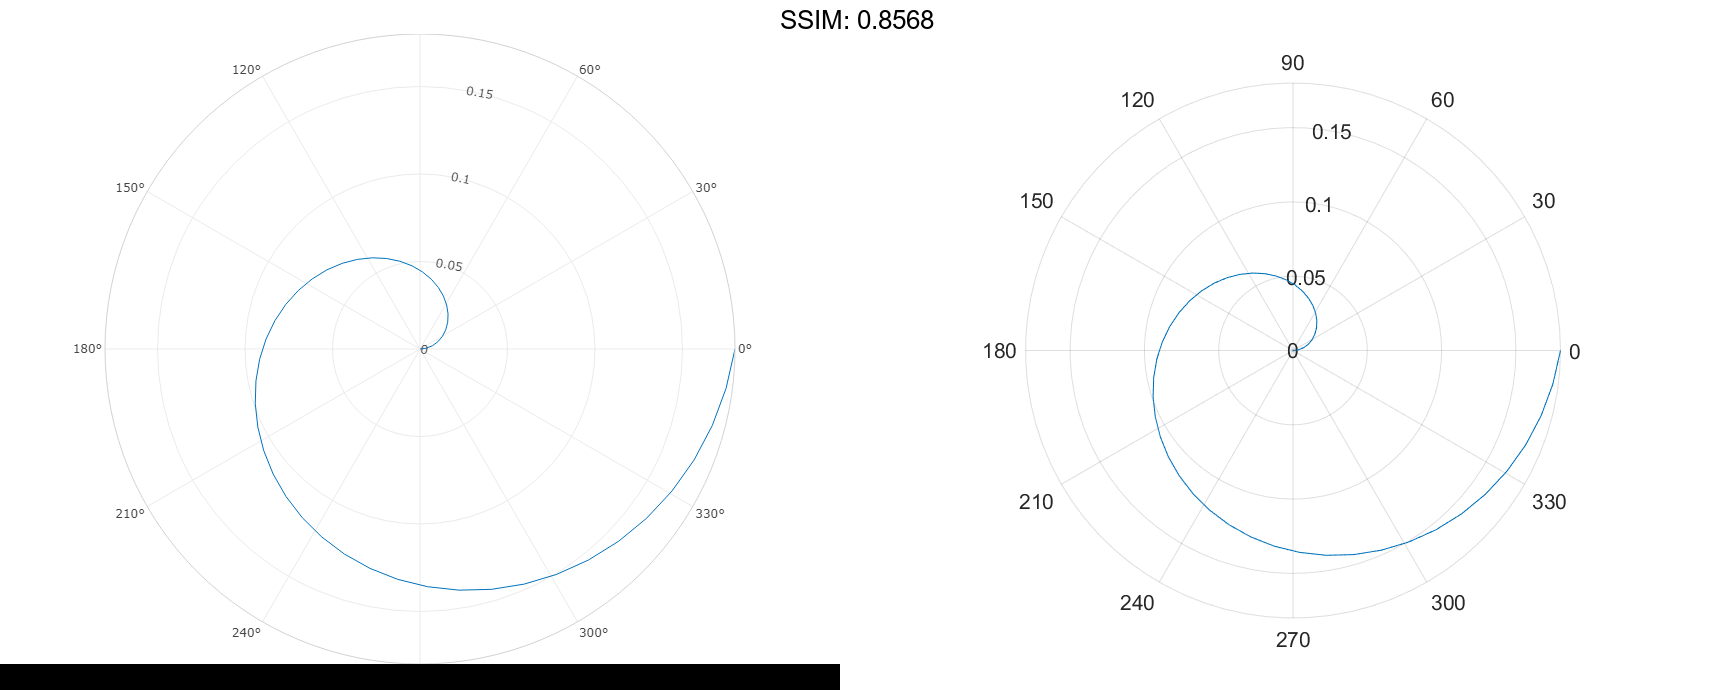
Convert from Degrees to Radians Before Plotting
Create the data to plot.
theta = linspace(0,360,50); rho = 0.005*theta/10;
Convert the values in theta from degrees to radians. Then, plot the data in polar coordinates.
theta_radians = deg2rad(theta);
polarplot(theta_radians,rho)

fig2plotly('TreatAs', 'polarplot')

Plot Multiple Lines in Polar Coordinates
Plot two lines in polar coordinates. Use a dashed line for the second line.
theta = linspace(0,6*pi);
rho1 = theta/10;
polarplot(theta,rho1)

rho2 = theta/12;
hold on
polarplot(theta,rho2,'--')
hold off

fig2plotly('TreatAs', 'polarplot')


Plot Radius Values at Equally Spaced Angles
Specify only the radius values, without specifying the angle values. polarplot plots the radius values at equally spaced angles that span from 0 to 2π. Display a circle marker at each data point.
rho = 10:5:70;
polarplot(rho,'-o')

fig2plotly('TreatAs', 'polarplot')


Plot Negative Radius Values
Create a polar plot using negative radius values. By default, polarplot reflects negative values through the origin.
theta = linspace(0,2*pi);
rho = sin(theta);
polarplot(theta,rho)

fig2plotly('TreatAs', 'polarplot')


Change the limits of the r-axis so it ranges from -1 to 1.
rlim([-1 1])
Specify Line Color for Polar Plot
Create a polar plot using a red line with circle markers.
theta = linspace(0,2*pi,25);
rho = 2*theta;
polarplot(theta,rho,'r-o')

fig2plotly('TreatAs', 'polarplot')


Specify Line Color After Creation
Create a polar plot and return the chart line object.
theta = linspace(0,2pi,25); rho = 2theta; p = polarplot(theta,rho);


Change the line color and width and add markers.
p.Color = 'magenta';
p.Marker = 'square';
p.MarkerSize = 8;

fig2plotly('TreatAs', 'polarplot')


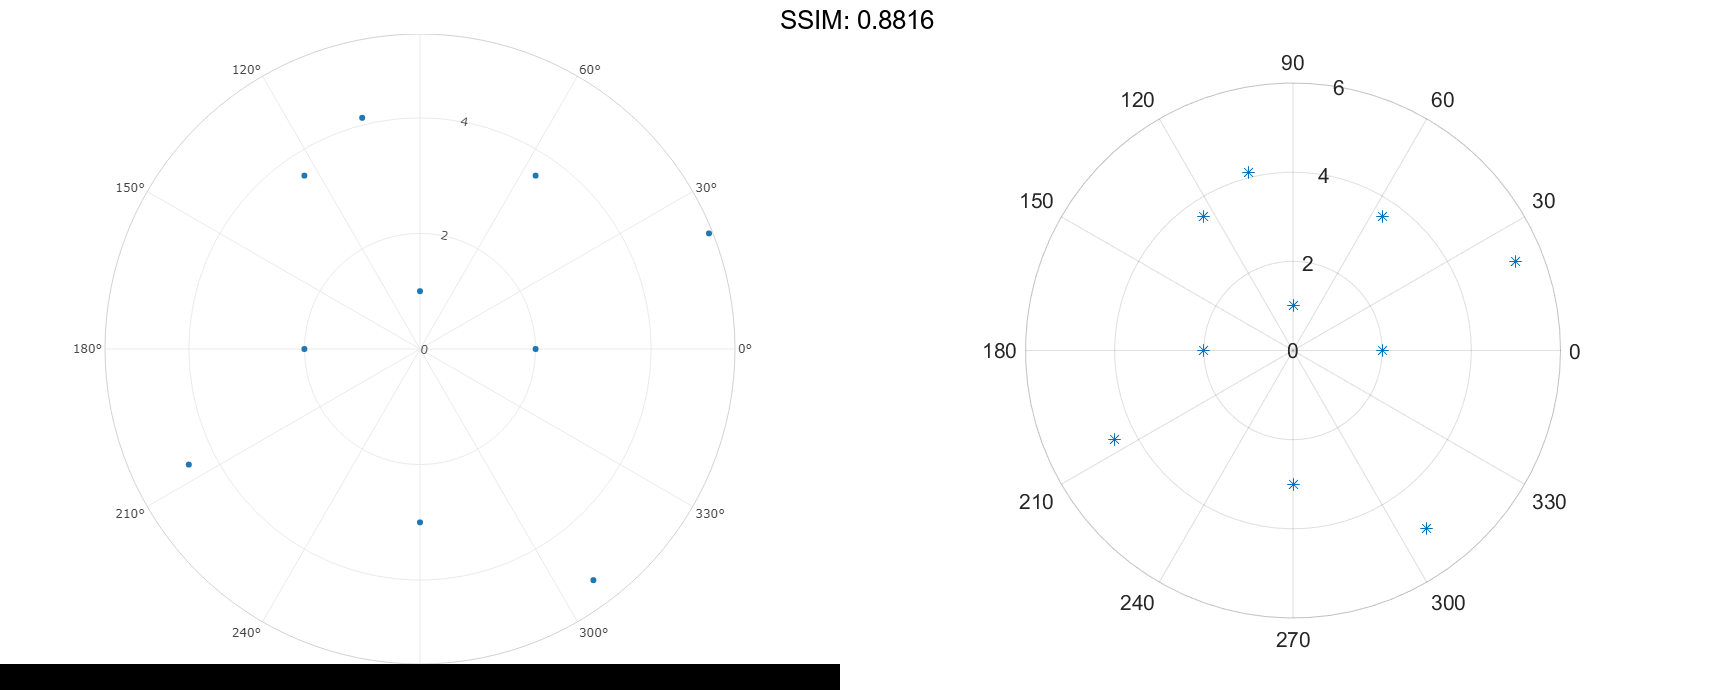
Create Polar Plot with Complex Values
Plot complex values in polar coordinates. Display markers at each point without a line connecting them.
Z = [2+3i 2 -1+4i 3-4i 5+2i -4-2i -2+3i -2 -3i 3i-2i];
polarplot(Z,'*')

fig2plotly('TreatAs', 'polarplot')