MATLAB plot3 in MATLAB®
Learn how to make 11 plot3 charts in MATLAB, then publish them to the Web with Plotly.
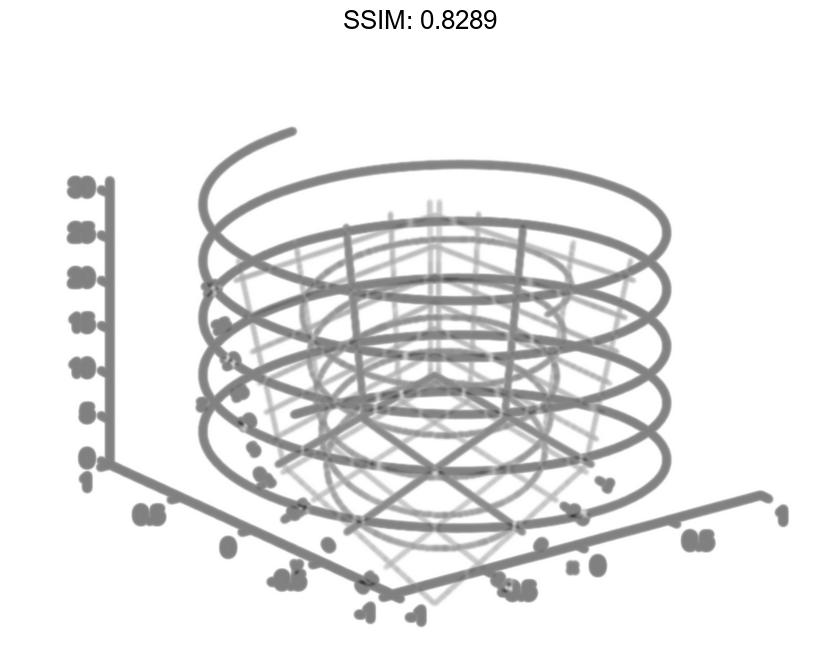
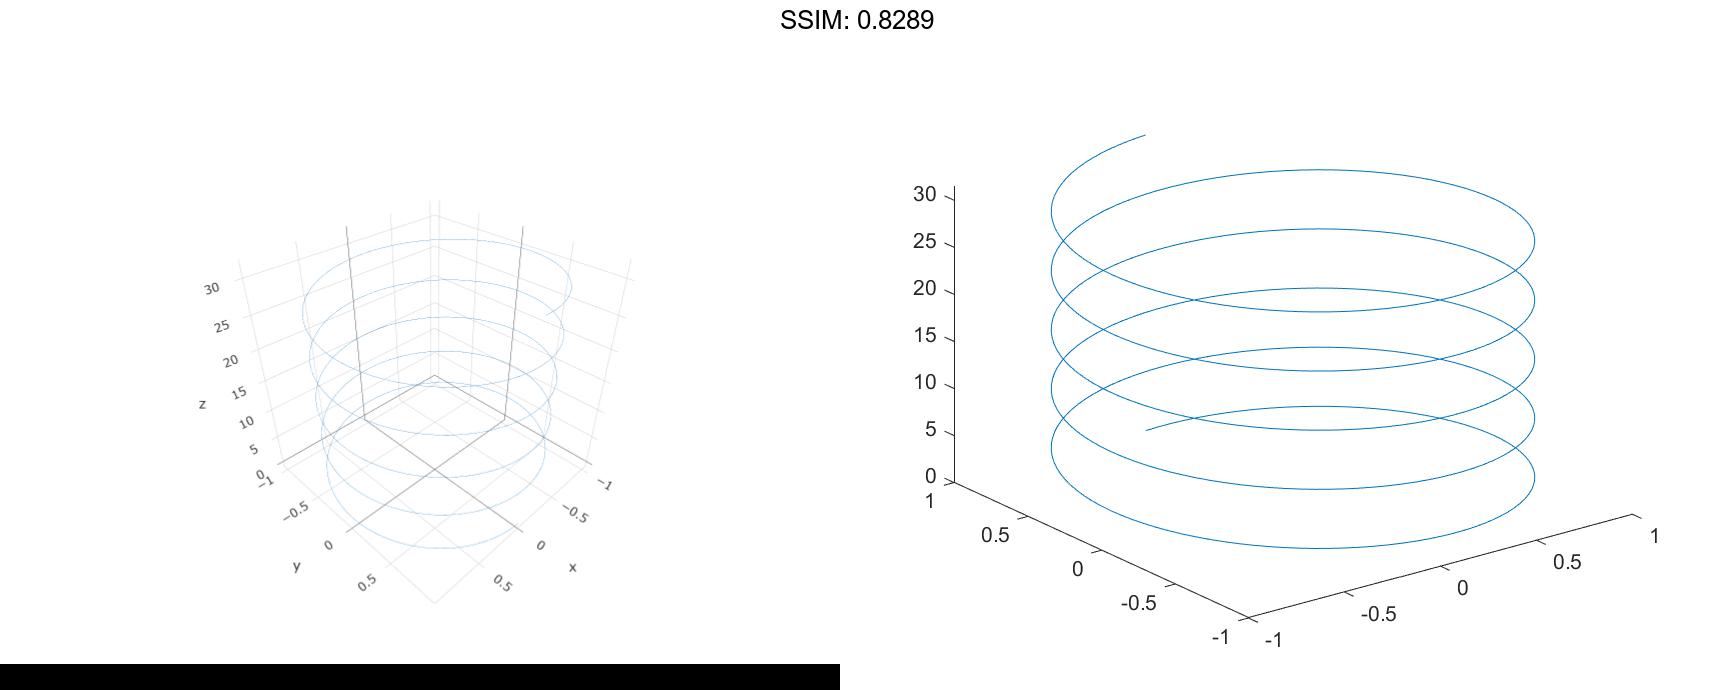
Plot 3-D Helix
Define t as a vector of values between 0 and 10π. Define st and ct as vectors of sine and cosine values. Then plot st, ct, and t.
t = 0:pi/50:10*pi;
st = sin(t);
ct = cos(t);
plot3(st,ct,t)

fig2plotly()
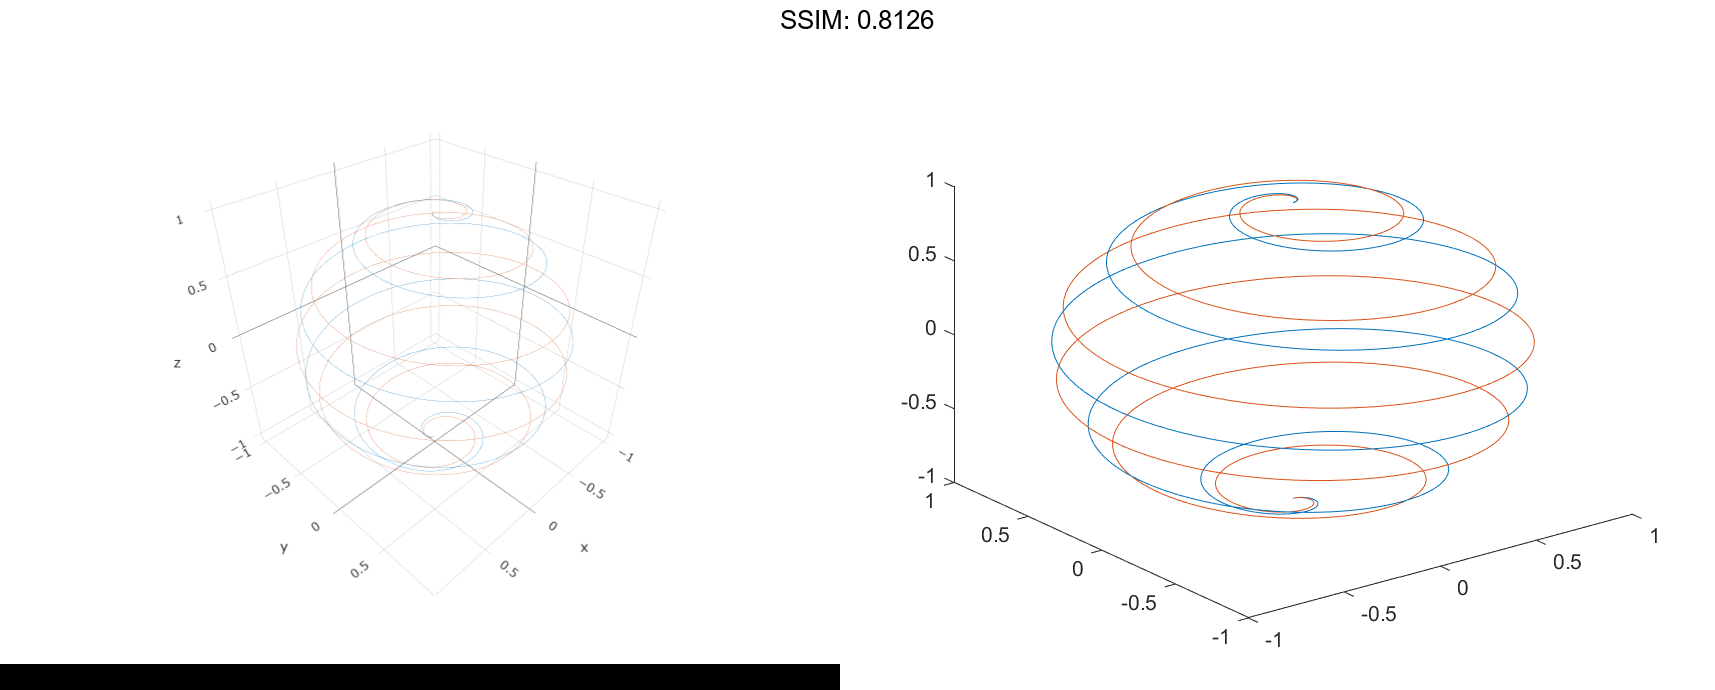
Plot Multiple Lines
Create two sets of x-, y-, and z-coordinates.
t = 0:pi/500:pi; xt1 = sin(t).cos(10t); yt1 = sin(t).sin(10t); zt1 = cos(t);
xt2 = sin(t).cos(12t); yt2 = sin(t).sin(12t); zt2 = cos(t);
Call the plot3 function, and specify consecutive XYZ triplets.
plot3(xt1,yt1,zt1,xt2,yt2,zt2)

fig2plotly()
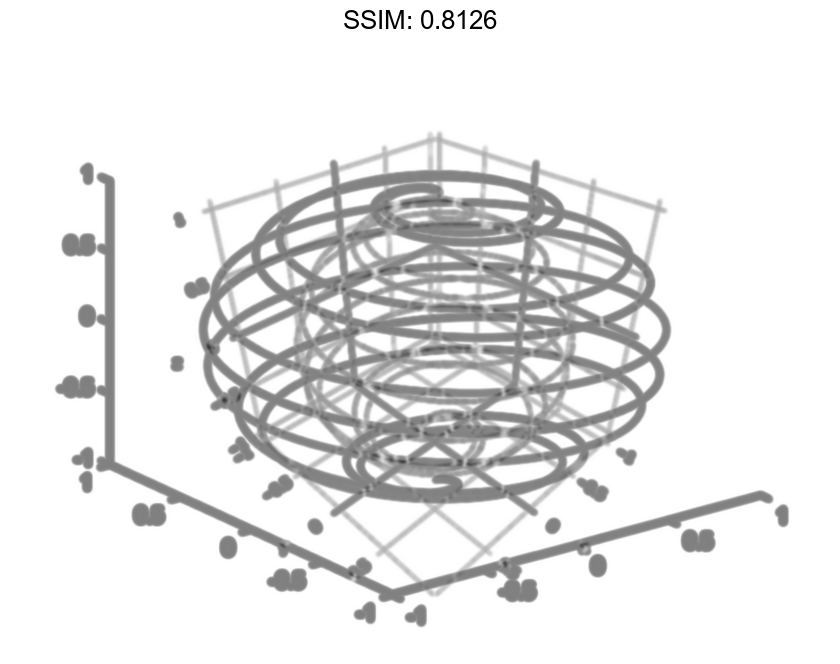
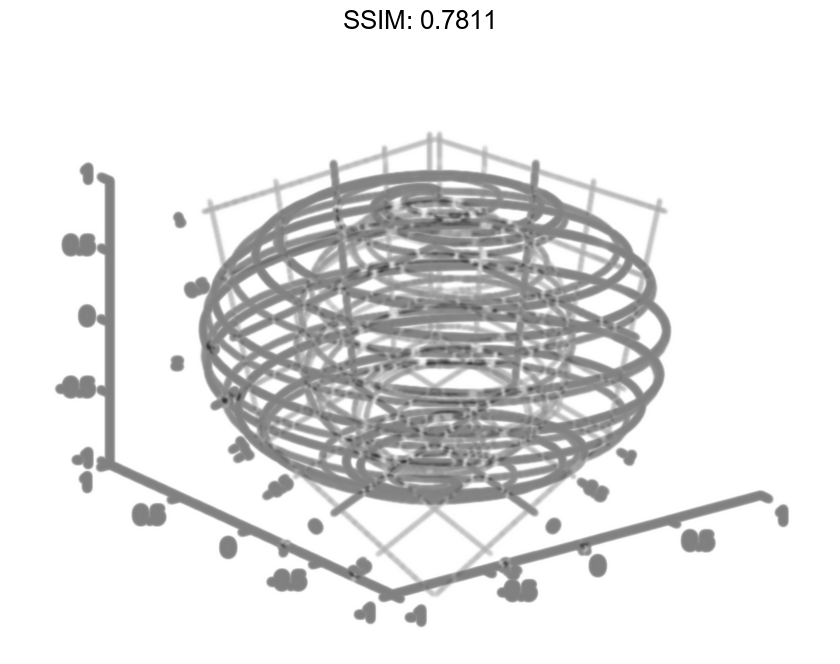
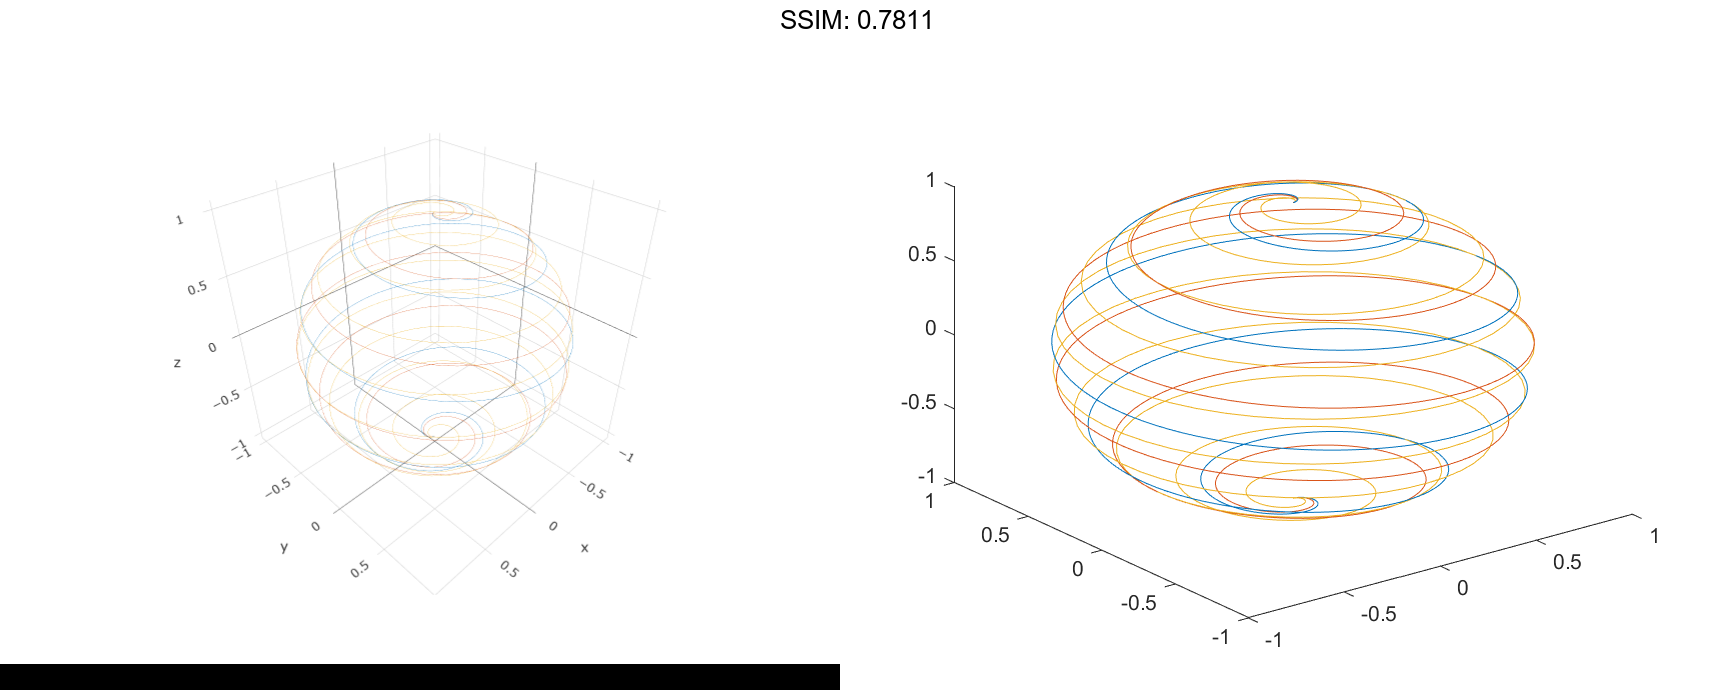
Plot Multiple Lines Using Matrices
Create matrix X containing three rows of x-coordinates. Create matrix Y containing three rows of y-coordinates.
t = 0:pi/500:pi; X(1,:) = sin(t).cos(10t); X(2,:) = sin(t).cos(12t); X(3,:) = sin(t).cos(20t);
Y(1,:) = sin(t).sin(10t); Y(2,:) = sin(t).sin(12t); Y(3,:) = sin(t).sin(20t);
Create matrix Z containing the z-coordinates for all three sets.
Z = cos(t);
Plot all three sets of coordinates on the same set of axes.
plot3(X,Y,Z)

fig2plotly()
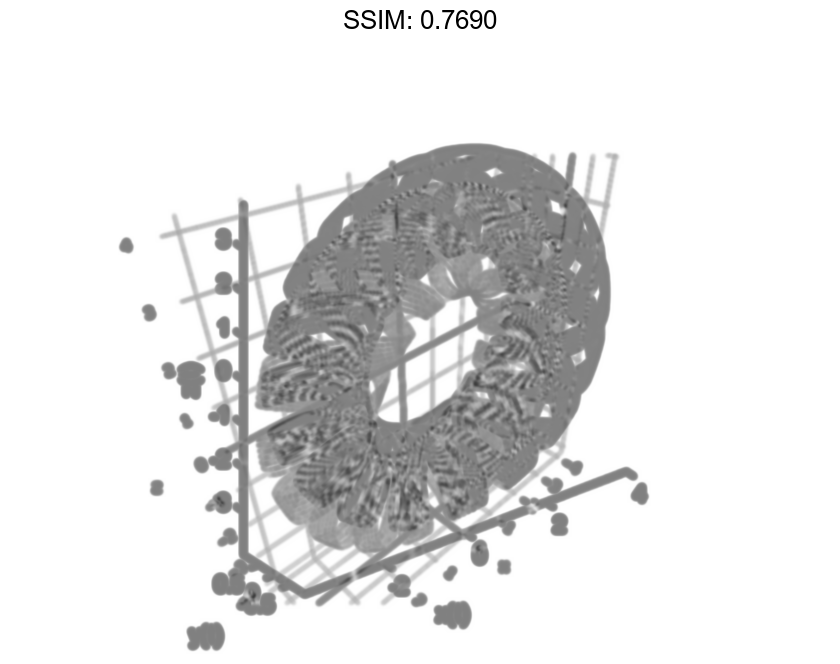
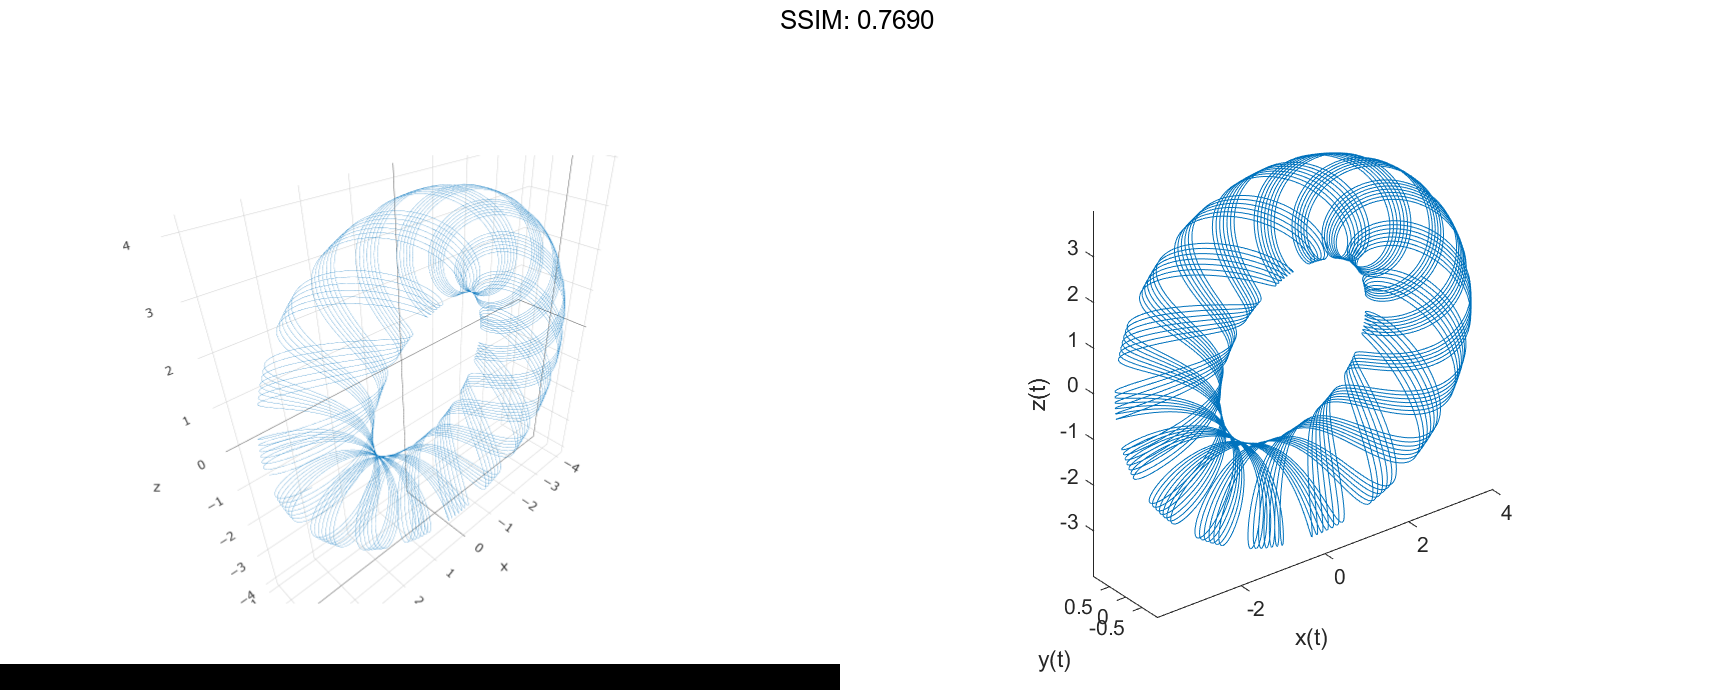
Specify Equally-Spaced Tick Units and Axis Labels
Create vectors xt, yt, and zt.
t = 0:pi/500:40pi; xt = (3 + cos(sqrt(32)t)).cos(t); yt = sin(sqrt(32) * t); zt = (3 + cos(sqrt(32)t)).*sin(t);
Plot the data, and use the axis equal command to space the tick units equally along each axis. Then specify the labels for each axis.
plot3(xt,yt,zt)
axis equal
xlabel('x(t)')
ylabel('y(t)')
zlabel('z(t)')

fig2plotly()
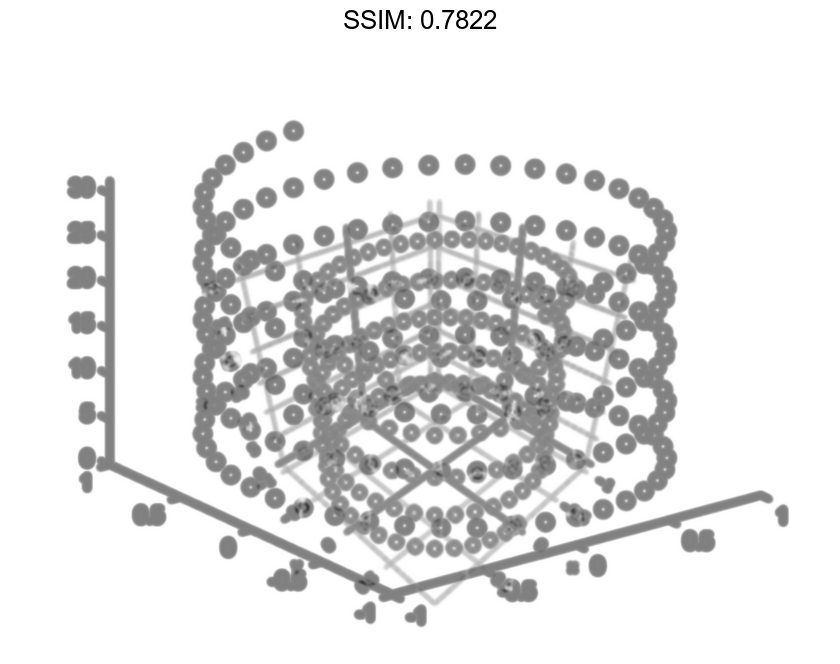
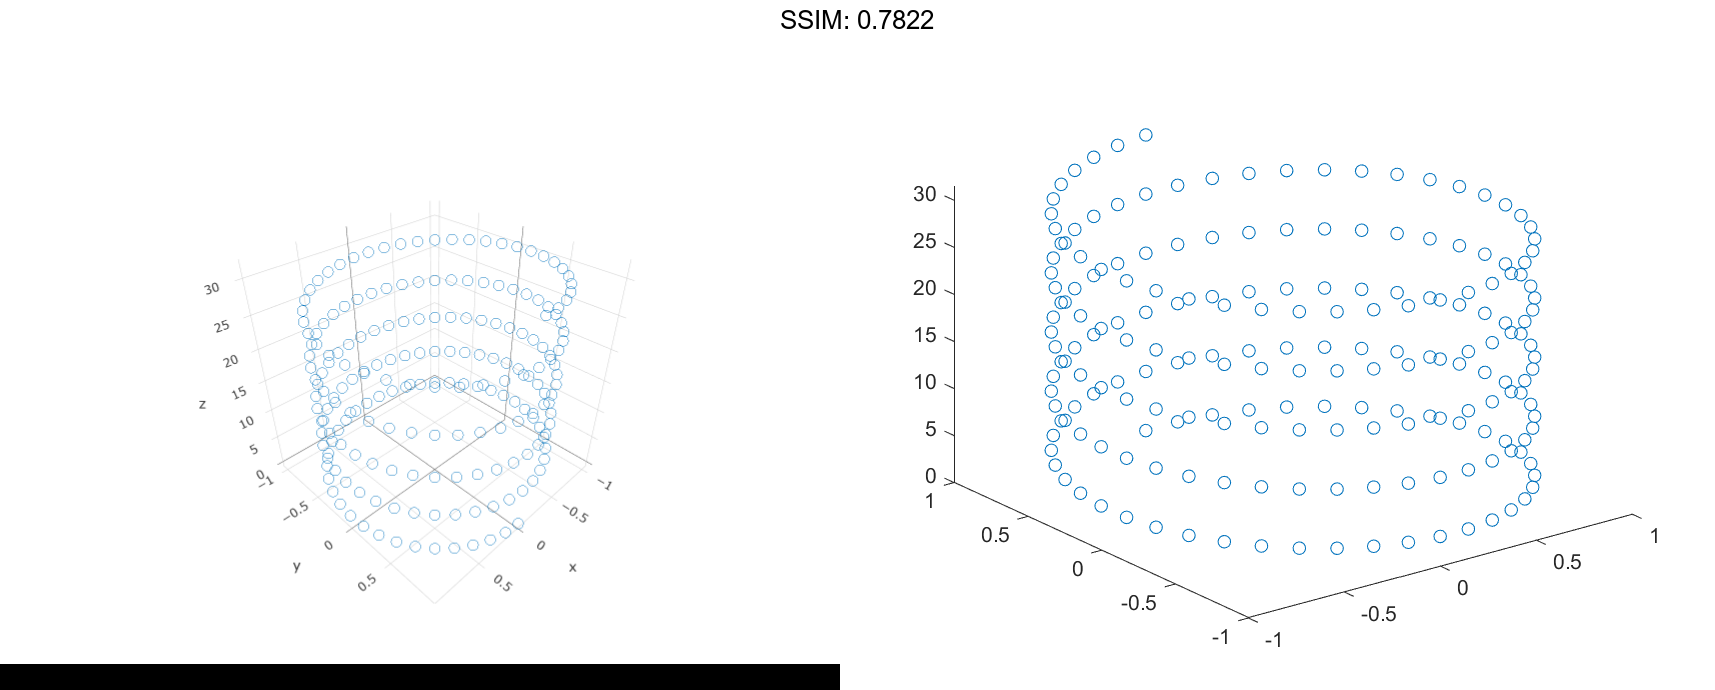
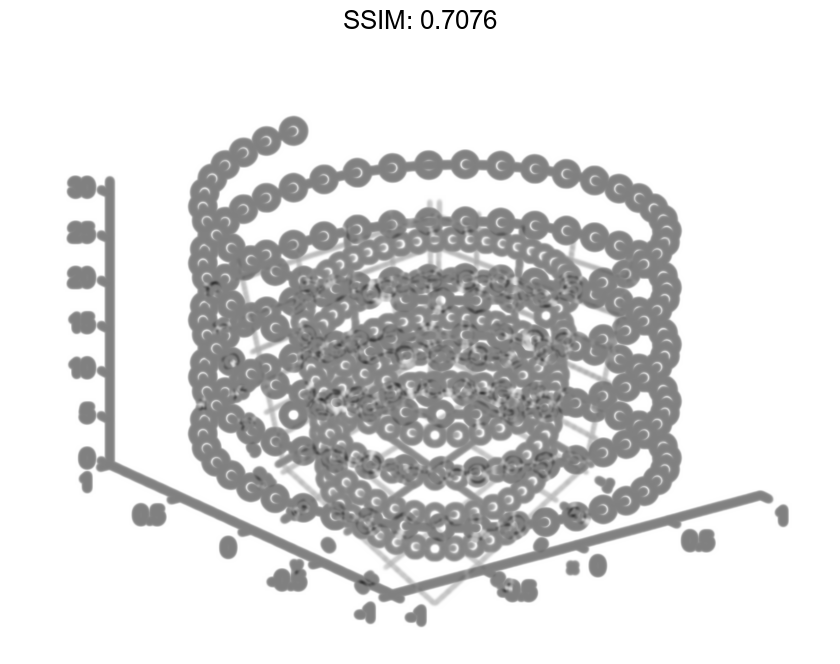
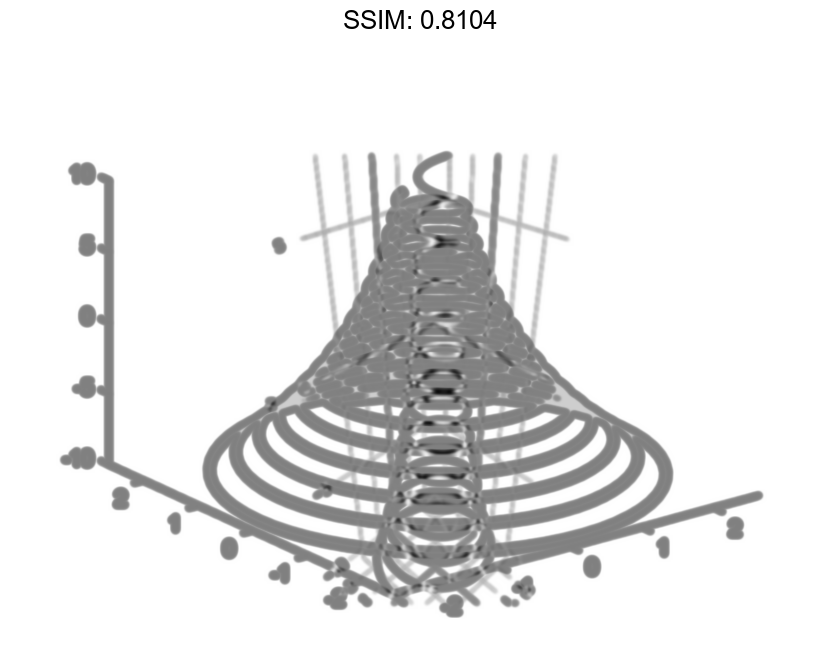
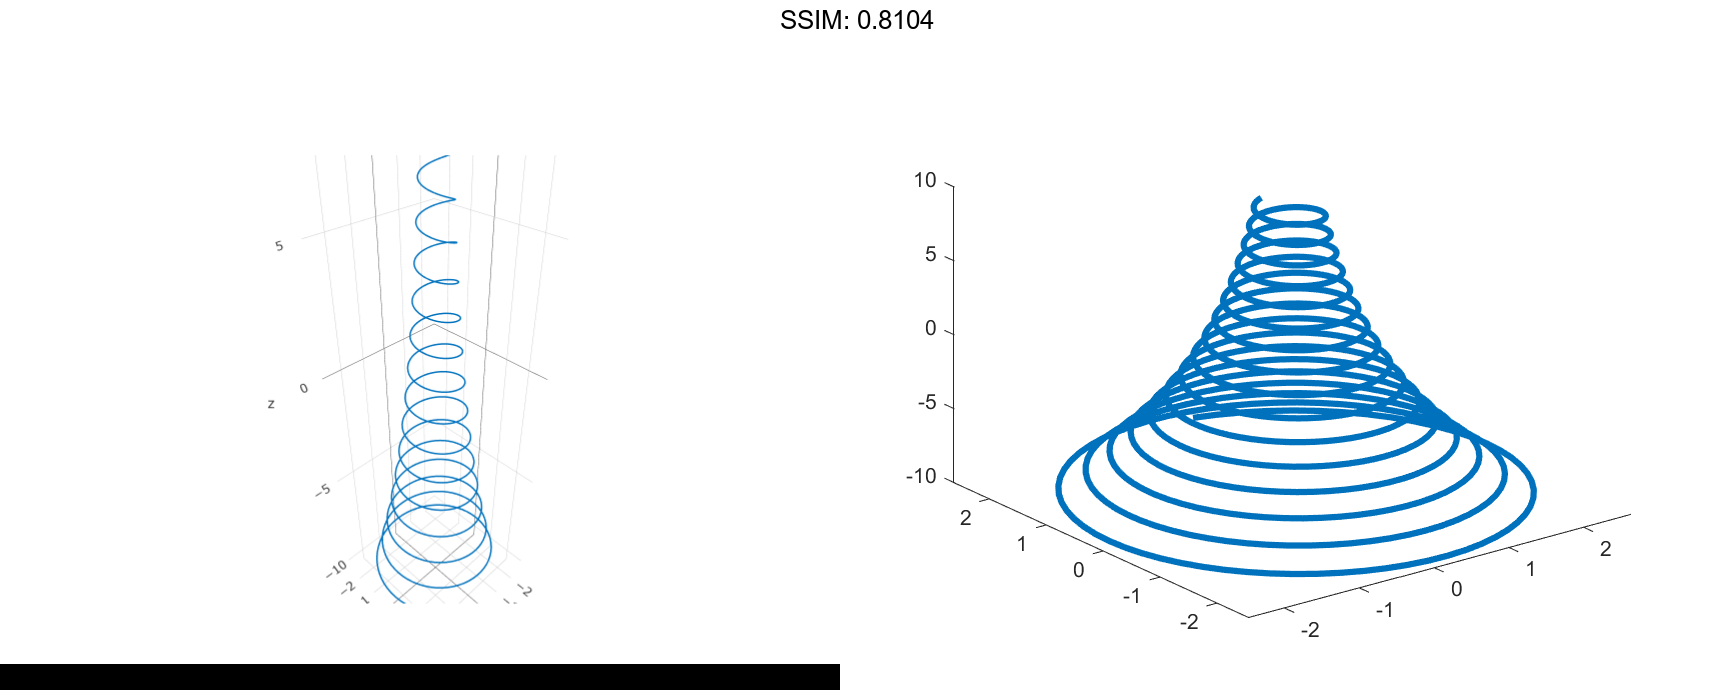
Plot Points as Markers Without Lines
Create vectors t, xt, and yt, and plot the points in those vectors using circular markers.
t = 0:pi/20:10*pi;
xt = sin(t);
yt = cos(t);
plot3(xt,yt,t,'o')

fig2plotly()
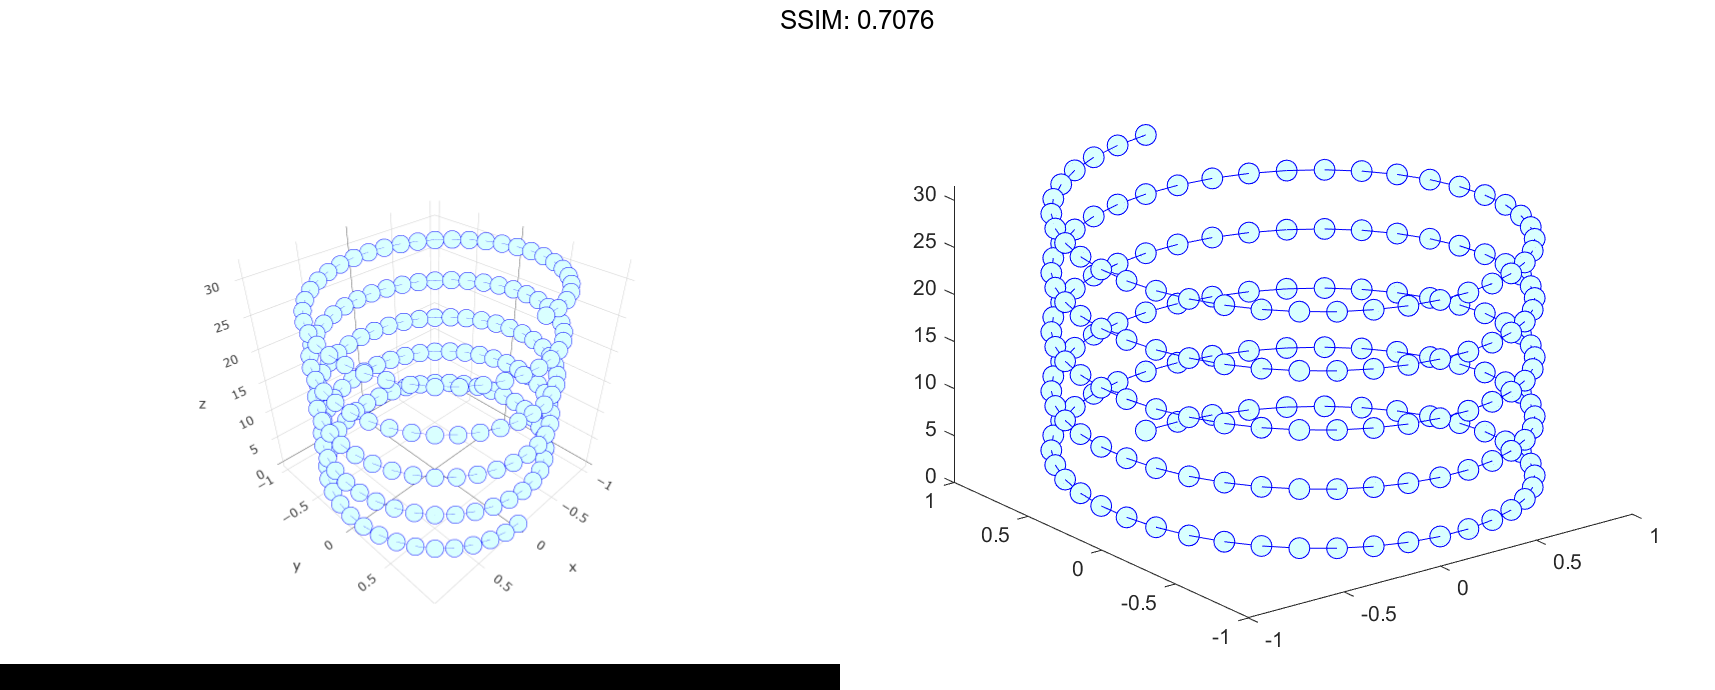
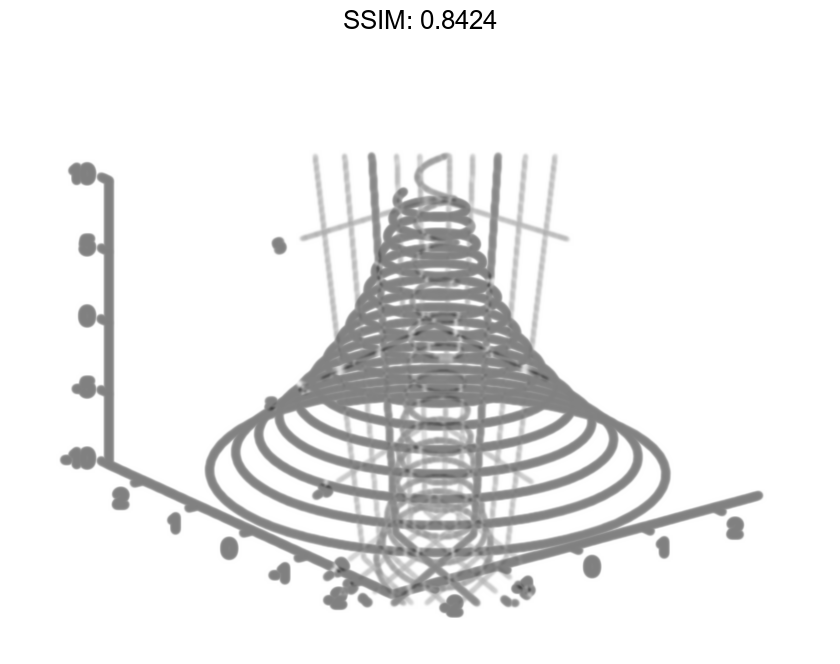
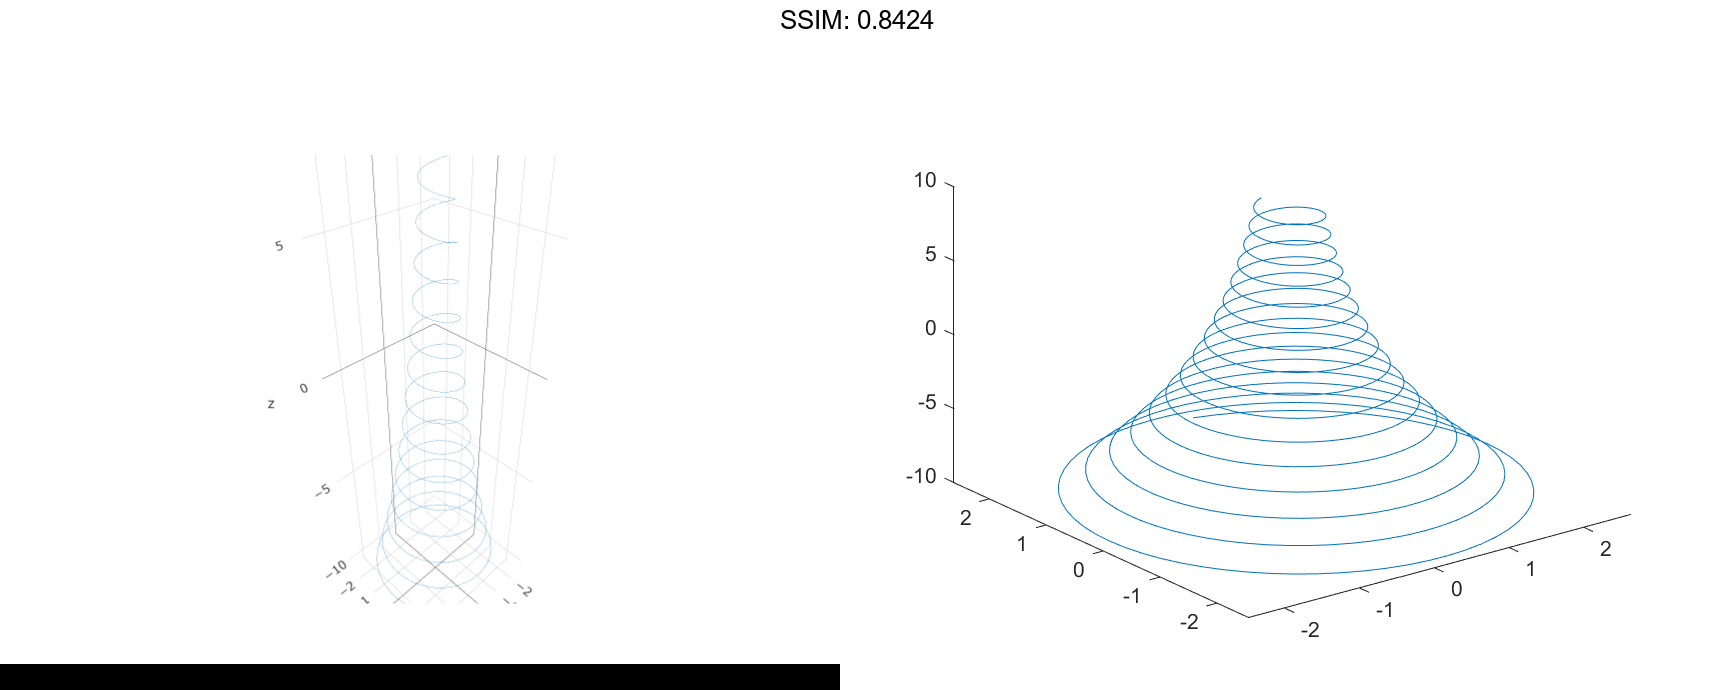
Customize Color and Marker
Create vectors t, xt, and yt, and plot the points in those vectors as a blue line with 10-point circular markers. Use a hexadecimal color code to specify a light blue fill color for the markers.
t = 0:pi/20:10*pi;
xt = sin(t);
yt = cos(t);
plot3(xt,yt,t,'-o','Color','b','MarkerSize',10,'MarkerFaceColor','#D9FFFF')

fig2plotly()
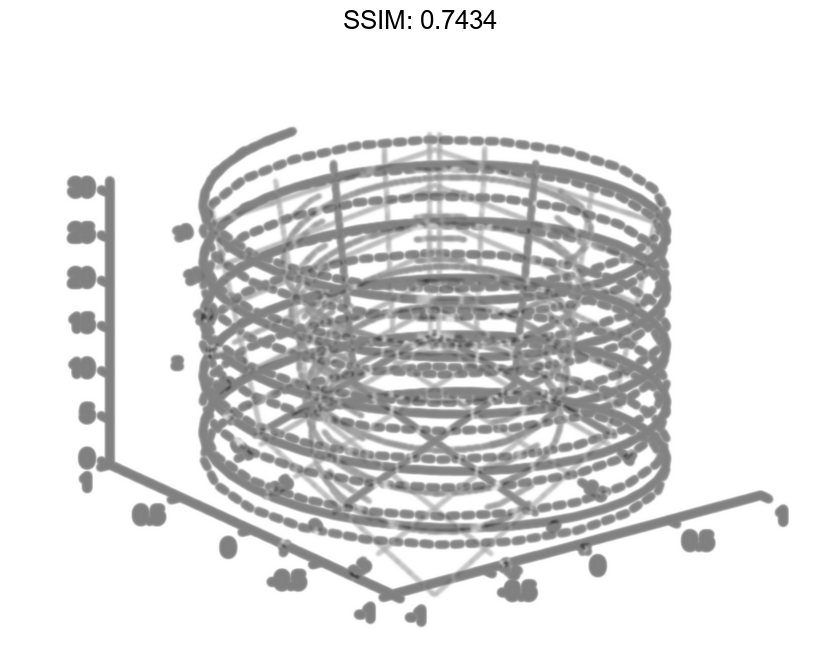
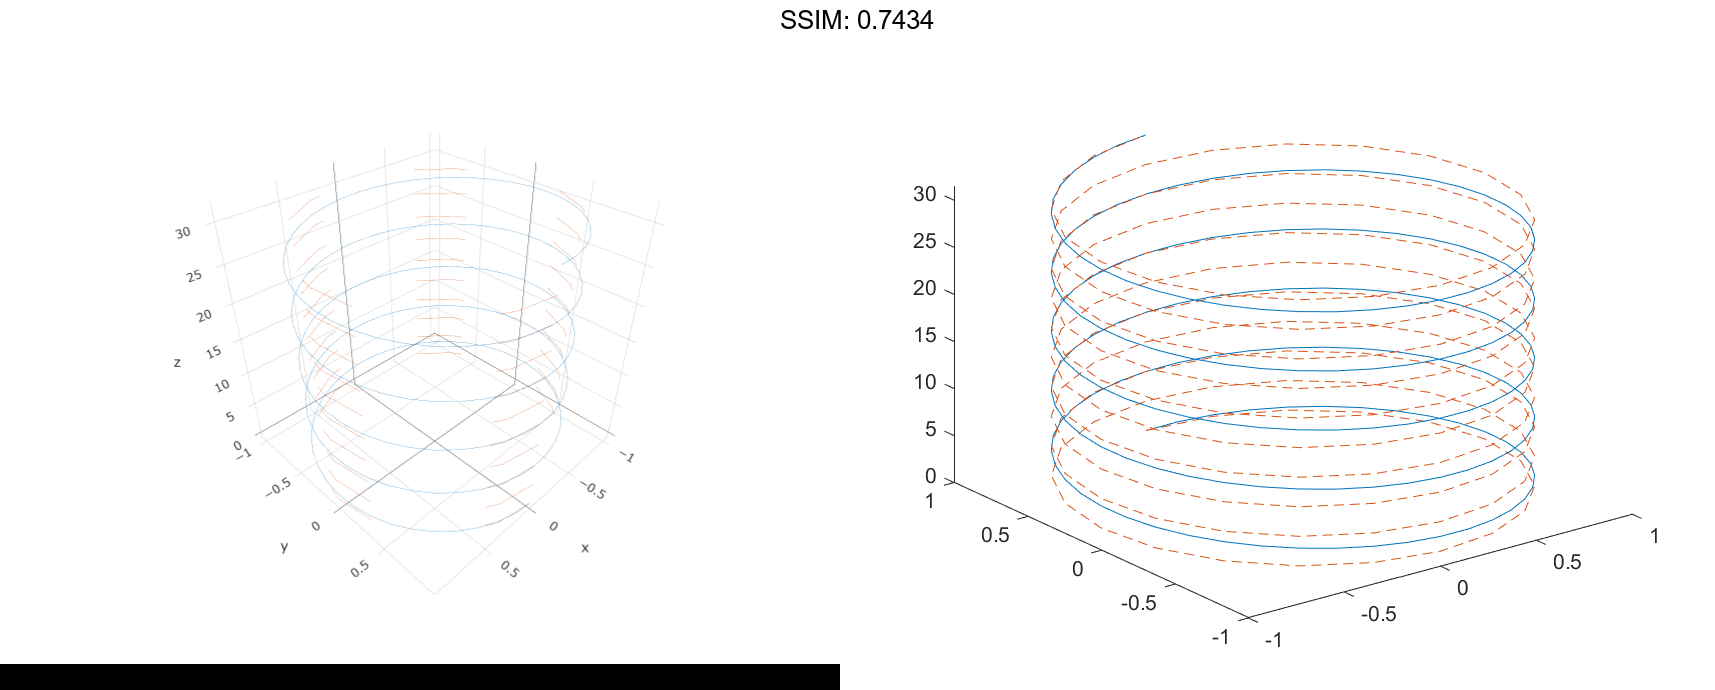
Specify Line Style
Create vector t. Then use t to calculate two sets of x and y values.
t = 0:pi/20:10*pi; xt1 = sin(t); yt1 = cos(t);
xt2 = sin(2t); yt2 = cos(2t);
Plot the two sets of values. Use the default line for the first set, and specify a dashed line for the second set.
plot3(xt1,yt1,t,xt2,yt2,t,'--')

fig2plotly()
Modify Line After Plotting
Create vectors t, xt, and yt, and plot the data in those vectors. Return the chart line in the output variable p.
t = linspace(-10,10,1000); xt = exp(-t./10).sin(5t); yt = exp(-t./10).cos(5t); p = plot3(xt,yt,t);
Change the line width to 3.
p.LineWidth = 3;

fig2plotly()
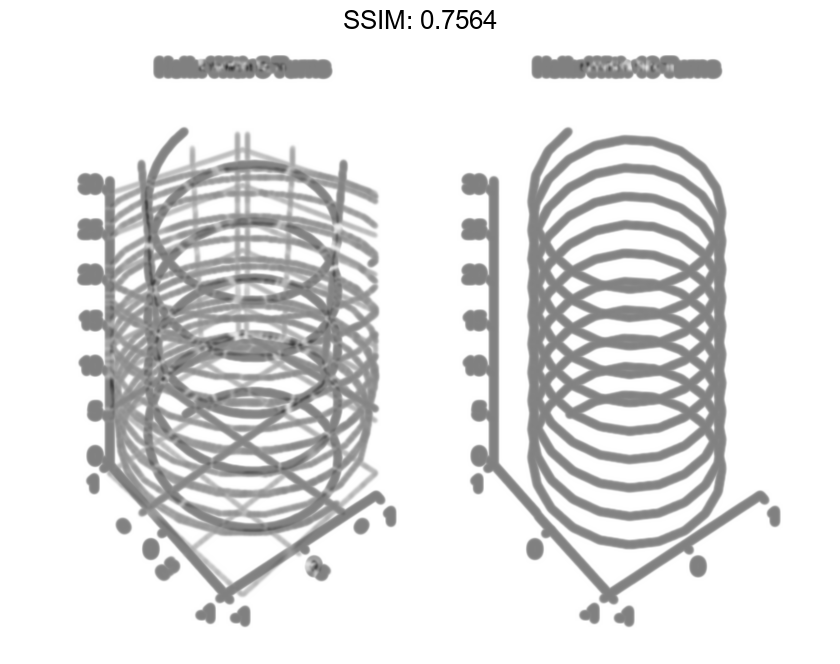
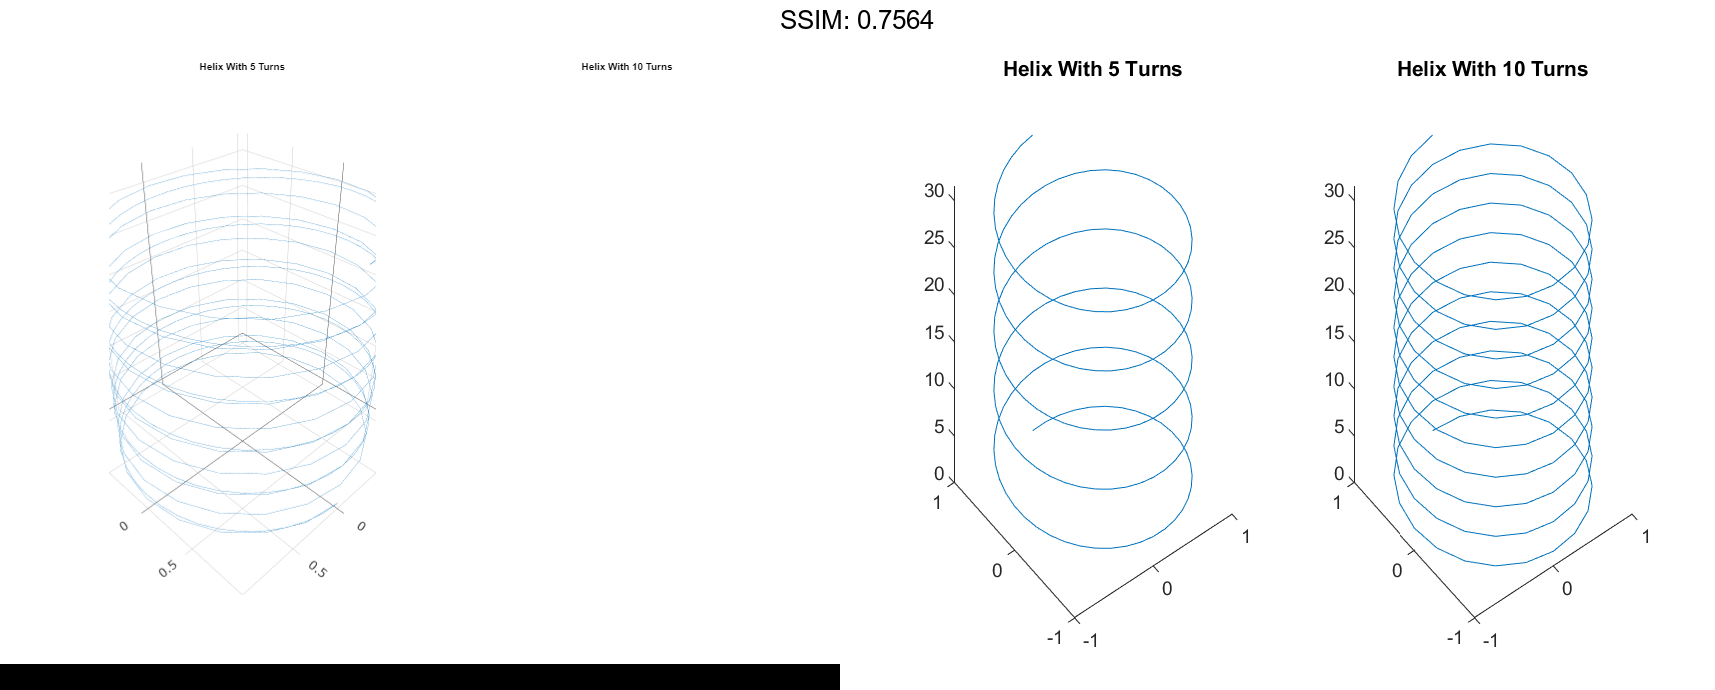
Specify Target Axes
Starting in R2019b, you can display a tiling of plots using the tiledlayout and nexttile functions. Call the tiledlayout function to create a 1-by-2 tiled chart layout. Call the nexttile function to create the axes objects ax1 and ax2. Create separate line plots in the axes by specifying the axes object as the first argument to plot3.
tiledlayout(1,2)

% Left plot
ax1 = nexttile;
t = 0:pi/20:10*pi;
xt1 = sin(t);
yt1 = cos(t);
plot3(ax1,xt1,yt1,t)
title(ax1,'Helix With 5 Turns')

% Right plot
ax2 = nexttile;
t = 0:pi/20:10*pi;
xt2 = sin(2*t);
yt2 = cos(2*t);
plot3(ax2,xt2,yt2,t)
title(ax2,'Helix With 10 Turns')

fig2plotly()
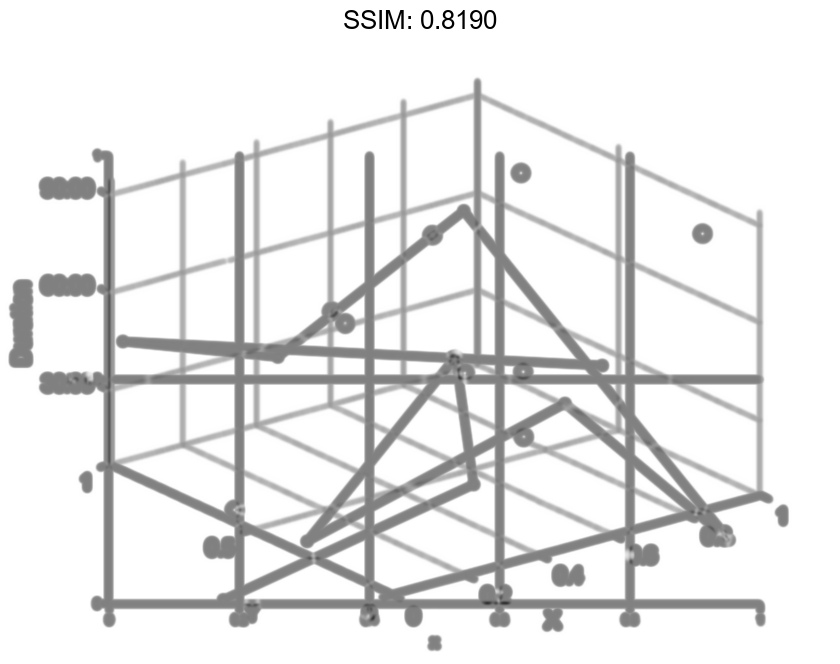
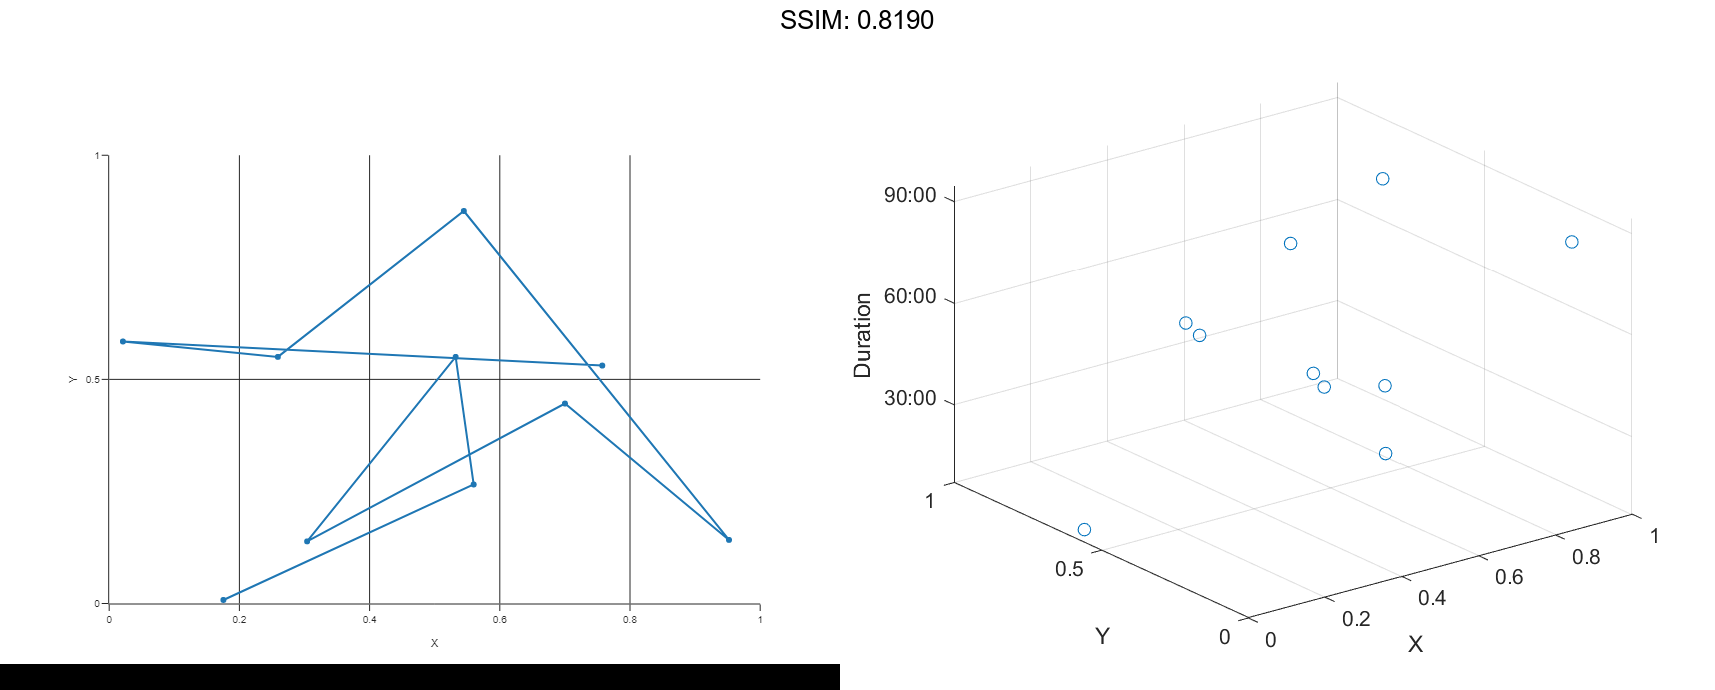
Plot Duration Data with Custom Tick Format
Create x and y as vectors of random values between 0 and 1. Create z as a vector of random duration values.
x = rand(1,10); y = rand(1,10); z = duration(rand(10,1),randi(60,10,1),randi(60,10,1));
Plot x, y, and z, and specify the format for the z-axis as minutes and seconds. Then add axis labels, and turn on the grid to make it easier to visualize the points within the plot box.
plot3(x,y,z,'o','DurationTickFormat','mm:ss')
xlabel('X')
ylabel('Y')
zlabel('Duration')
grid on

fig2plotly()
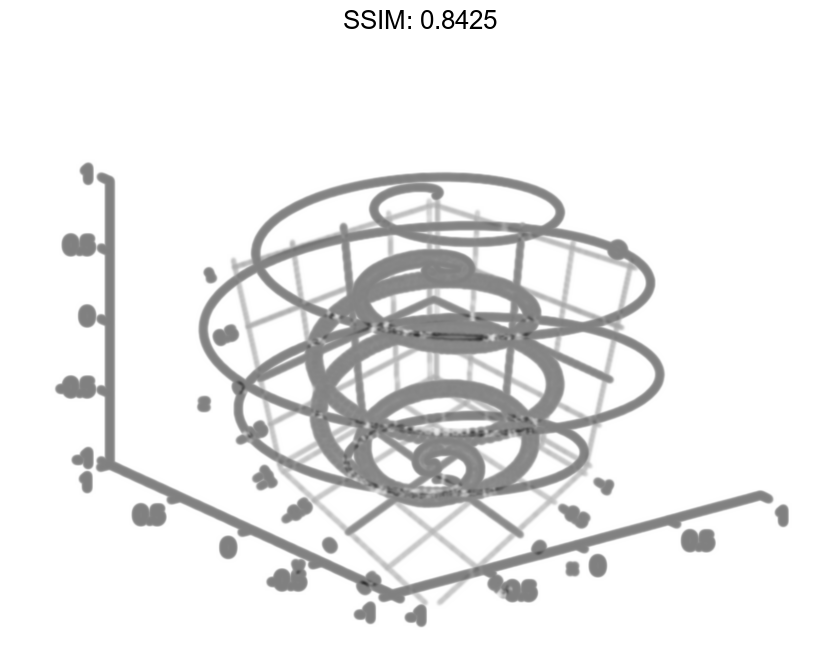
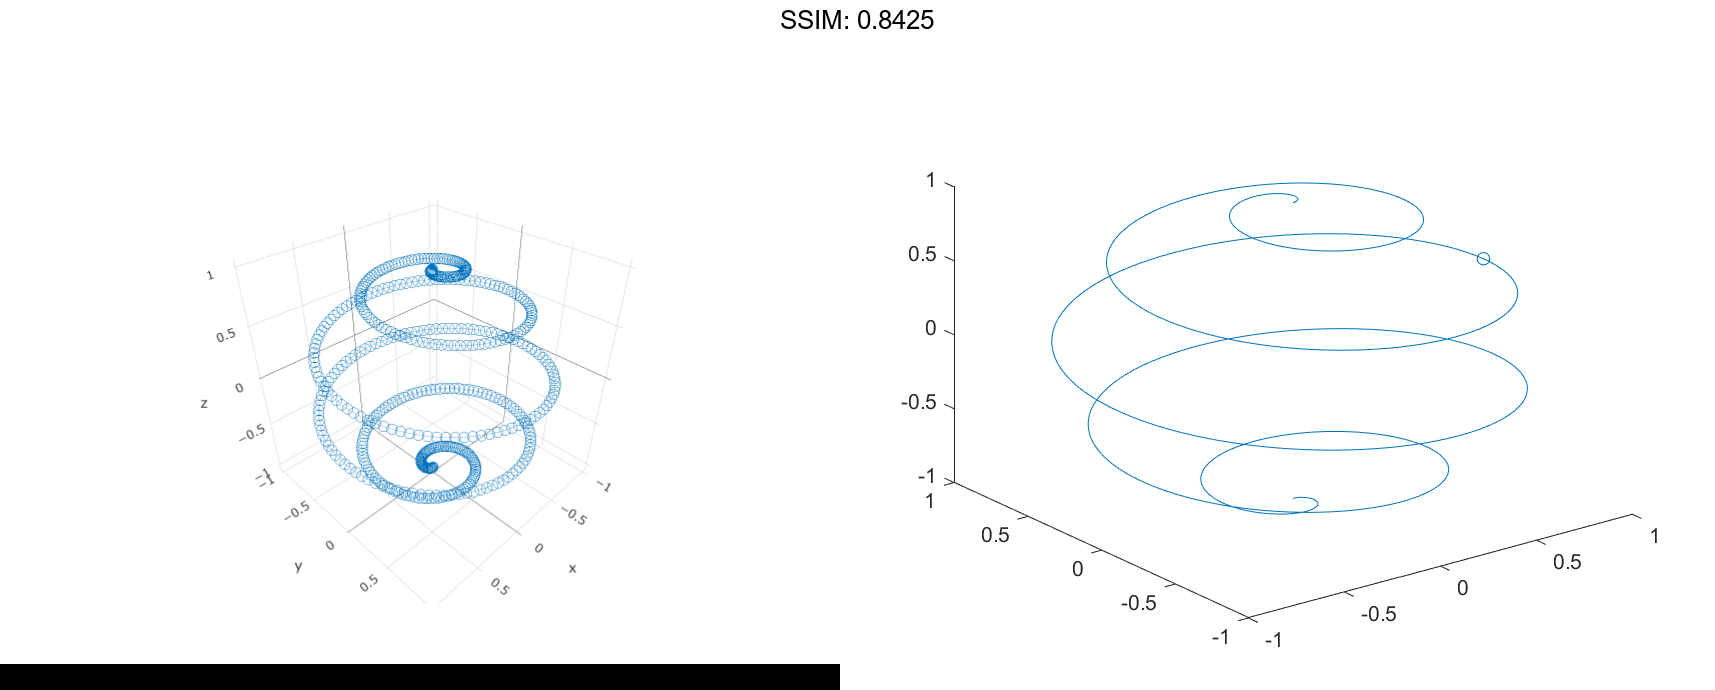
Plot Line With Marker at One Data Point
Create vectors xt, yt, and zt. Plot the values, specifying a solid line with circular markers using the LineSpec argument. Specify the MarkerIndices property to place one marker at the 200th data point.
t = 0:pi/500:pi;
xt(1,:) = sin(t).*cos(10*t);
yt(1,:) = sin(t).*sin(10*t);
zt = cos(t);
plot3(xt,yt,zt,'-o','MarkerIndices',200)

fig2plotly()